Many folks want to be able to display two baselines in Microsoft Project Gantt chart. This is so they can have one baseline that maintains the integrity of the project since inception and another to capture changes in scope. Here we explore how this is done.
In Microsoft Project 2013 it is possible to create up to ten baselines. Again, to maintain the integrity of the project you definitely want one baseline to be a snapshot of the project at commencement. This baseline should be subject to change management control. Additional baselines or snapshots of the project are useful for capturing scope changes and/or forecast estimate changes. It is possible to display two or more baselines on the Gantt chart for measuring schedule progress, as well as, these new scope and forecast developments.
This article demonstrates how to create and display two baselines on the Gantt chart in Microsoft Project 2013.
Let’s begin with our demonstration schedule, Figure 1.
 Figure 1
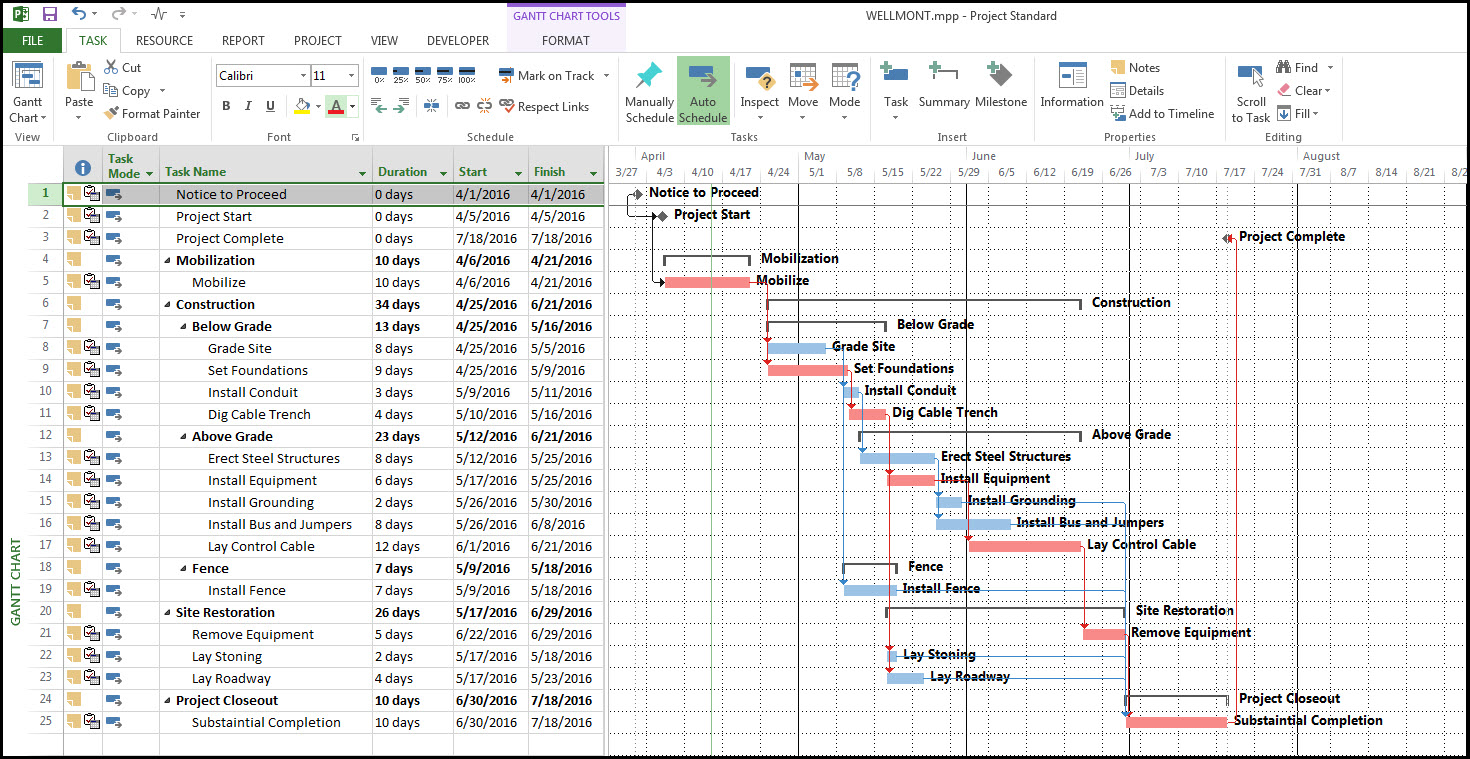
We will eventually want to display two baselines on this schedule to both maintain integrity and support forecast scheduling. To create our first baseline select the project tab, properties ribbon group, and set baseline, Figure 2.
Figure 2

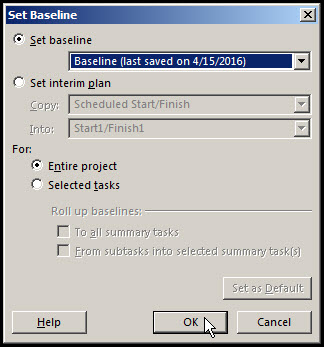
In the set baseline dialog, Figure 3, toggle both set baseline and for entire project.
Figure 3
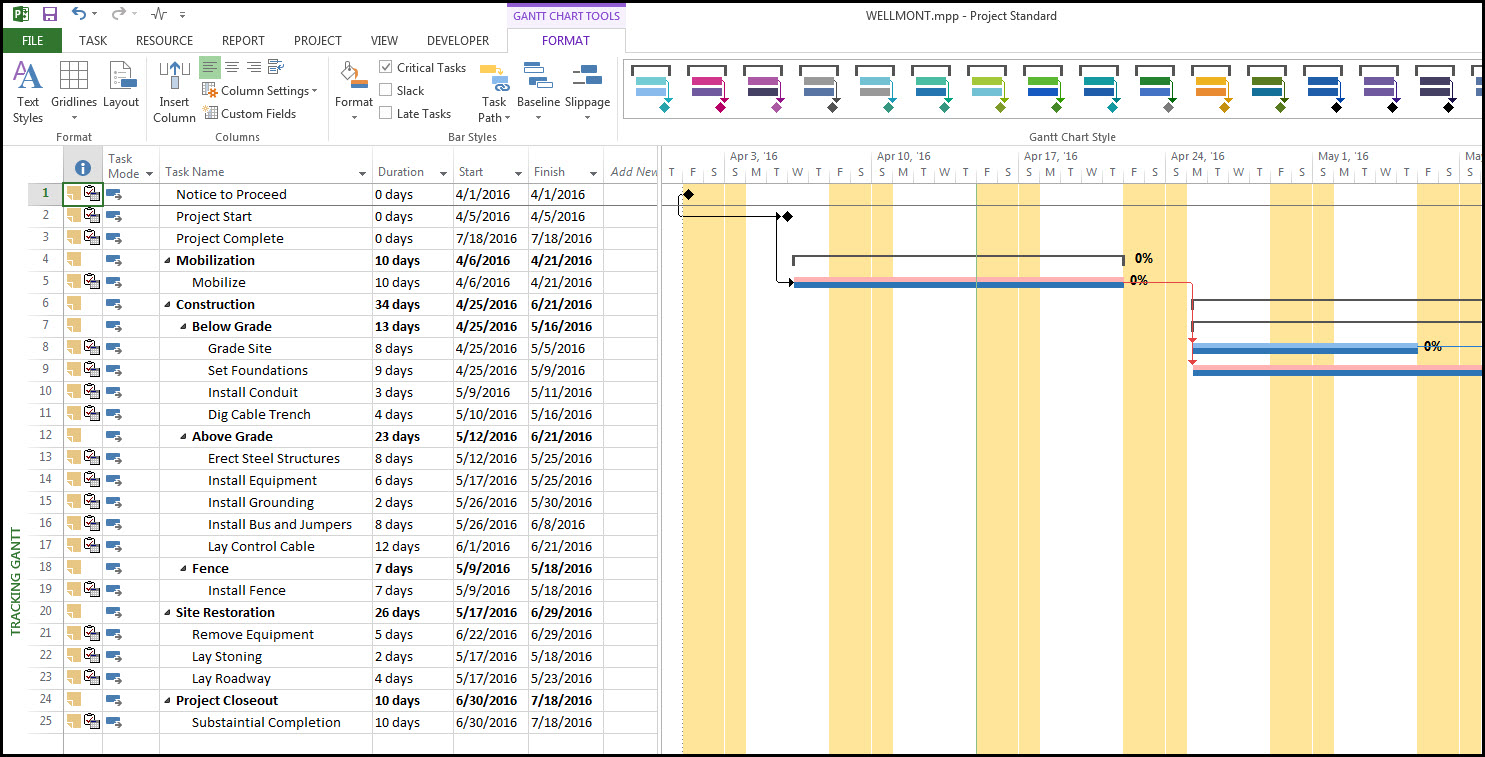
We now have our first baseline generated that we may display by selecting the tracking Gantt chart view, Figure 4.
Figure 4

In Figure 5, we have the schedule including baseline in blue.
Figure 5
Great! We now have our first baseline created and displayed. Refer to the following blog Setting up a Baseline in Microsoft Project 2013 for a more in-depth look at baseline basics.
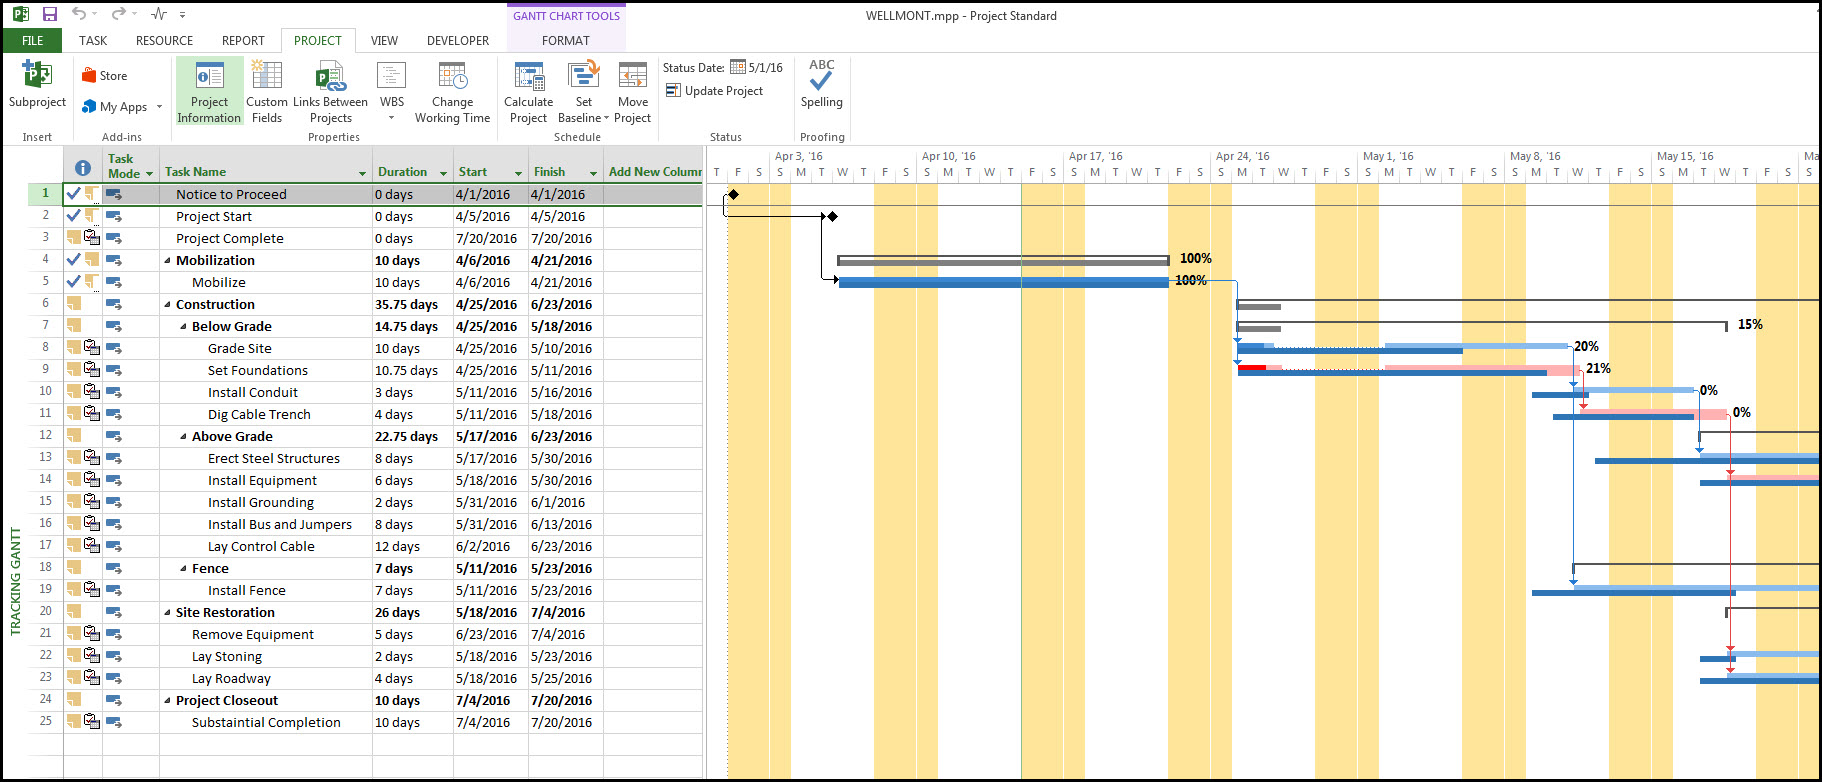
We proceed by progressing the schedule up to May 1st, 2016, Figure 6.
Figure 6
In Figure 7 we generate another baseline, same procedure in the set baseline dialog.
Figure 7

Continue by selecting the format tab, bar styles ribbon group, format drop down menu, and bar styles. Here in the bar styles dialog, Figure 8, we define a Gantt chart bar for our second baseline, baseline1.
Figure 8
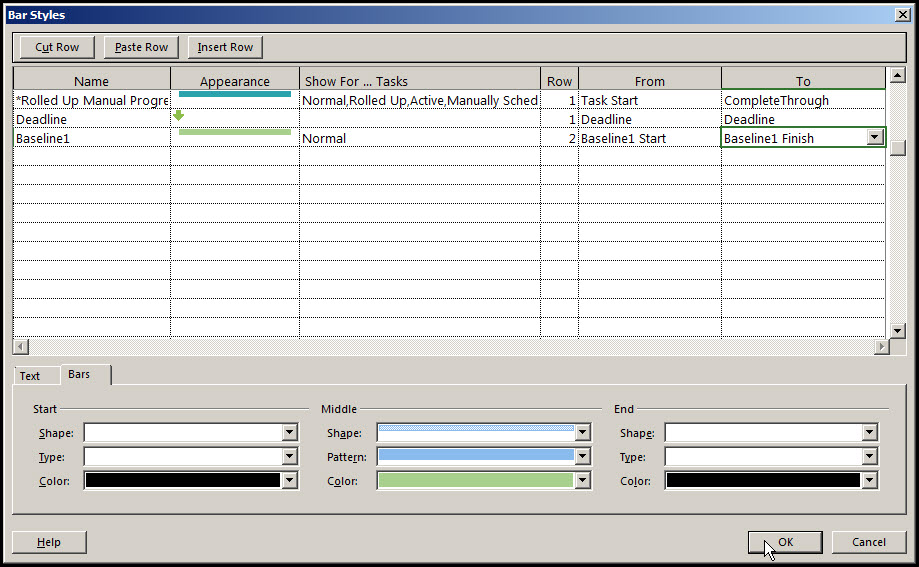
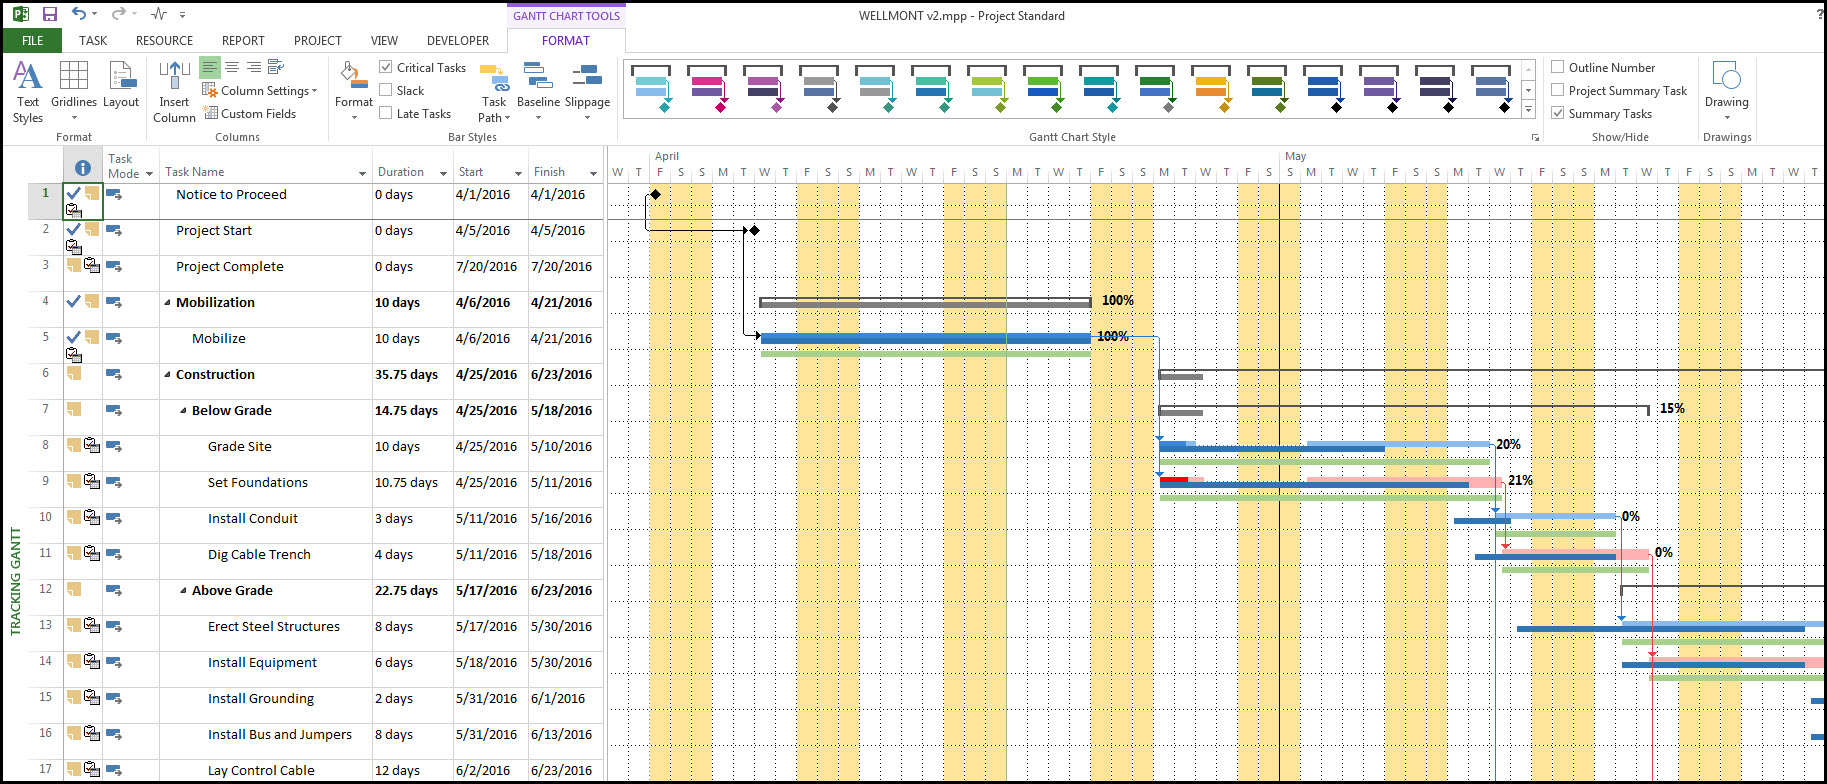
Choose an appropriate shape, pattern, and color for baseline1. Set the baseline1 bar to show for all normal tasks. It’s important to set the row to 2, so we do not overlay one baseline on top of another. The From and To are ‘baseline1 start’ and ‘baseline1 finish’, respectively. Select OK and we have our Gantt chart with two baselines in Figure 9.
Figure 9
Well, almost! It would be nice to show baseline milestones as well. In Figure 10, we create a milestone1 Gantt chart bar definition.
Figure 10
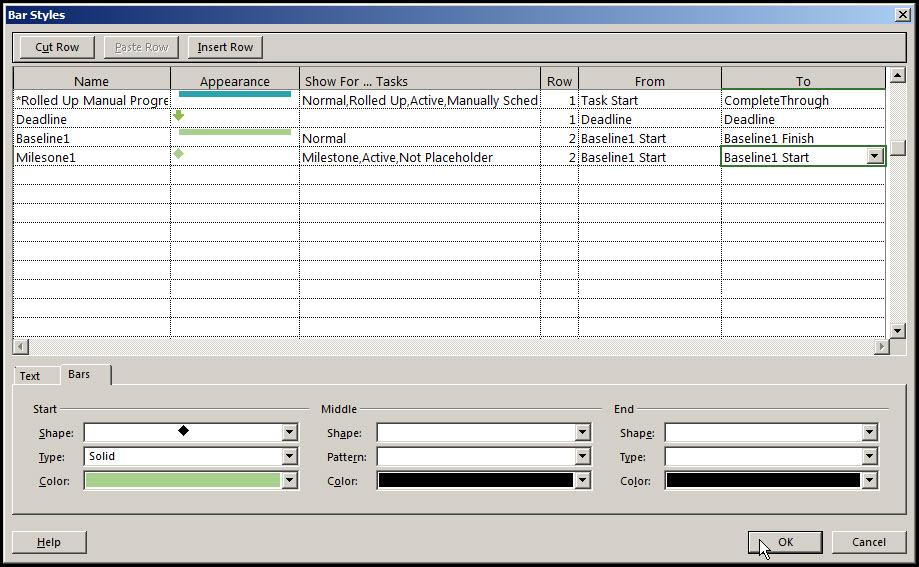
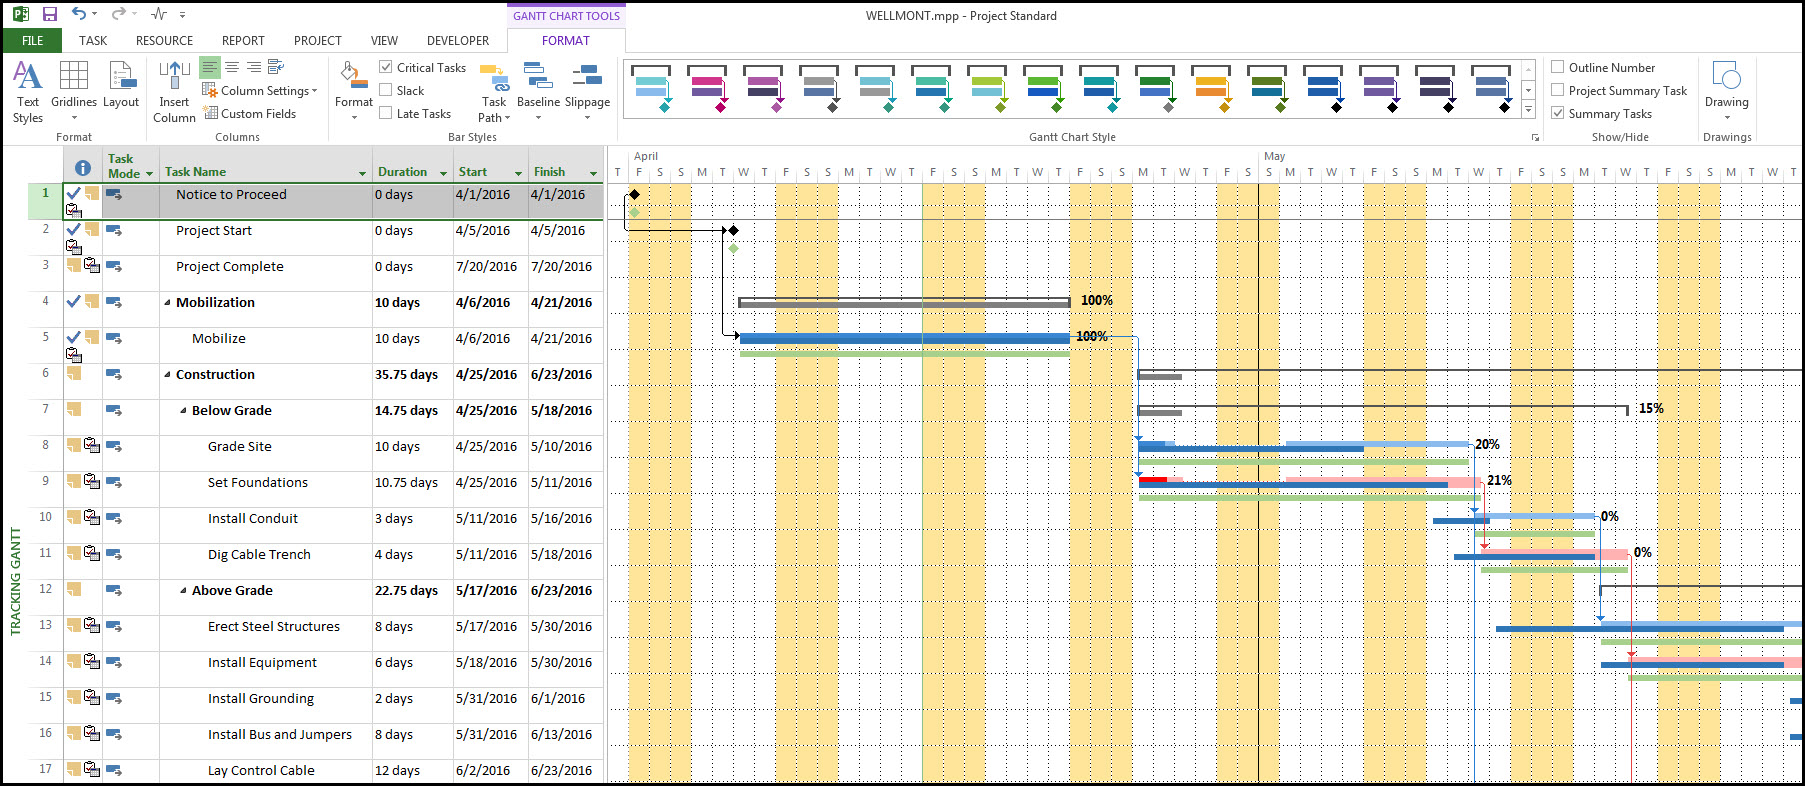
Select an appropriate start shape, type, and color. Show for milestone, active, and not placeholder tasks. Again, use row 2. The From and To are baseline1 start and baseline 1 start. The final schedule with two baselines, including milestones, is in Figure 11.
Figure 11
Summary
Change is inevitable and projects, in particular, are constantly changing. You will want to take plenty of snapshots of your schedule at different stages along the way to monitor and document your project’s evolution. Microsoft Project 2013 has the ability to display multiple baselines in support of maintaining schedule integrity, capturing scope changes, and/or forecasting.
Baselines in Microsoft Project may be defined on up to four rows on the Gantt chart. This allows you to keep one baseline since inception undisturbed and have plenty of other baselines available to keep your schedule current.
Remember! You will want to define baselines for both tasks and milestones to fully describe your Microsoft Project schedule’s situation.