Lag modifies activity relationships by adding waiting time between predecessor and successor activities in the precedence diagram. A cure time lag is unique because the waiting time is measured 24-7.
It is not uncommon to insert waiting time between predecessor and successor activity relationships in the precedence diagram. Lag is particularly helpful to narrate the installation of an underground pipe system. For example, to model this situation, a three-day lag is inserted between the start of ‘dig trench’ and the start of ‘lay pipe’. The ‘dig trench’ crew needs a head start to excavate enough trench to provide the ‘lay pipe’ crew sufficient leeway, i.e. room to work. The lag in this classic example works nicely to modify or adjust the start to start (SS) relationship between ‘dig trench’ and ‘lay pipe’, and stagger these two activities to provide both crews acceptable work space on the construction site.
So lag is a handy tool to support sequencing activities in your schedule. But the lag in this example is measured along standard business work week efforts. What if you needed to insert a waiting time lag to model the 24-7 curing of concrete? Yes, it is possible to define a 24-7 lag in Primavera P6..
This article demonstrates the insertion of a cure time lag using Primavera P6 EPPM Release 16.1 using the new (non-java) Standard View mode.
The curing of concrete or other materials is a process that occurs 24-7 “around the clock” on business days and weekends. Concrete installation is a common construction effort, so it makes sense that Primavera P6 EPPM Release 16.1 supports defining lag for the concrete curing process. A standard application is the installation of a concrete floor. The 24-7 lag models the time required for the concrete to cure (and floor to harden) before installation of wall framing on the concrete floor.
In Figure 1 we have our demonstration concrete installation construction project.
 Figure 1
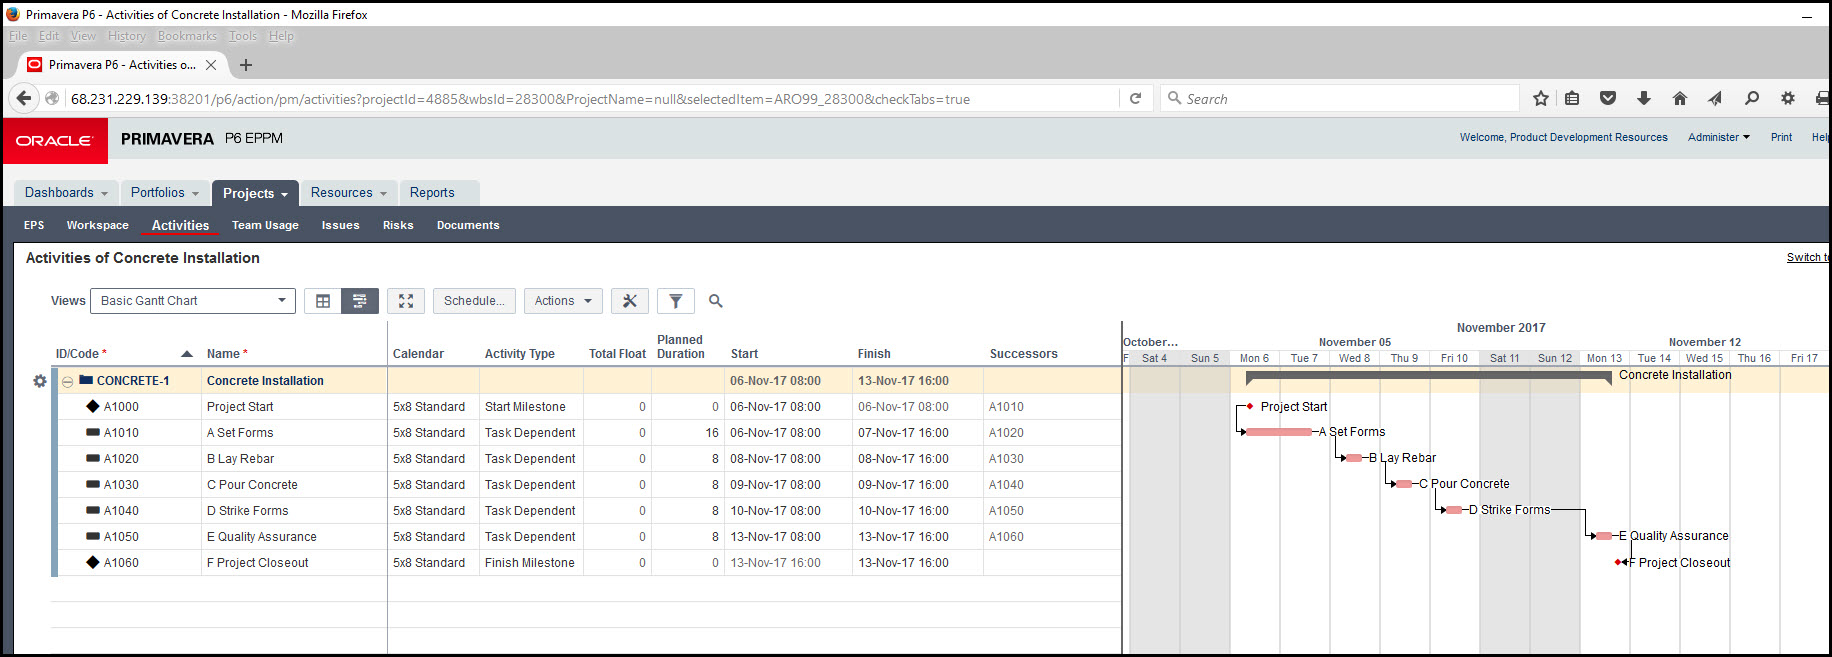
Note, in particular, the relationship between activity ‘c pour concrete’ and activity ‘d strike forms’. This is a finish to start (FS) relationship, which means the predecessor ‘c pour concrete’ must be completely finished before starting activity ‘d strike forms’. We, additionally, want to define a waiting time between these two activities to provide time for the concrete to cure before striking the forms, i.e. removing the concrete molding. If the strike forms activity occurs immediately after pour concrete the concrete will not hold the desired shape, and we will have nothing but a concrete mess.
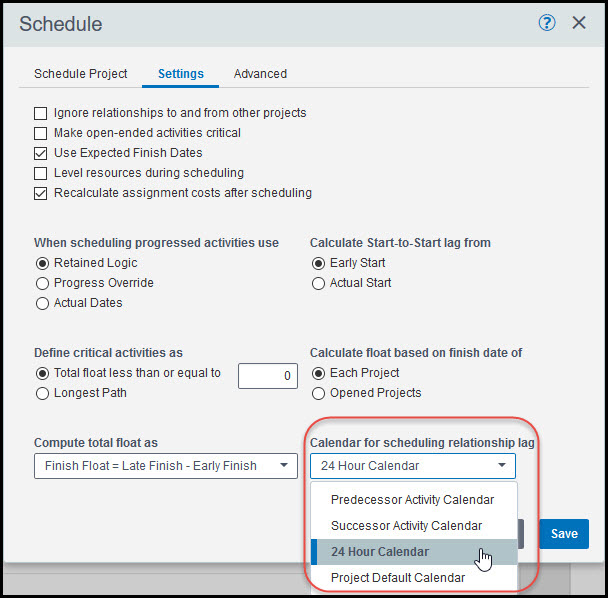
Currently the schedule does not account for the time required for the concrete to cure. We want to insert lag, but we also want it to be defined as a 24-7 lag to model the continuous nature of our concrete curing process. To schedule a 24-7 lag select the schedule button in projects-activities. In the schedule dialog click settings and select ’24 Hour Calendar’ from the ‘calendar for scheduling relationship lag’ drop down menu, Figure 2.
Figure 2
Great! Now P6 EPPM is ready to model 24-7 lag time. To insert the 24-7 lag highlight activity ‘c pour concrete’ and select relationships in the bottom details. In the successors frame of the relationships tab select activity ‘d strike forms’. Enter 120 in the lag field, Figure 3.
Figure 3
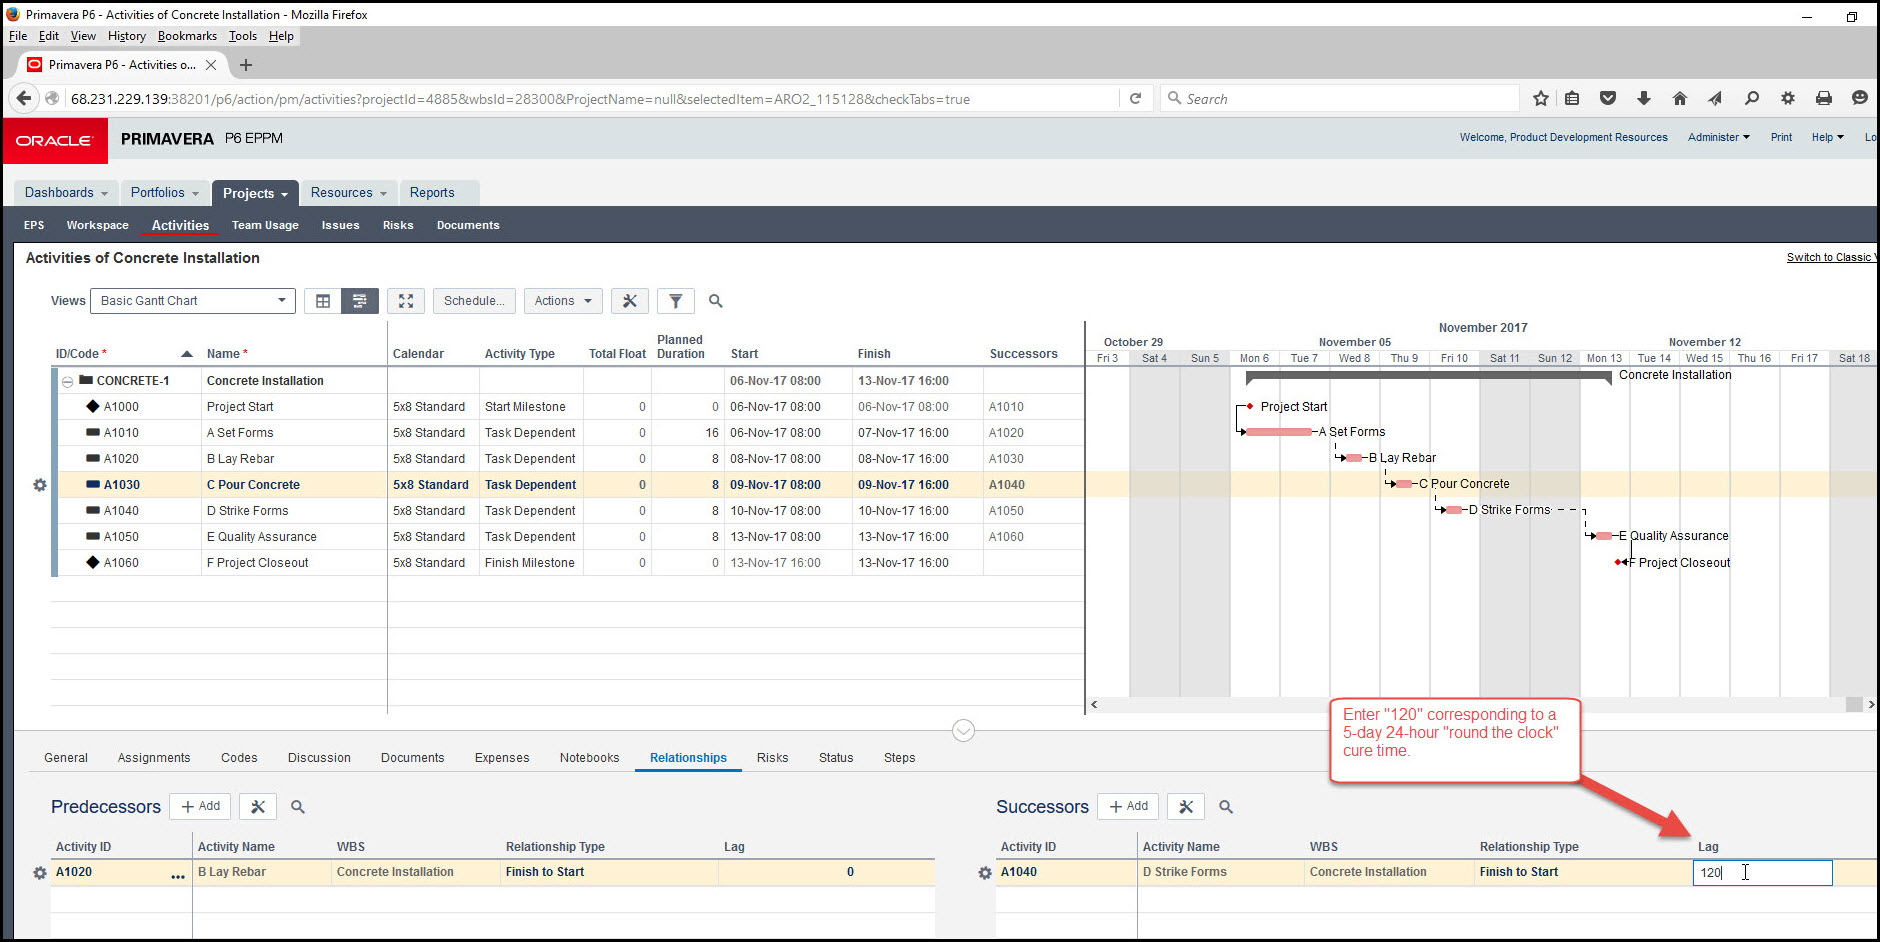
The 120 is in hours and equals a 24-hour a day 5-day cure time lag. Activate the lag by recalculating the schedule. In Figure 4, the separation between pour concrete and strike forms on the Gantt chart is 5-days, which includes weekend days.
Figure 4
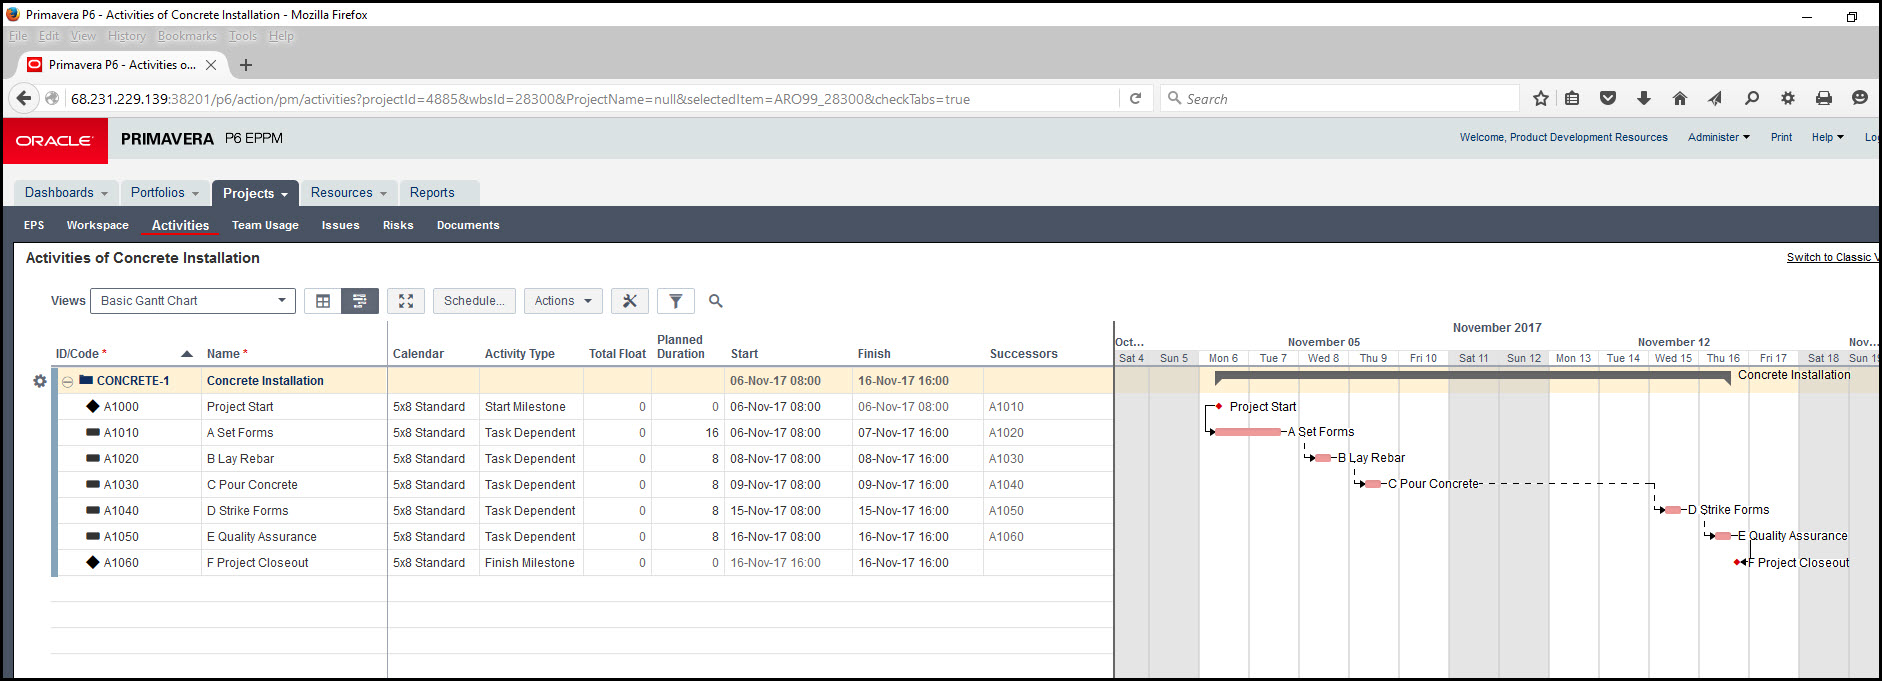
This is what we want; the Gantt chart looks correct.
Next we want to display this lag information in the activities table. For this select the customize view icon, Figure 5.
Figure 5
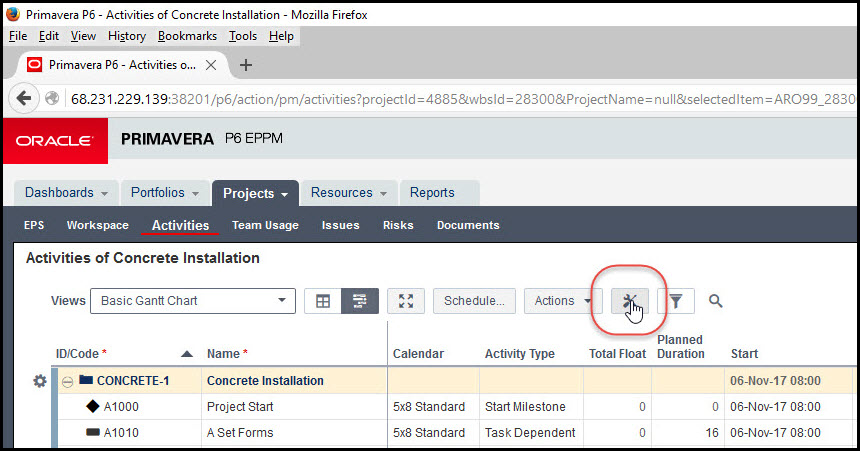
The customize view dialog, provides access to a number of customize features, including columns. Select columns in the customize view – basic Gantt chart dialog, Figure 6.
Figure 6
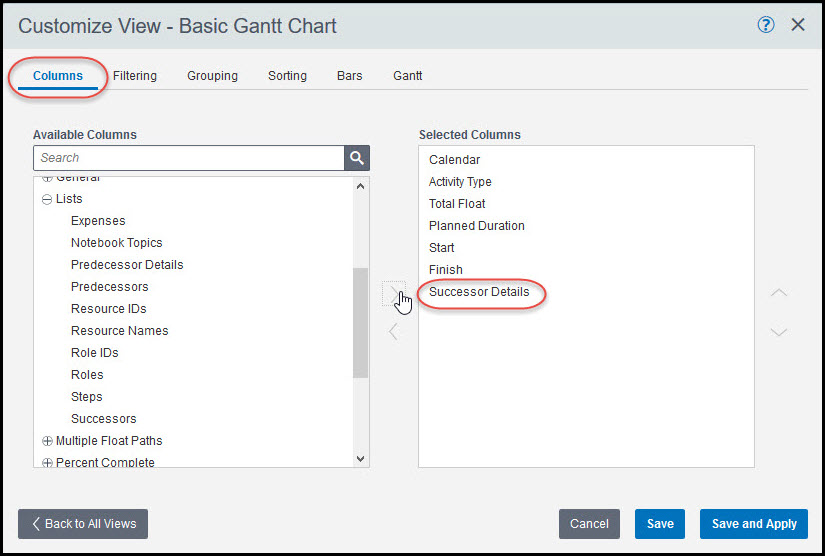
Replace the ‘successor’ option with the ‘successor details’ option, Figure 6. The ‘successor details’ lists not only the A1040 (d strike forms) successor to A1030 (c pour concrete) predecessor, but also the relationship, FS, and the lag, 120-hours, Figure 7.
Figure 7

We therefore have both the Gantt chart pictorial and activity table details list highlighting our concrete cure time lag.
Summary
Lag is a Primavera P6 EPPM tool that helps describe the true narrative of the project schedule. In the precedence diagram lag modifies the predecessor/successor relationship by adding waiting time between the two activities. In this way you may alter the relationship definition between tasks, accordingly. Default lag in EPPM P6 assumes the standard work week of the predecessor.
Material cure time, including concrete, is singular in its 24-7 continuous nature. As discussed, P6 EPPM provides a 24-hour lag setting in the schedule options to support 24-7 material cure processes. Note that this 24-hour schedule option sets all the lag in the schedule to 24-7. You cannot have both a 5-day workweek lag and a 24-7 everyday lag in your schedule; it is either one or the other. If your schedule requires both you may want to consider another approach to modeling your cure time.
In this alternative cure lag approach you would define your cure time as a separate activity, and assign it a 7-day workweek calendar. What is important in simulating concrete cure time in your schedule is to make the workweek 7-days. Each business day, however, does not necessarily need to be 24-hours, although the process you are modeling is in fact continuous. We, however, recommend you use the standard business day as your schedule’s other activities, such as 8-hours or 10-hours. Your cure time calendar will then most likely be, perhaps 8-7 (8-hour days 7-days a week) or 10-7 (10-hour days 7-days a week). Detailed instructions for this alternative cure lag approach using Primavera P6 Professional are in this article Primavera P6: A Simplified Procedure For Scheduling Cure Time.
This alternative cure time approach works well, except in situations when the cure time ends just prior to or over the weekend. Depending on your critical activity definition – let’s assume less than or equal to 0-hours – this situation may result in positive total float values greater than zero. These greater than zero total float activities, as per our critical activity definition, are knocked off the critical path.
The problem here and with this cure time approach then is that your critical path may become disjointed, i.e. discontinuous, when you recalculate the schedule. But setting the ‘define critical activities as’ schedule option to ‘longest path’ allows you to maintain one continuous critical longest path through the network. Thus, this alternative approach to modeling concrete cure will still support longest path optimization efforts.