 ScheduleReader (formerly known as PrimaveraReader) is a desktop software application that allows you to view projects exported from Oracle Primavera P6 in .xer, .xml or .xls file formats. The application converts data from these imported files and visually presents the project schedule.
ScheduleReader is useful in that project plans created in Primavera P6 can be shared with teams, stakeholders, etc. without prohibitive license costs. Before ScheduleReader, some organizations shared project plans in .pdf format. This is not the most efficient way to communicate activities and the latest project status. It can also introduce risk that negatively affects project performance and may increase the chance of failure.
Oracle offers tools that support dynamic project overviews, such as Primavera P6 EPPM and it’s supporting product, TeamMember. These can be used as an alternative to sharing .pdf files. But they come at a cost which is often too expensive for companies, especially with larger teams. Moreover, many companies just want to stick to using Primavera P6 Professional and not the web versions (Primavera P6 EPPM, TeamMember, etc.).
This is where third-party tools for managing projects come into play and one such tool is ScheduleReader.
Viewing Project Information
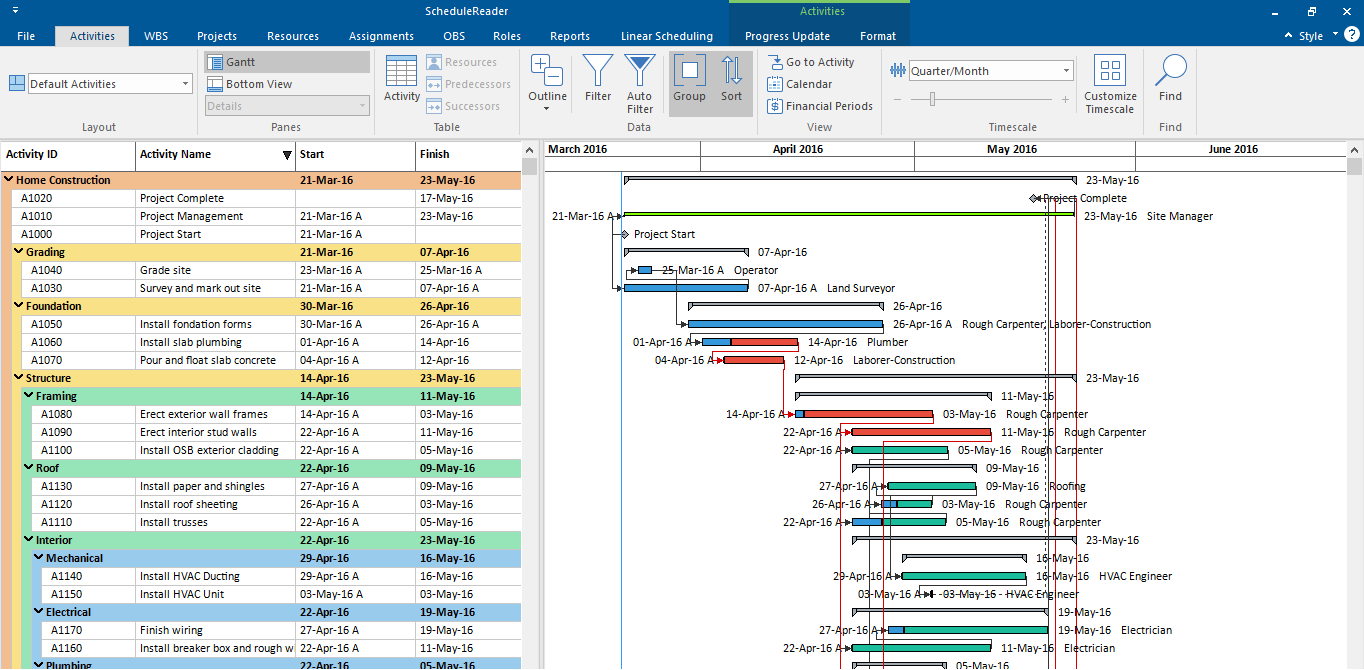
The first positive impression of ScheduleReader is its similarity with Primavera P6 in presenting the project schedule. You can view project information by navigating through the many project views such as Activities, WBS, Resources, Roles, Projects, OBS and Assignment, Reports, Linear Scheduling and other in order to find information about different project categories (activities, resources, roles, assignments, etc.).
All project information given in a particular table view and the corresponding Gantt chart view are based on the assigned Calendar. Depending on your needs, you can use one of the pre-defined layouts to quickly get the desired information. Alternatively you can create a custom layout, using the filtering and grouping functionalities to highlight specific project information.
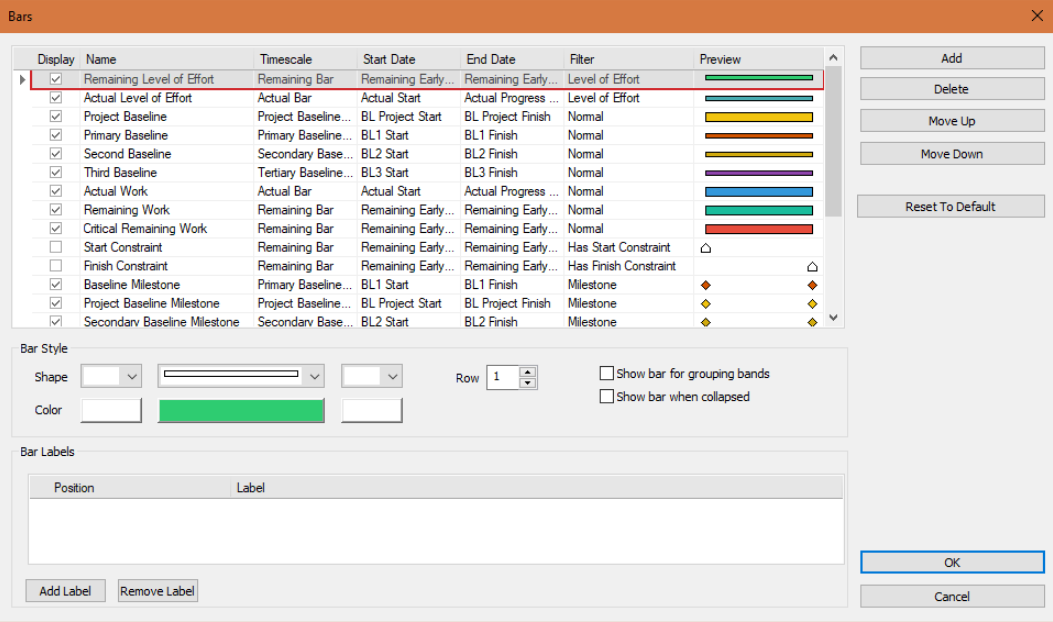
Customization of the Gantt Chart is also applicable. You can make changes to the bars, colors etc., thus allowing you to adjust the look and feel of your view.
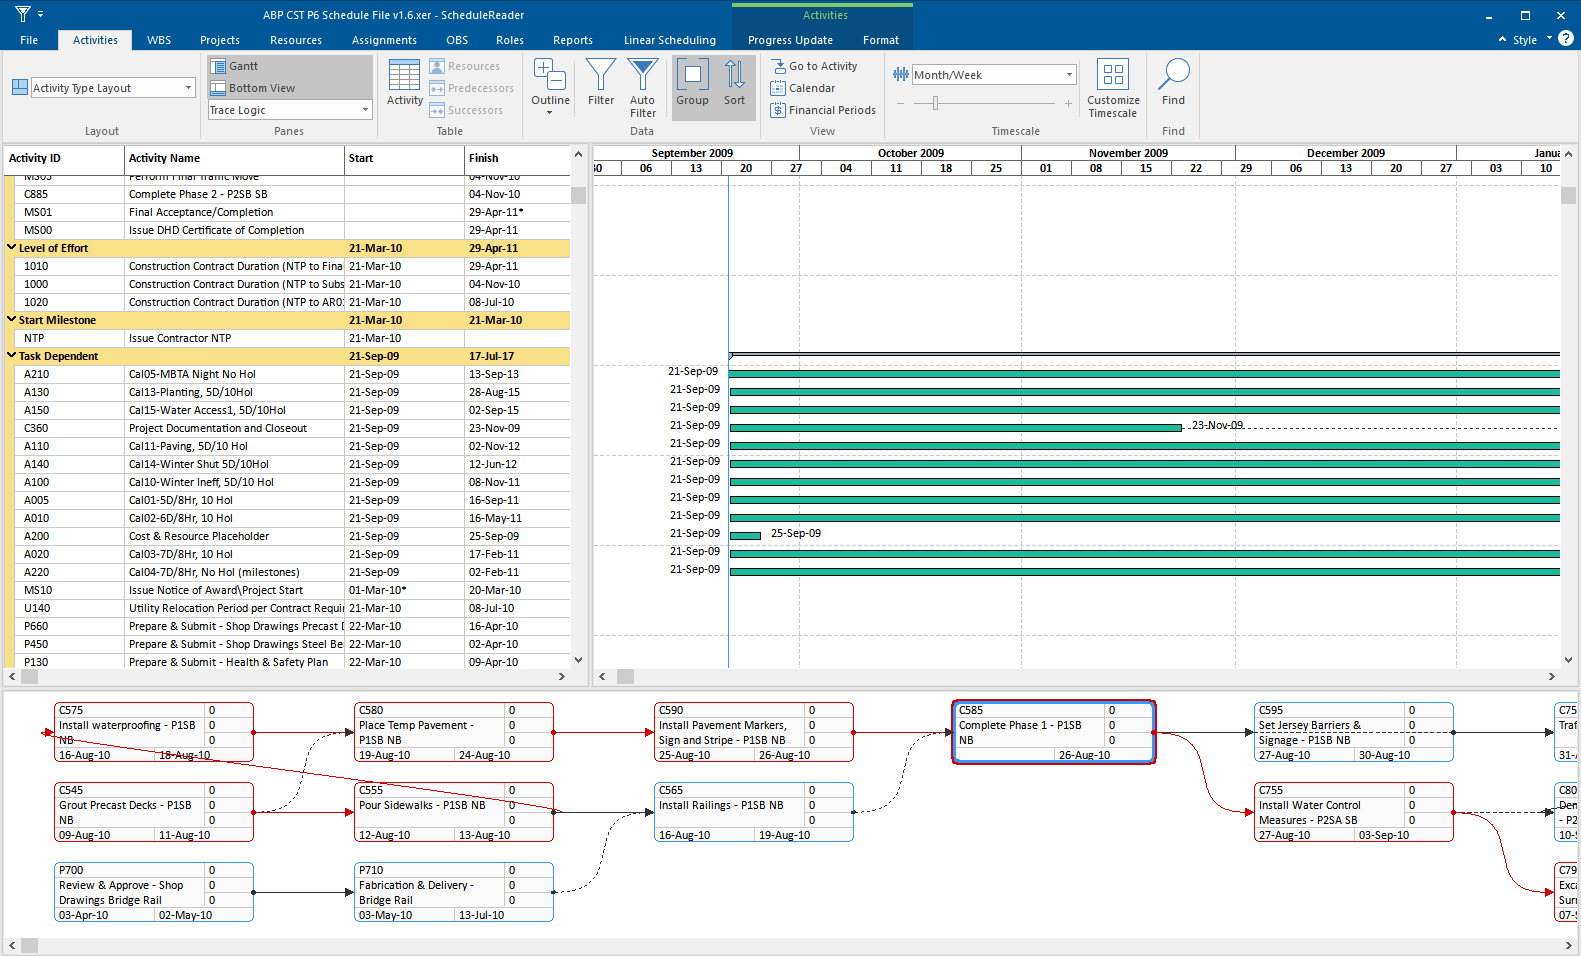
A really useful view that stands out is ‘Trace Logic’ which allows you to focus on predecessor/successor relationships through “tracing” forward and backward a sequence of activities.
This enables managers to closely examine why an activity is scheduled to occur at a particular time. They can then easily determine if one activity’s predecessors were delayed or if existing constraints are still applicable.
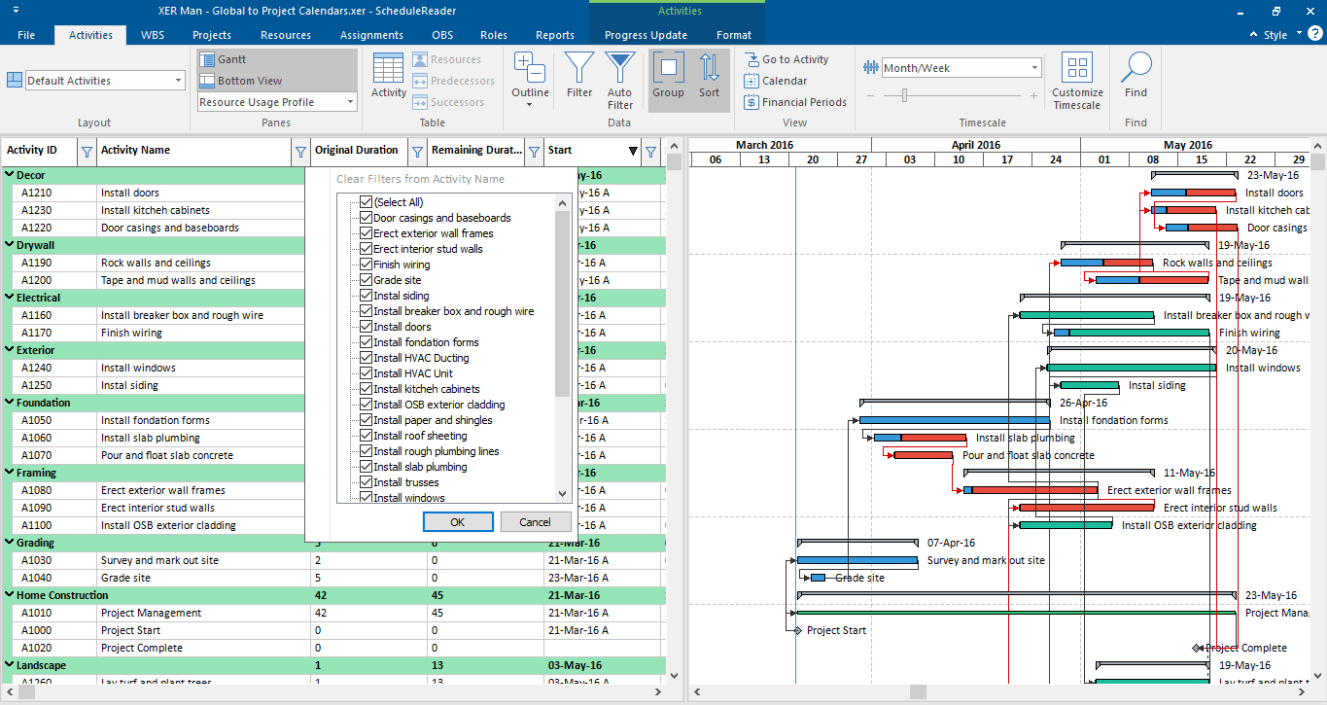
Grouping, Filtering And Auto-Filtering
A project plan is a set of interconnected activities with different constraints and parameters. You often need to view certain activities with specific characteristics such as ‘Completed’, ‘Not Started’, or to organize them according to the remaining or original duration, etc.
Groups and filters can help you in this process. You can arrange the activities’ order according to your current needs to determine future steps or to view specific activities that require attention. Customization of the groups is performed in a special dialog where users define the dataset and the criteria, according to which the project activities will be organized.
Group is saved in the layout, meaning that groups, along with the layouts, are saved on the application level. You can open any project file and through the same layout, the group will be applied. Filters, on the other hand, are very useful because with them you can get the required information in a fraction of second. Imagine you have a project with thousands of activities. The ‘Filters’ feature makes sure you can find everything you need very quickly and easily.
For example, with ScheduleReader you can create ‘User-defined Filters’, which will include or exclude activities in the view, based on the criteria that you have specified. Just as ’Groups’, ‘User-defined Filters’ are saved on the application level, and can be used in any project plan.
Also, if you want to filter data in columns based on the cell values, you can use the Auto Filter functionality. Click on the Auto Filter button in the ribbon, and you will see the filter icon in the column header.

Layouts
A layout consists of information about the arrangement of different table elements in the appropriate view: Activities, WBS, Projects, Resources and Assignments View.
The software has a couple of default built-in layouts such as “Groups by Finish Monthly”, “Activity Type”, “WBS Path” etc. Also, you can easily create a new layout by copying a default layout or copying an imported layout in the Manage Layouts view.
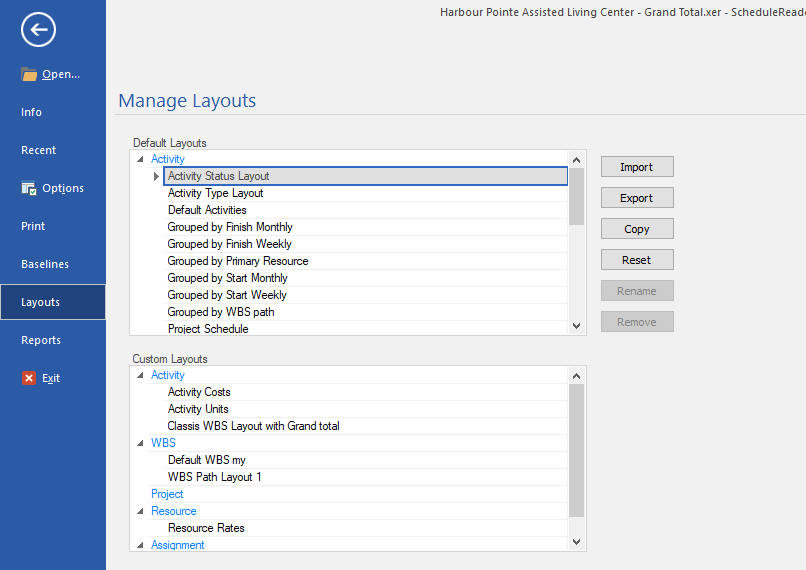
These custom-made layouts bring all the information on grouping, sorting and filtering of data and can be reused among the team members and stakeholders. By having the same layout distributed to all project stakeholders, everyone will be able to have the same view of the project plan.
Compare Several Different Versions Of The Project
With the ’Baselines’ functionality, you can compare up to four different versions of the project plan. This allows you to have a clear visual comparison of the activity’s updates from the previous version and helps you to keep track of the project’s progress.
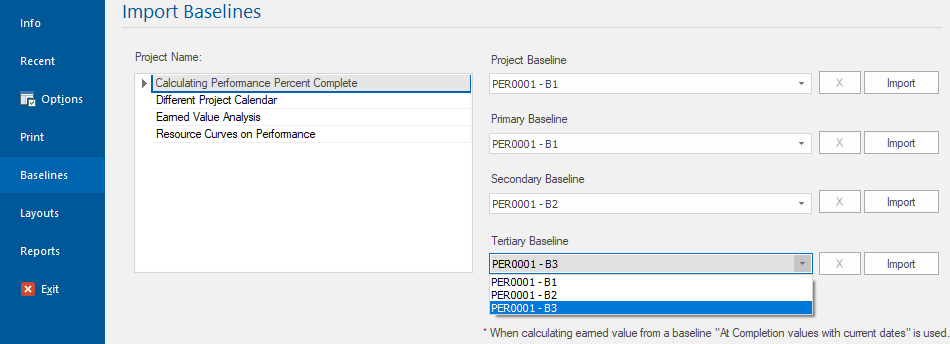
In Gantt Chart, you can see how Baselines are displayed just below the original activity bar, making it easy to compare the changes that have been made.
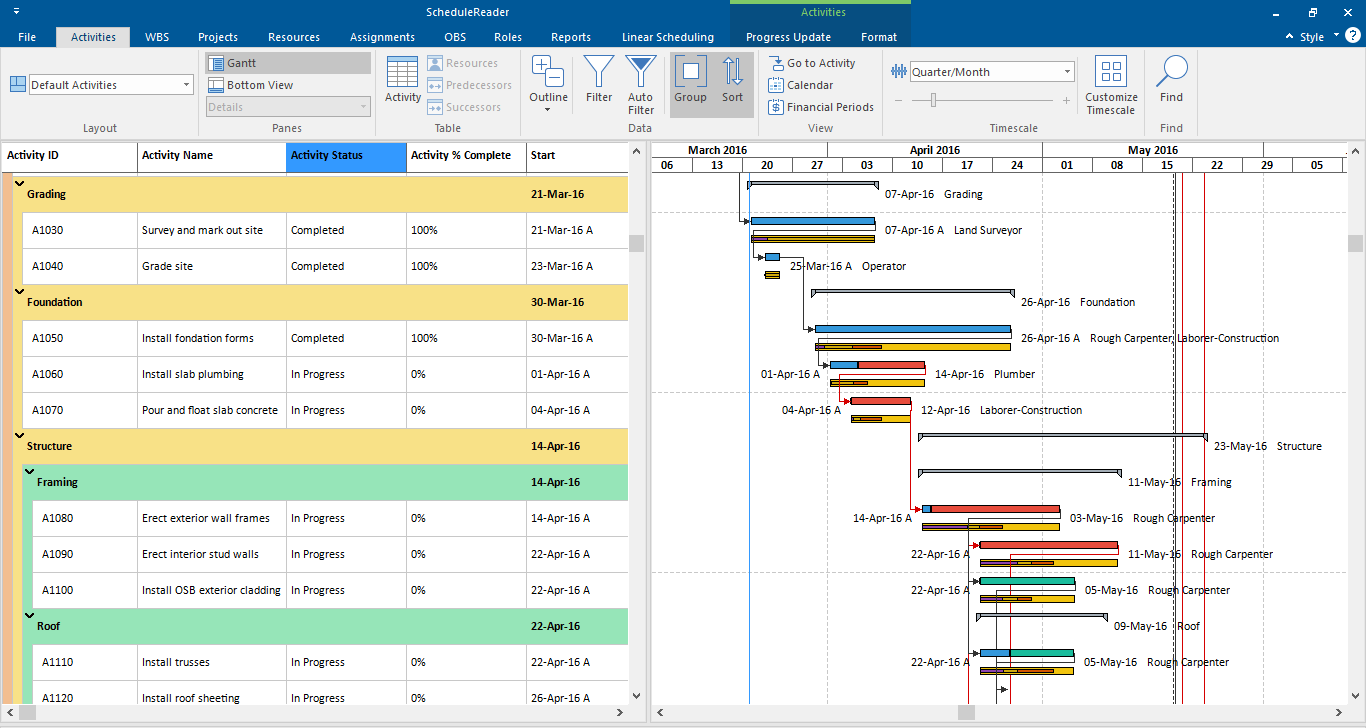
Progress Update
In a Primavera P6 project, different roles are working and collaborating on the same project. In order to have an updated project progress, all these roles can insert a status for their activities. Then, the Project manager can decide whether to accept or reject the updates from the members.
In ScheduleReader, users can insert a proposal for update in the following two views: ‘Activities’ and ‘Assignments’. They can update % Complete, Actual Start, Actual Finish, Activity Status, and Activity codes.
Graphical Reports
Communication is crucial for project success. The functionality ‘Graphical Reports’ enables you to create summaries of the complex data in a meaningful way. This is important when communicating project progress with stakeholders, sponsors and other parties involved in the project.
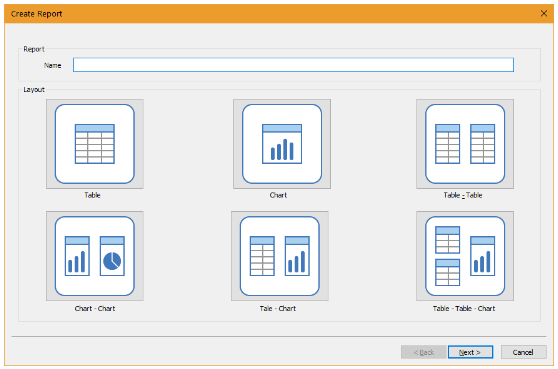
There are two types of reports available in ScheduleReader: ‘Predefined Reports’ and ‘User-defined Graphical Reports’. Additionally, there are two categories of predefined reports: ‘DCMA 14 Schedule Analysis’ and ‘Project Schedule Analysis Report’.
However, the predefined reports don’t satisfy our needs in terms of data representation for every situation in which we find ourselves. Therefore, ScheduleReader allows you to create your own reports with custom desired information.
 These ‘User-defined’ reports can be exported and then imported and used by other project participants.
As with Layouts, the reports are also saved on application level and can be easily accessed for future use with different XER files.
Time-Location Diagram
“Linear Scheduling” terminology is used in projects from the following industries: gas and oil pipelines, rails, bridges, tunnels, roads, high-rise buildings, transmission lines construction, etc. It allows users to see project elements in time-location diagram.
The software features a time-location chart for viewing complex projects such as the above mentioned, using the Linear Scheduling Method within an Oracle Primavera P6 environment.
What We Want To See
A mobile app would be nice to have. It should be simple, perhaps viewing basic project information and maybe allowing progress updates for assigned activities.
What Are The Benefits of ScheduleReader?
Instead of sharing project information in an old and outdated way such as through .pdf files, companies are turning to third-party solutions. This helps them facilitate the power of modern technology and provide a better understanding of the data within the project. In this manner, different roles in one organization could benefit from a solution such as ScheduleReader.
Many project managers who don’t have a Primavera P6 license, receive project plans in .pdf format. With ScheduleReader they can interact with and visually see the data in the Gantt chart, import custom layouts and filters in order to align with company’s environment, analyze relationships between successor and predecessors and track the project progress over time more efficiently.
Project schedulers who usually lose time on printing .pdf documents for each team can now simply send an updated version of the schedule in .xer or xml format.
Project controls with the critical path can easily make sure the project is on-time and on-budget, improve communication between teams and quickly overcome any unexpected issues.
Final Words
ScheduleReader is a really useful companion tool to Primavera P6. It could not only replace the old-fashioned way of sending and receiving projects in .pdf format, but also, save valuable time in making sure all project stakeholders are up to date with the project status.
Users can dynamically view project information and stay on the top of their activities and assignments. By updating progress status, they will send activity and assignment progress feedback to their responsible superiors. Everyone is on the same page which is vital for any project.
ScheduleReader is an incredibly useful tool and the graphical interface makes it very easy to use. This combined with the detailed documentation means that no additional training is needed.
This tool aims to streamline communication between all project participants by providing a more sophisticated way to view project data from XER, XML and XLS schedules.
ScheduleReader is available in two versions: Standard and PRO. The only difference is that the PRO version features the Graphical Reports, the Linear Scheduling view and costs a bit more. You can learn more about ScheduleReader on their web site here.