 What is Deltek Acumen Risk? And how can it support my project scheduling efforts?
Deltek Acumen Risk is a risk management software program that works in conjunction with the schedule quality assessment software program Acumen Fuse. Acumen Risk helps project team members bring realism into the project schedule. Acumen Risk supports the scheduler’s efforts to model, manage, and mitigate project risk.
Even the best planned and finely optimized projects (to achieve schedule and cost targets) can suffer from delays and cost overruns when confronted with real life. These realities can be inaccurate task duration/cost estimates or risk events, which can have a significant negative (or positive) effect on the schedule outcome.
Deltek Acumen Risk enables team members to define and assign both uncertainty and event risks to individual tasks, Work Breakdown Structure (WBS) elements (deliverables), and/or the entire project. In this way, team members find the most realistic outcome, and either the worst or best case. They can also investigate mitigation efforts to avoid or minimize the impact of threats.
Accurate Project Predications in Acumen
Project outcome is difficult to predict if your project is unique, so they are typically managed at the micro level. In this example, there is not a vast macro database of examples of this project that we can reference to gain more insight into the likely accuracy of the duration and cost projections.
There are at least two ways to make these project forecasts:
- Critical Path Method (CPM)
- Monte Carlo Analysis
The CPM is at the micro level, and the Monte Carlo Analysis is a way to simulate project runs and probable outcomes to approach (or achieve) a macro view of schedule outcomes.
Critical Path Method
The CPM takes activity duration estimates together with predecessor and successor relationships to build a critical path. The CPM is deterministic; it forecasts or predicts project completion on an exact date and budget at a precise dollar amount.
Statistically, however, it is unrealistic to think you will achieve that CPM deterministic date/cost, whose calculated completion date or budget comes from a single iteration (or datapoint). And it does not consider risk uncertainty and events.
It is better to account for uncertainty in duration and cost estimates and risk events, those known unknowns (things we know we do not know) and/or even unknown unknowns (unidentified risks; we don’t even know they exist and can broadside our project with significant serious unexpected impacts.)
Monte Carlo Analysis
The Monte Carlo Analysis tool in Deltek Acumen Risk works to provide a macro level risk assessment. Acumen uses a Monte Carlo simulation to effectively ‘run’ the project thousands of times (before the project even begins), calculating differing outcomes.
Acumen’s Monte Carlo method uses a random number generator for values between defined ranges. The analysis runs for thousands (or more) of iterations taking random probability and impact numbers within defined ranges to compute (for each iteration) duration/cost of tasks assigned to the respective risks.
Defining Project Risk in Acumen
Project risk is a fact. As mentioned, projects are unique, and, therefore, inherently a risky proposition. Acumen provides two main methods of inputting risk against project activities to model duration/cost risks:
- Estimate uncertainty risk
- Risk events
Duration/Cost Estimate Uncertainty Risk
If a schedule has no known risk events, it still has duration/cost uncertainty that should be considered. In single point deterministic schedule models (CPM), it is assumed that the duration/cost is known with certainty.
The reality is that the specified durations/costs are uncertain estimates. It is therefore best to model activity duration/cost using a probability distribution. A beta shaped distribution would be accurate but is difficult to achieve, Figure 1.
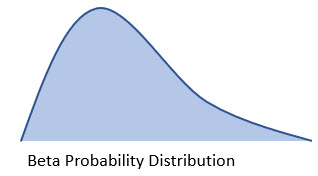 Figure 1
A more efficient method is the triangular probability distribution from a three-point estimate, Figure 2.
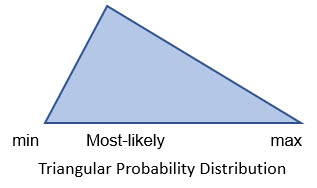 Figure 2
A triangular probability distribution specifies the optimistic, most-likely, and pessimistic duration/cost estimate for each individual schedule task, again, Figure 2.
A three-point distribution, however, can quickly become an unwieldy and cumbersome data entry effort on large projects. So, Acumen has a way to make the process more efficient. To simplify the schedulers work they only need to input two pieces of information for each task:
- A respective task’s duration/cost estimate
- Their confidence in this estimate’s accuracy, e.g., conservative, realistic, or aggressive
Acumen assigns the estimator’s task duration/cost estimate as the most-likely value in the triangular probability distribution. Further, Acumen has an uncertainty factor editor where confidence levels and corresponding min, most-likely, and max percentages are defined; one hundred percent is defined as the most-likely, Figure 3.
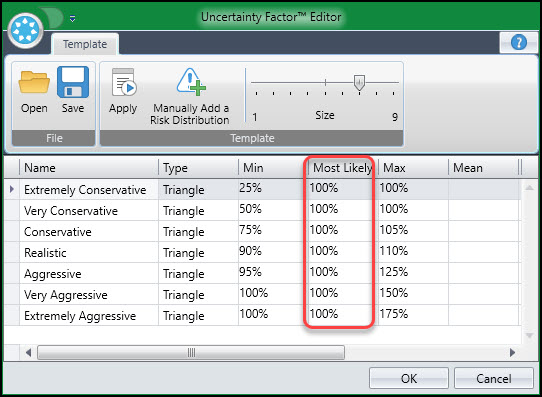 Figure 3
Acumen also has a handy slider system, Figure 4, where the individual tasks, WBS elements (deliverables), or project are assigned triangular probability distribution percentages or confidence levels.
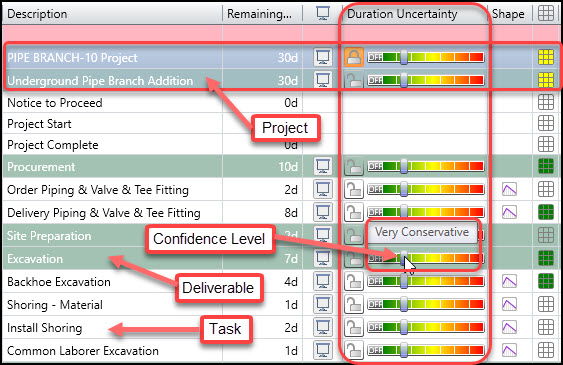 Figure 4
These percentages are based on where the scheduler or team member considers the task estimate to be in the defined confidence level range, e.g., extremely conservative to extremely aggressive.
Above in the Figure 4 schedule risk model, we have a duration uncertainty slider currently set to define estimates as ‘very conservative’ for the entire project.
Duration/Cost Risk Events
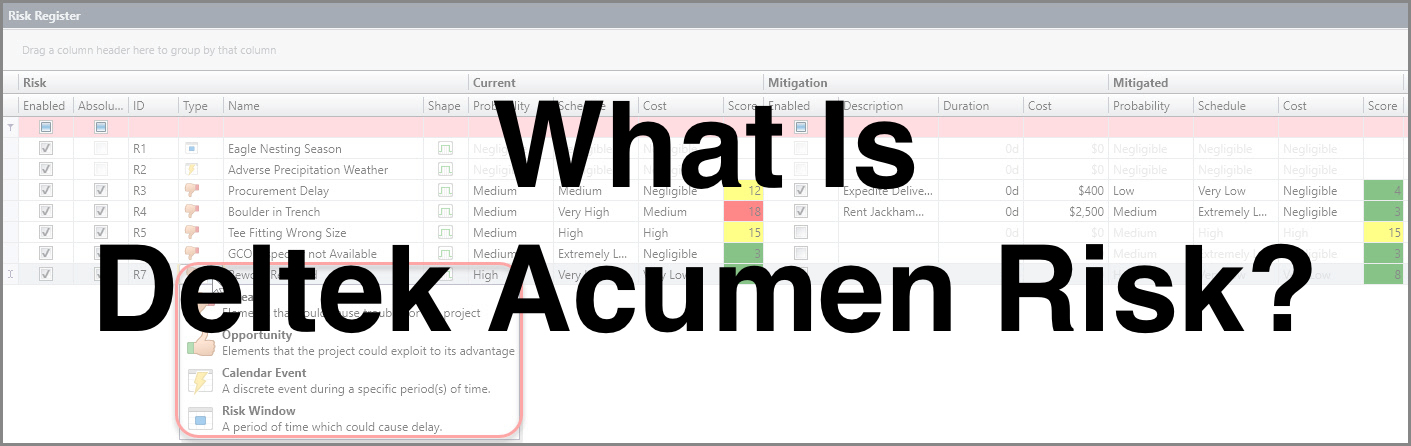
Not only do projects come with duration/cost uncertainty, but risk events are a major contributor to schedule unknowns. Acumen Risk supports the project team’s tabulation of these threats and opportunities in a risk register, Figure 5.
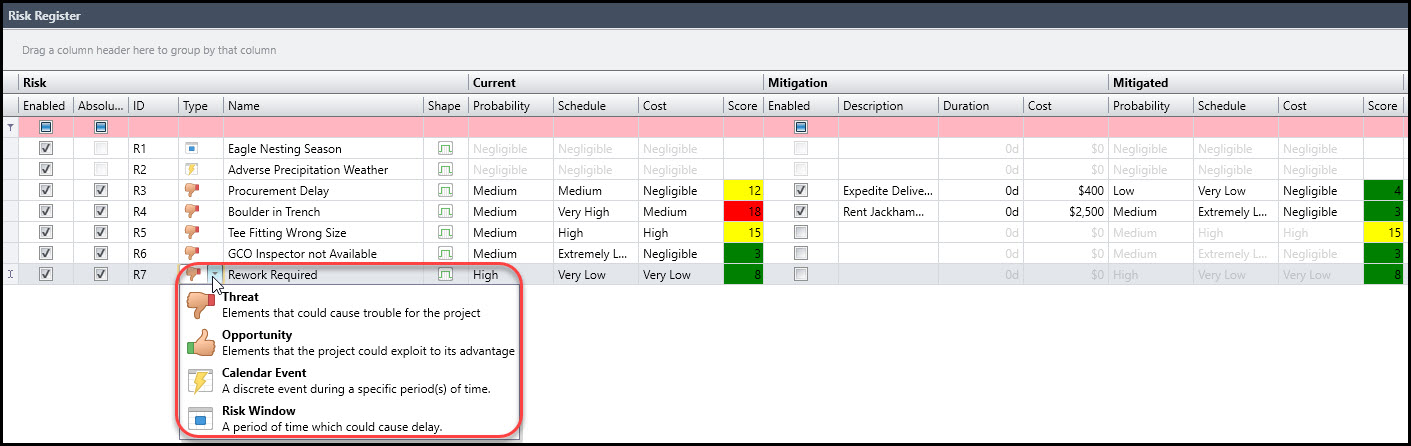 Figure 5
In addition to threats (and fortuitous happenings) Acumen Risk includes, Figure 5, calendar events for modeling foul weather like hurricanes, and risk windows, which can define periods of probable work suspension. These work suspensions can be outside the project teams’ control, such as suspension of outside construction when work is near and during eagle nesting season. Team members assign each risk event in the risk register the probability of occurrence and impact on duration/cost when they do happen.
The ideal is a comprehensive risk register, which can come from completed projects and/or project team collaborative discussion. Historical projects help formulate risks. And team brainstorming sessions are key to a well-planned risk register. Do not neglect to consider risk opportunities.
Yes, good things can happen to benefit your project. But do not overdo the risk register. It is best to exclude those risk events that are not very probable and where there is nothing you can do about them.
An example is an airplane crashing into your manufacturing facility. This would have a huge impact on your project, but it is not likely, and in most cases, there is little you can do to prepare for this airplane crash event. Limit your consideration to the most sensibly foreseeable and prominent events.
Acumen Histogram and S-Curve Plots
Acumen Risk analysis generates a histogram of a specified number of iterations; it plots the frequency of date occurrences (or cost instances for budget schedule models). See the example histogram plot in Figure 6, which is a date incident frequency histogram for a schedule (duration) risk model.
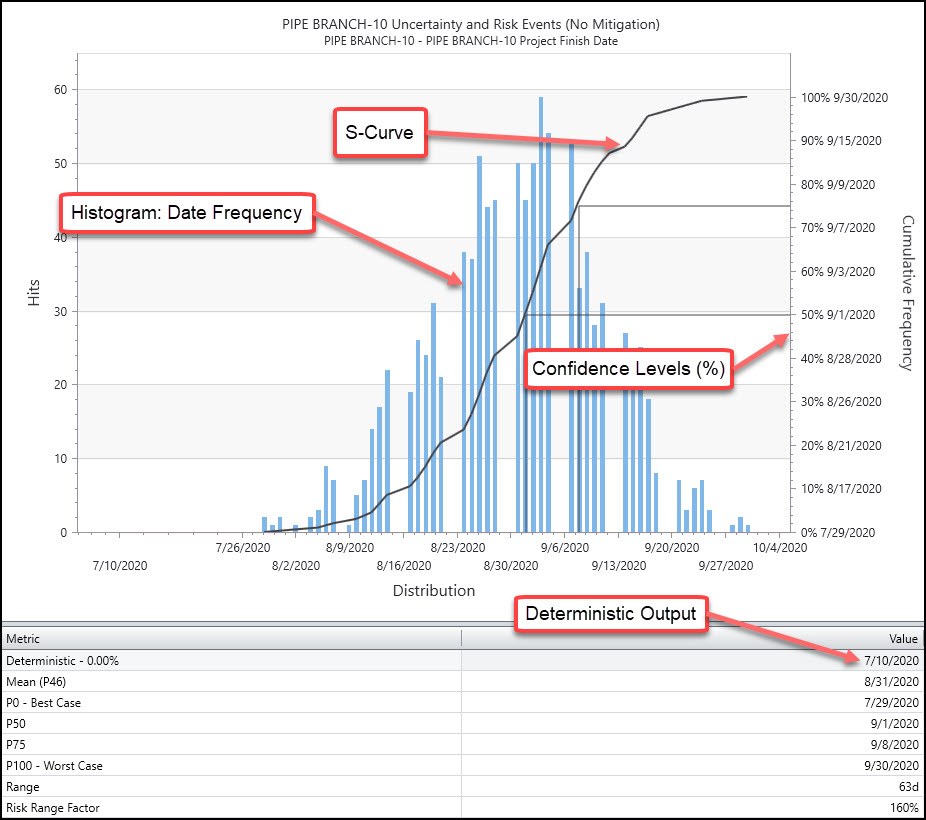 Figure 6
Acumen Risk further plots the cumulative frequency of occurring dates (or costs) known as an S-curve, Figure 6. It is from the S-curve that you can correlate a specific date with a confidence level %, such as a date that you have 80 percent confidence in achieving.
Acumen also provides the deterministic duration (or cost) predictions for reference. In this way the scheduler develops confidence levels and ranges into which we know we are going to fall and compare these to the deterministic forecast, displayed in the bottom tabulated output of Figure 6.
You also may compare several risk exposure S-curves, and display the variance between these curves, Figure 7.
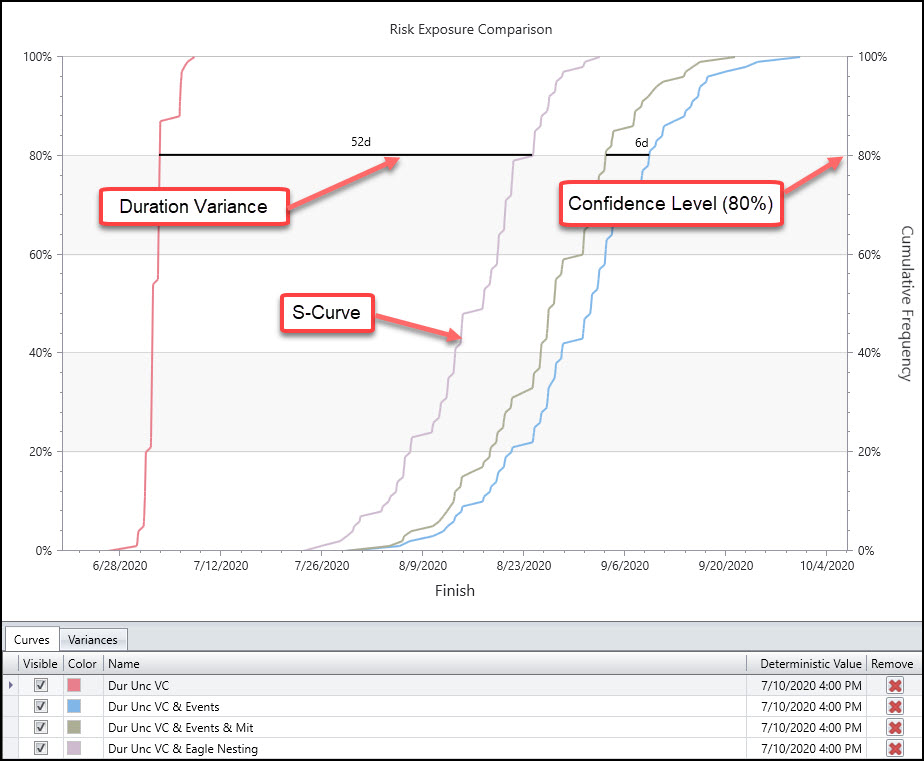 Figure 7
In Figure 7 above we find at an 80% confidence level that the Eagle Nesting risk event when realized delays the project by 52 days. Our mitigation efforts (expedite delivery and rent a jack hammer from Figure 4 risk register) can save 6-days on a project that is about three months long. This workweek span is a material savings, so the mitigation efforts look favorable.
Acumen Fuse and Risk Platform
A quality schedule is imperative for accurate schedule risk analysis (SRA). Poor data input always produces inaccurate output. An accurate SRA is most dependent on the input schedule’s quality. Acumen Fuse analyzes schedule quality while Acumen Risk performs risk analysis.
The two Acumen modules function together in the single Acumen platform. (Note that you must already own Acumen Fuse for Acumen Risk to function properly.) Not only can you examine the health, i.e., quality, of your schedule in Acumen, you also can perform the actual risk analysis directly in Acumen. Figure 8 displays a schedule quality metric group analysis of a project in Acumen Fuse.
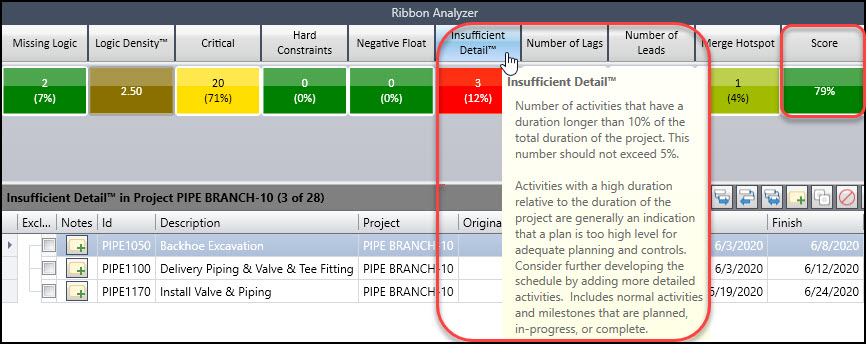 Figure 8
These are all the metrics Acumen developers in their wisdom consider the most pertinent (or vital) to a healthy schedule. The above example schedule quality analysis indicates a whole project life passing 79% metric group score, but a failing 12% score for the individual insufficient detail metric. The insufficient detail metric flags tasks that are more than 10% the duration of the project, Figure 8 and note.
The insufficient detail metric is a measure of the project schedule’s transparency to stakeholders. In Figure 8 example the bottom activity browser lists three long duration tasks in the schedule lacking sufficient transparency.
Although not displayed Acumen Fuse comes with the Defense Contract Management Agency’s (DCMA) 14-Point Assessment metric group, which is an industry standard for appraisal of schedule health. Together the Schedule Quality metric group and the DCMA 14-Point are considered the schedule health gate keepers. They provide a good overall inspection of quality to begin your schedule wellbeing checkup.
Acumen Risk Advice for Novices
If you are new to Deltek Acumen Risk, we recommend you begin your risk analysis by considering uncertainty and only the most prominent risk events. As your ability to confirm reasonable risk outputs (with rationality checks) increases, along with your confidence in Acumen’s risk computations, you can then expand your event register to more comprehensively model risk in your project schedule.
Further, when investigating variables on your schedule outcome make sure you only change one variable at a time. Otherwise, confirming that the outcome makes sense becomes a more difficult proposition.
Bracket the worst- and best-case outcomes For each threat risk event. First find the worst by running the risk analysis for uncertainty and risk events and (no mitigation) with the risk event enabled. Second disable the risk event and run the same analysis again.
The outcome is the maximum in days/cost you can feasibly benefit by mitigating/eliminating this risk event. Finally enable the risk event and, if possible, mitigate then run the risk analysis for uncertainty and risk events (mitigated). The mitigated threat outcome is your most plausible and should fall between the bracketed worst and best cases. In this way you provide some confirmation that your prediction is within reason.
Summary
Deltek Acumen Risk software features the Monte Carlo analysis to provide the project team with a macro level assessment of the respective project’s risk profile. Acumen Risk has tools to include, administer, and lessen (or leverage opportune) project risk in the schedule.
Its use of a triangular probability distribution and confidence slider makes for an efficient yet accurate means to account for estimate uncertainty. The risk register supports the definition, assignment, assessment, and mitigation of risk events.
The risk output is a histogram of date/cost occurrences and a cumulative frequency plot referred to as an S-curve. In this way Acumen Risk provides more insight than a deterministic result; it generates confidence levels alongside the date/budget results.
Acumen is truly robust; it includes a Fuse module to examine schedule quality and the Risk module to manage and assess project risk. Project teams can both confirm schedule quality and assess project risk in Acumen.
Efficient uncertainty modeling is possible when estimators provide their most likely duration/cost and their confidence in the accuracy of this value. These inputs generate the uncertainty triangular probability distribution.
The risk register can leverage historical projects and foster collaborative brainstorming in consideration of all event risks, both threats and opportunities. Investigate risk scenarios. Bracket the worst- and best-case outcomes for each threat. Then mitigate, if possible, the worst case to find the most probable outcome and inspect its soundness, as required.
In conclusion, Deltek Acumen Risk is a robust and efficient schedule health and risk management software program that makes for a more accurate, mature and practically built project schedule.
You may also find our free eBook ‘An Introduction To The DCMA 14-Point Assessment‘ relevant to this discussion.