 Half Step Delay Analysis Explained
Suppose you’re in a job role where you’re receiving monthly schedule updates, and it’s your job to report the specific reasons why the finish date slipped in that month. You have to account for delays that happened in the same timeframe, the impact of revisions to the schedule, and changes made to mitigate any delays.
Where do you start?
Delay Analysis is a set of methodologies that help you understand the exact causes of schedule delays. There are several methods for conducting a delay analysis, and one method that has risen in popularity is the half-step analysis. The half-step methodology is explained in MIP (section) 3.4 of AACE’s Recommended Practice 29R-03, Forensic Schedule Analysis. The methodology compares two schedule updates to explain precisely why the finish date or key milestones were impacted.
To conduct a half-step delay analysis manually, you would:
- Compare two schedule updates (Schedule A and B) and separate the list of changes into two groups: progress-related and revisions (everything unrelated to progress).
- Apply only the progress-related changes to Schedule A and recalculate the critical path using Schedule B’s data date to create an intermediate or half-step schedule (Schedule A½).
- By comparing Schedule A to Schedule A½, you can study the variances related to pure progress and determine how much they impacted the finish date. By comparing Schedule A½ to Schedule B, you can examine the variances related to schedule revisions and assess their impact.
Two significant barriers are preventing more widespread use of this analysis. First, the order in which you apply the progress changes could mask simultaneous changes (e.g., concurrent delays), leading to an incorrect analysis. To find concurrent delays, 29R-03 MIP 3.4 suggests using the Daily Progress Method, where progress is tracked by planning units (e.g., days) to account for that issue. Analysts “walk through” the comparison period day by day, applying all of the (fractional) changes that occurred that day and recalculating the finish date to assess the impact of each change.
Applying daily changes leads us to the second barrier: a half-step analysis is incredibly time-consuming (and expensive) when appropriately conducted to account for concurrent delays.
Several applications provide sophisticated schedule comparison tools to help get you started with a delay analysis. Still, the bulk of the work (applying daily changes, recalculating the critical path, and assigning blame) is difficult and time-consuming.
Steelray Software claims to have addressed both barriers with a software product called Steelray Delay Analyzer. Delay Analyzer automates the half-step analysis for Primavera P6 XER files, conducting it entirely in software.
Delay Analyzer supports the import of Primavera P6 .xer files. In Figure 1, we are importing a single .xer containing a baseline and 29 monthly updates. The second column is the data date, and we can see that the updates are one month apart and span two and half years.
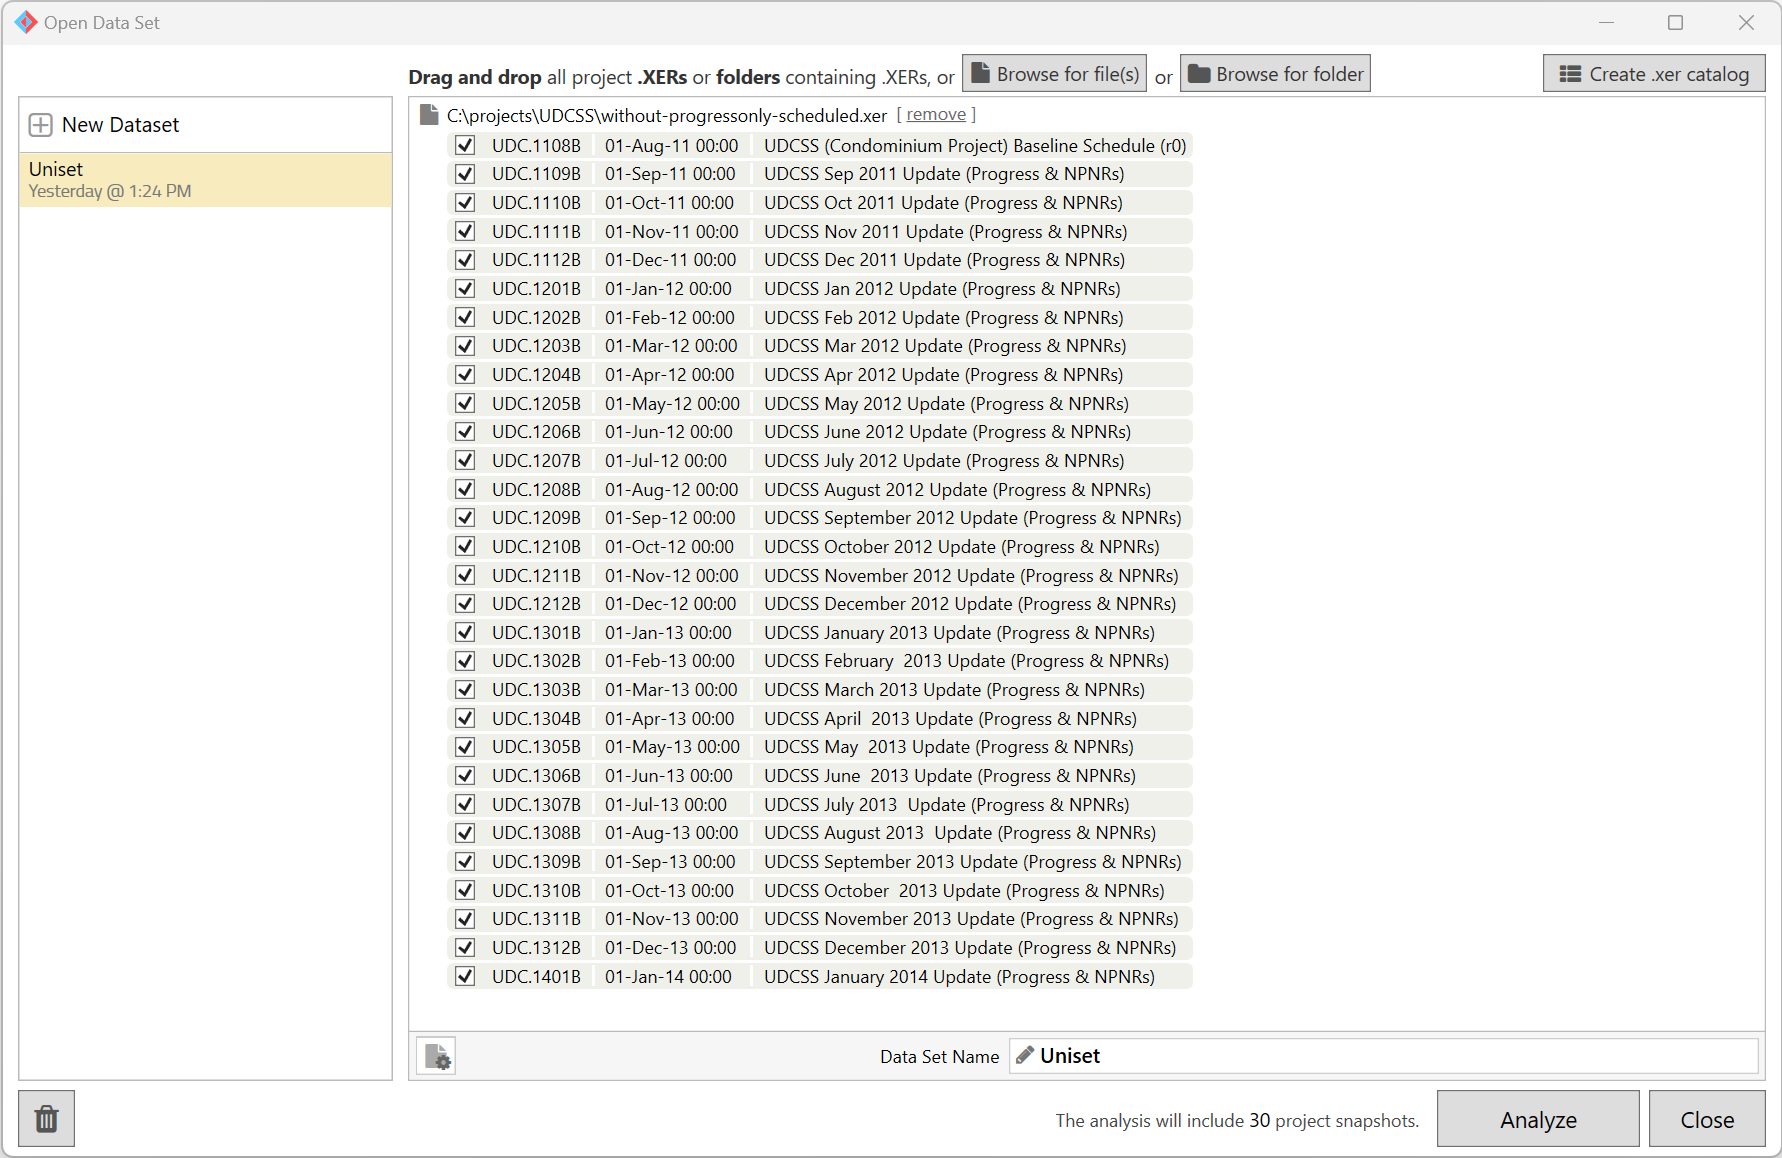 Figure 1
Within a few seconds after clicking the Analyze button, the analysis was complete, and Delay Analyzer displayed the overview chart shown in Figure 2.
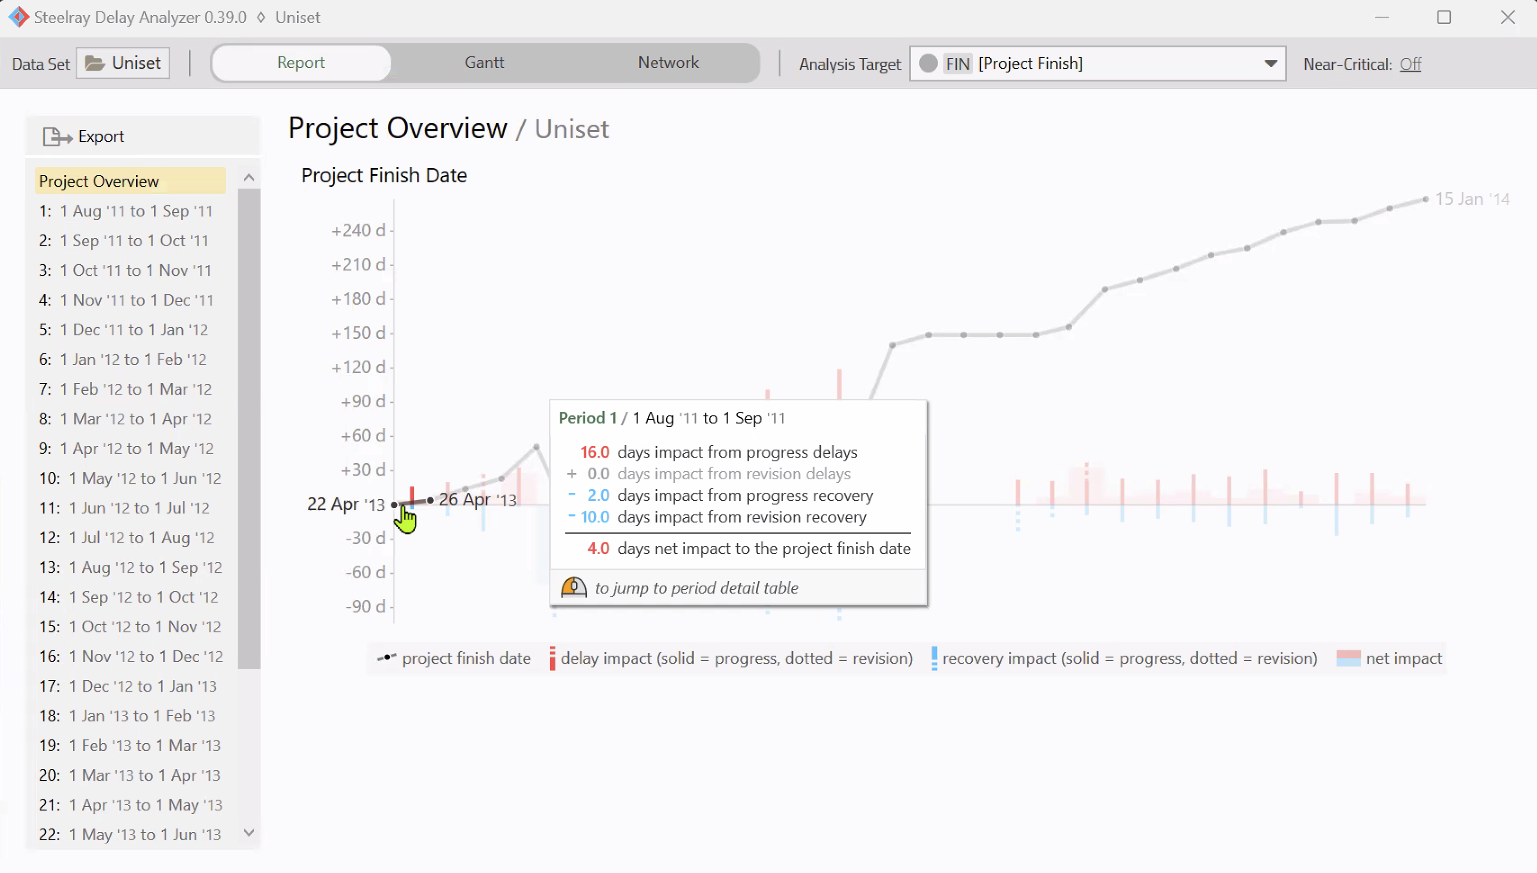 Figure 2
In the chart:
- The black line represents the project finish date over the two and a half years.
- Each column is a comparison period defined by the data dates of each project. For example, the earliest two data dates in the project set were 1-Aug-2011 and 1-Sep-2011, so those two schedules defined the first comparison period and are summarized in the first column in the graph.
- The popup summarizes each delay analysis by breaking down the impact on the finish date.
Dive deeper into a single period by clicking on a column, and Delay Analyzer shows the delay analysis results for that period (see Figure 3). You can see which activities impacted the finish date and the number of days each activity contributed to the delay. If there were concurrent delays, they are quantified in the Shared column.
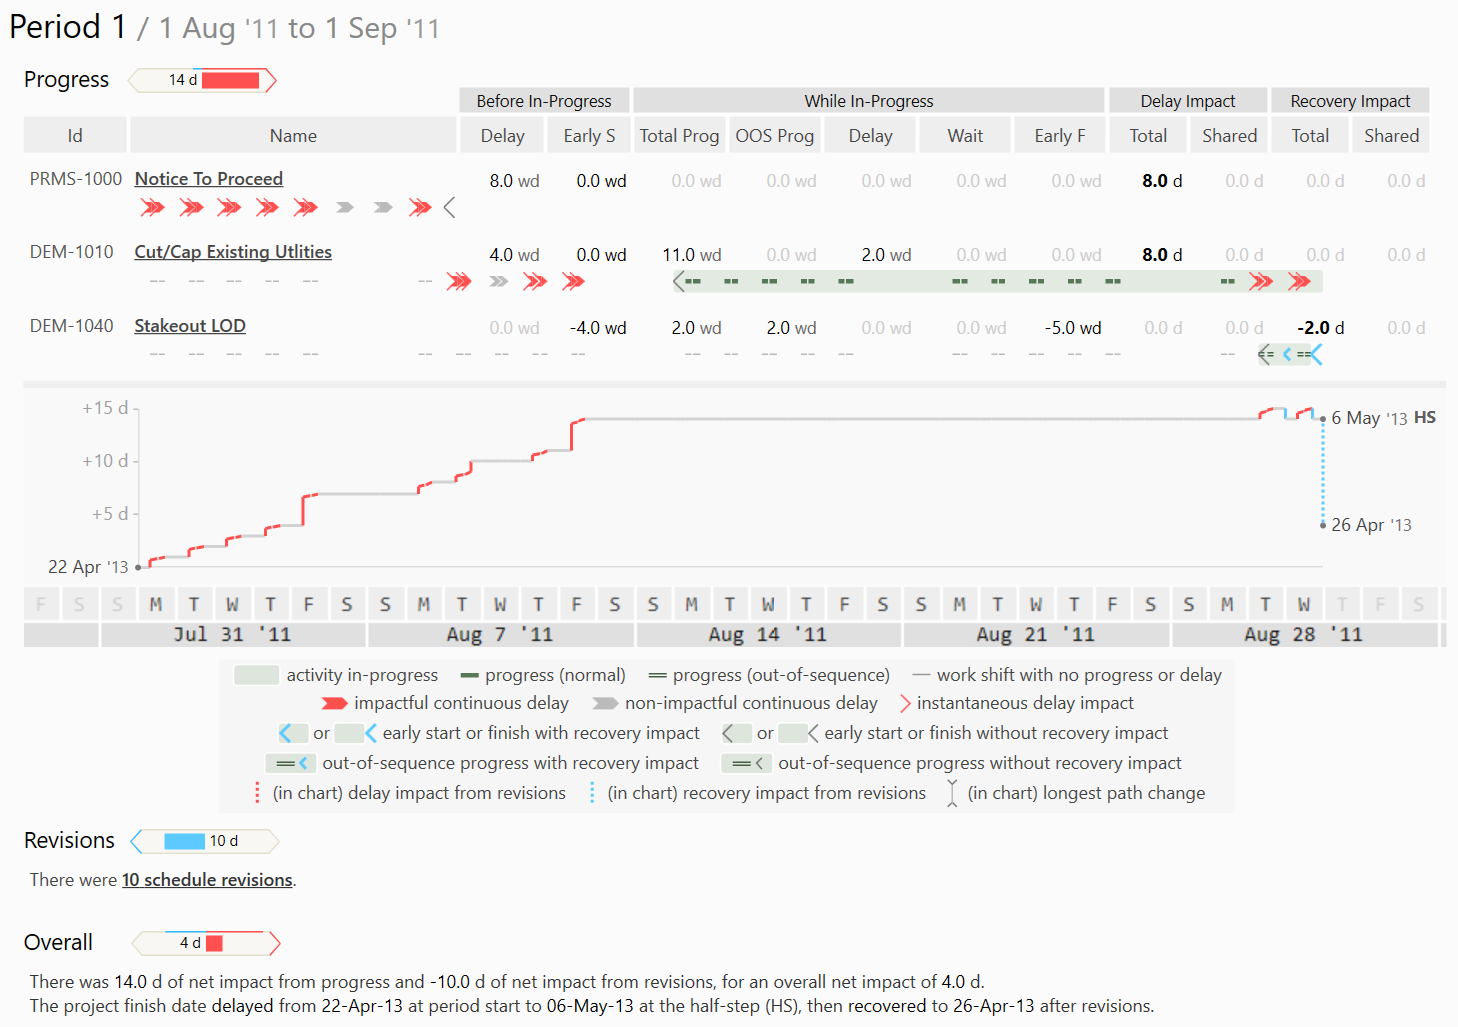 Figure 3
Delay Analyzer has a Gantt view (Figure 4) that superimposes the delays in the timeframe when they occurred. The yellow vertical line represents the data date, and you can drag the data date left and right to see the Gantt update in real time based on the state of the delay analysis.
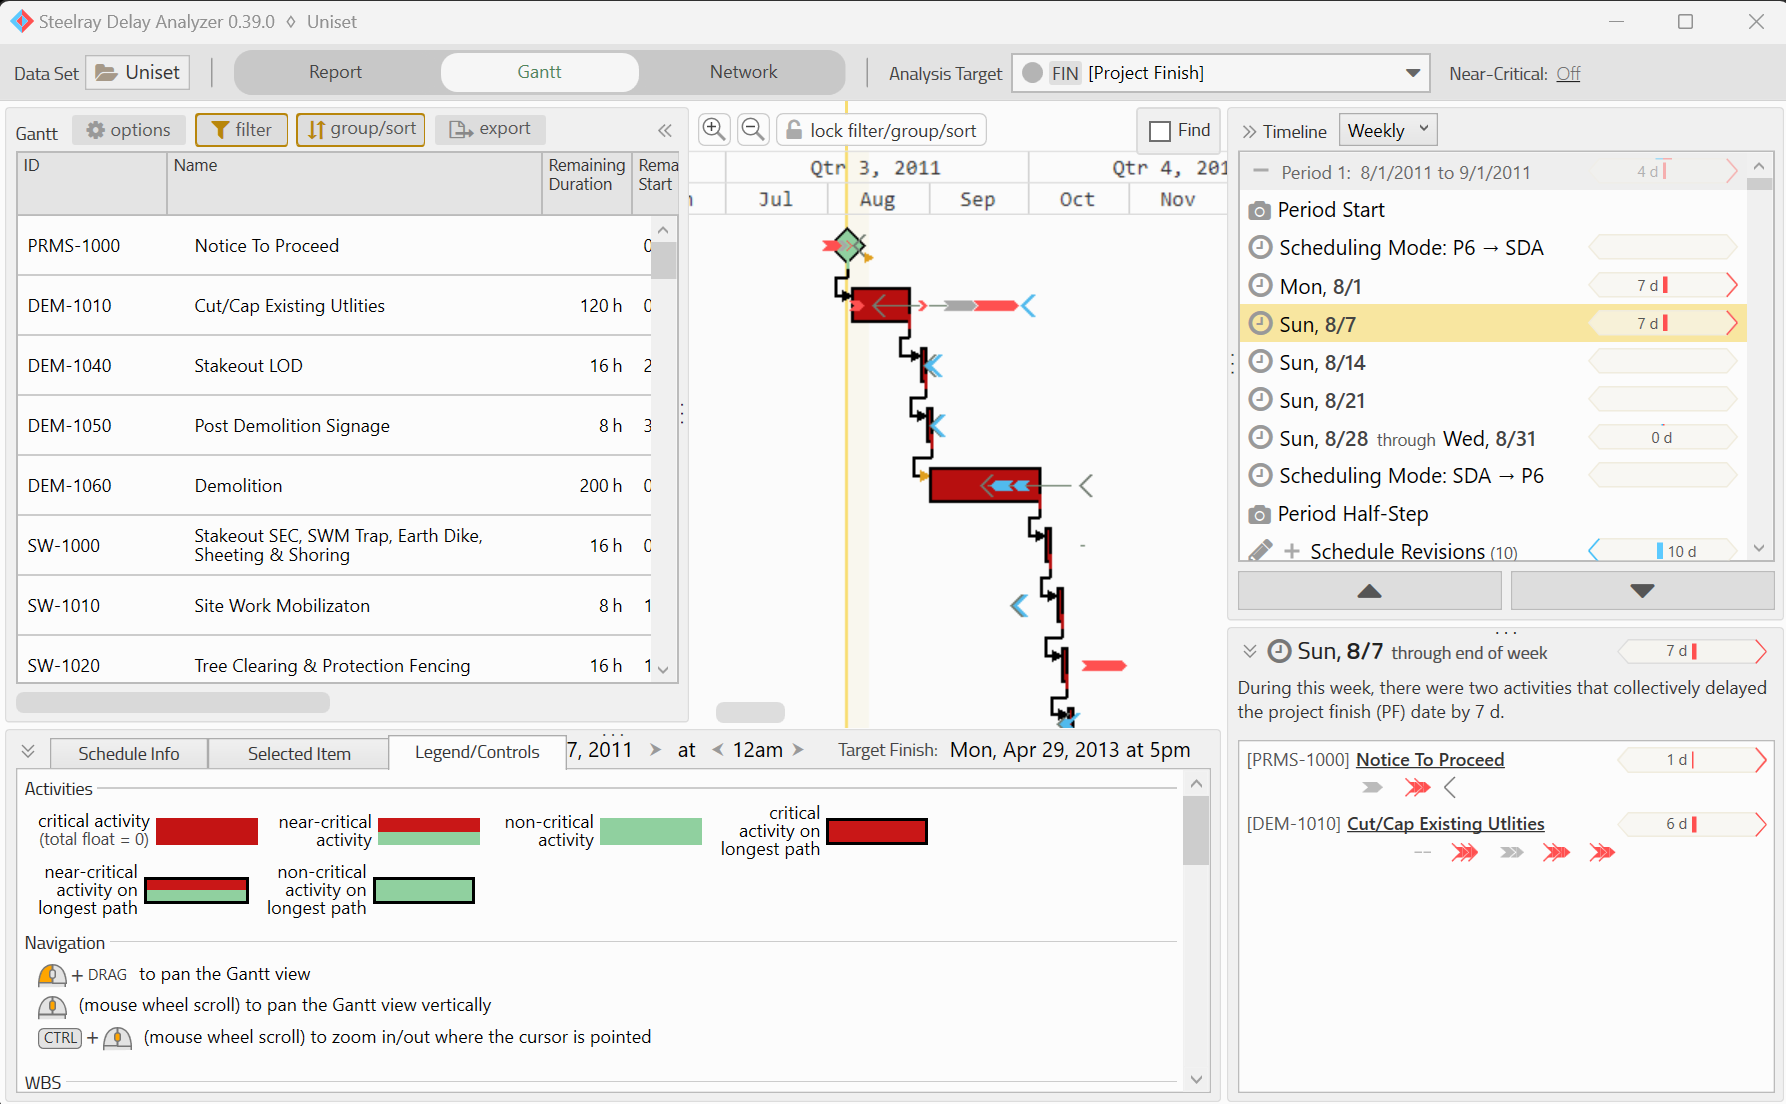 Figure 4
Summary
Steelray’s Delay Analyzer performs analyses that were previously not possible in real time. It will save you days each month while providing you with an objective, accurate and complete explanation of why the finish date (or any activity or milestone) moved between updates.
The results are reported using visualizations that enable you to explain what happened in real time. You can drag the data date and watch the Gantt Chart update in real time to better understand delays and recoveries.
Steelray offers Delay Analyzer as an annual or monthly subscription. For more information, visit steelray.com.