It is possible to print a nice hierarchical Work Breakdown Structure (WBS) chart of your Microsoft Project schedule by using Critical Tools, Inc. WBS Schedule Pro software.
The WBS is an important project management tool. The WBS is a hierarchical breakdown of all project deliverables. The WBS also displays the entire scope of the project. The presentation of the WBS to stakeholders is therefore an important step in the life of the project. Critical Tools Inc. provides Microsoft Project supplementary software to generate and print WBS charts of your project schedule.
This article provides a quick tip on how to make viewable WBS charts of your schedule for presentation to stakeholders.
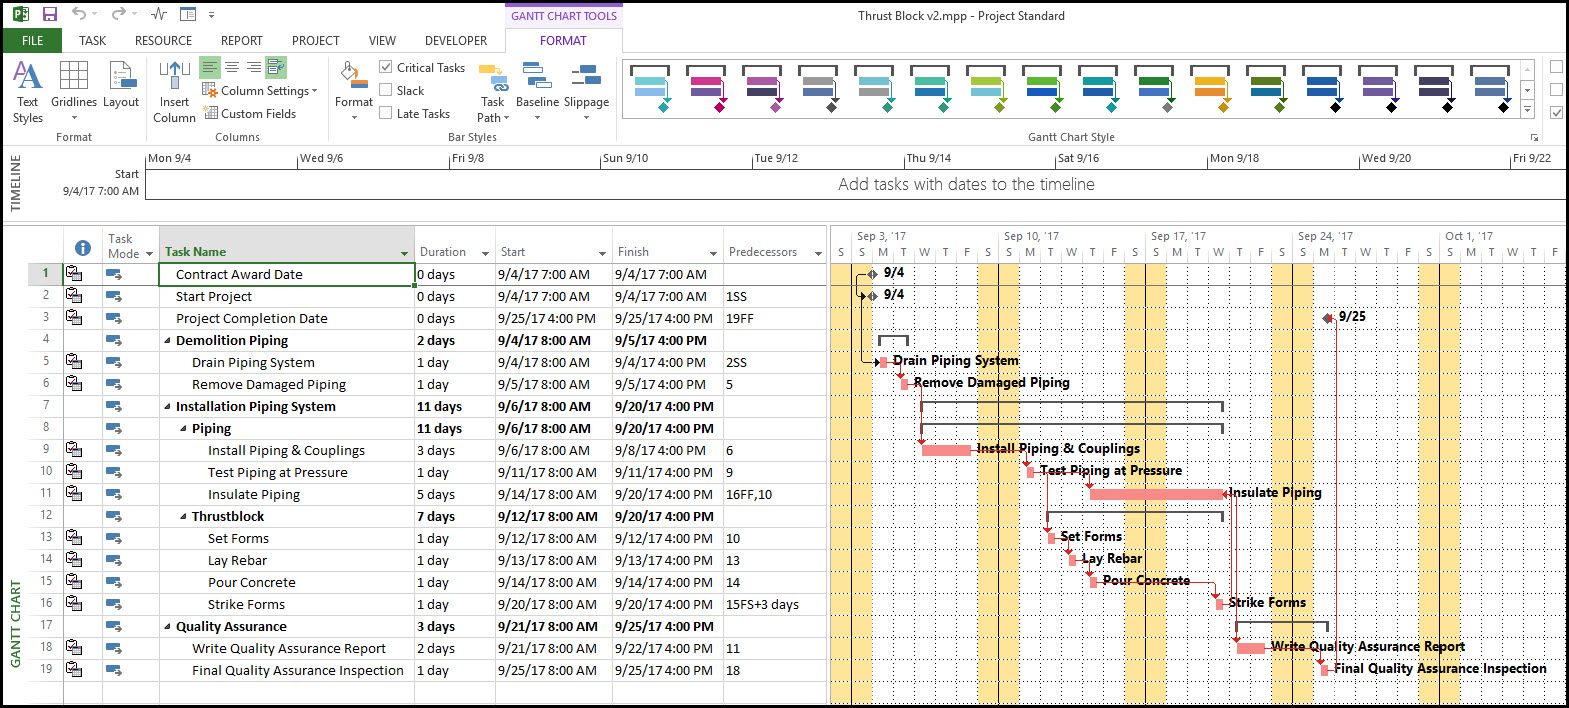
We have in Figure 1 a Microsoft Project sample schedule displaying the activities table and Gantt chart.
 Figure 1
We want to present a hierarchical chart of the WBS to stakeholders. Critical Tools Inc. provides supplementary Microsoft Project software, called WBS Schedule Pro, for the presentation of the schedule WBS in a hierarchical chart layout.
It is possible to generate WBS charts directly in WBS Schedule Pro, but I find it better to create a schedule in Microsoft Project and import this file to WBS Schedule Pro. Let’s proceed by converting our Microsoft Project schedule to the XML format. Simply open this XML format file in WBS Schedule Pro. The resulting WBS chart is displayed in Figure 2.
Figure 2

This chart has a few issues.
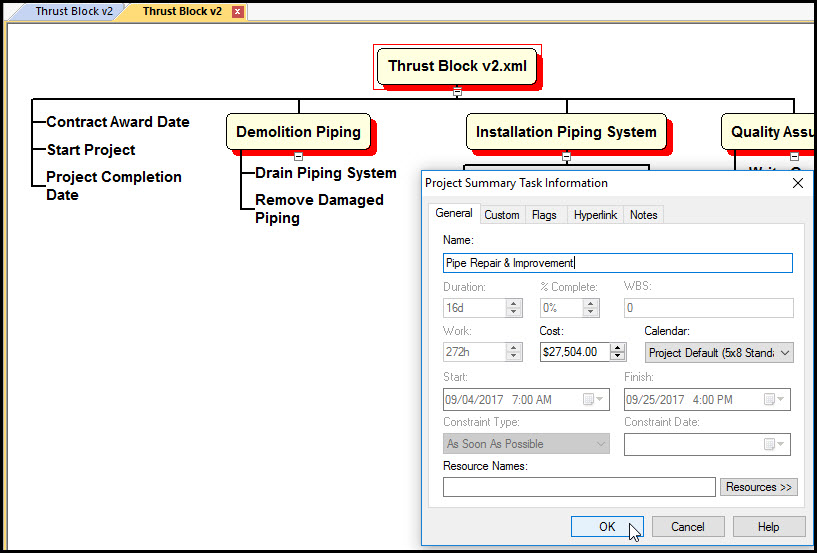
Let’s first address the project name issue; the project name is currently not displayed. In the grouping band toggle ‘project summary task’ to display a WBS element for the project title. Double click on the project WBS element and change its name in the project summary task information dialog, Figure 3.
Figure 3
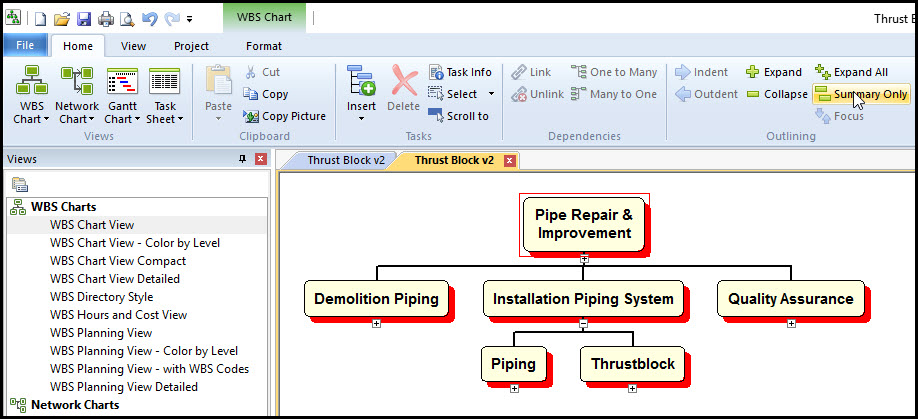
We then have a summary element for the project, but our chart is displaying too much information. Both the WBS elements and tasks are displayed. We want to display only the WBS elements, so select summary only in the outlining band, Figure 4.
Figure 4
Now our WBS chart looks right!
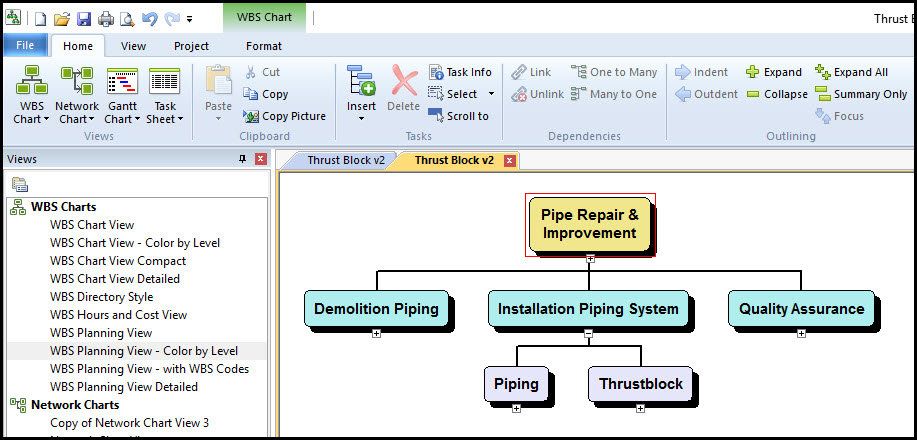
WBS Schedule Pro supports several WBS Chart and Planning views. Select WBS Chart View or WBS Planning View – Color by Level for a color coded WBS chart, Figure 5.
Figure 5
Choose WBS Planning View – with WBS codes to display a WBS Chart with WBS codes, Figure 6.
Figure 6
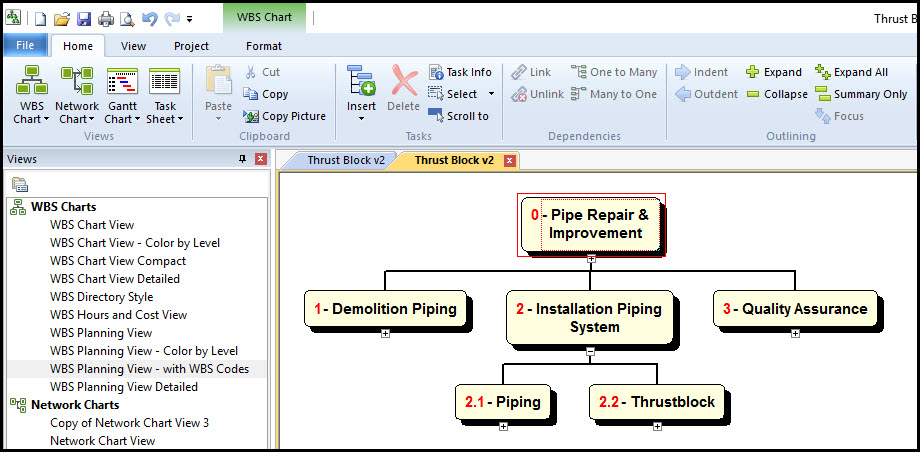
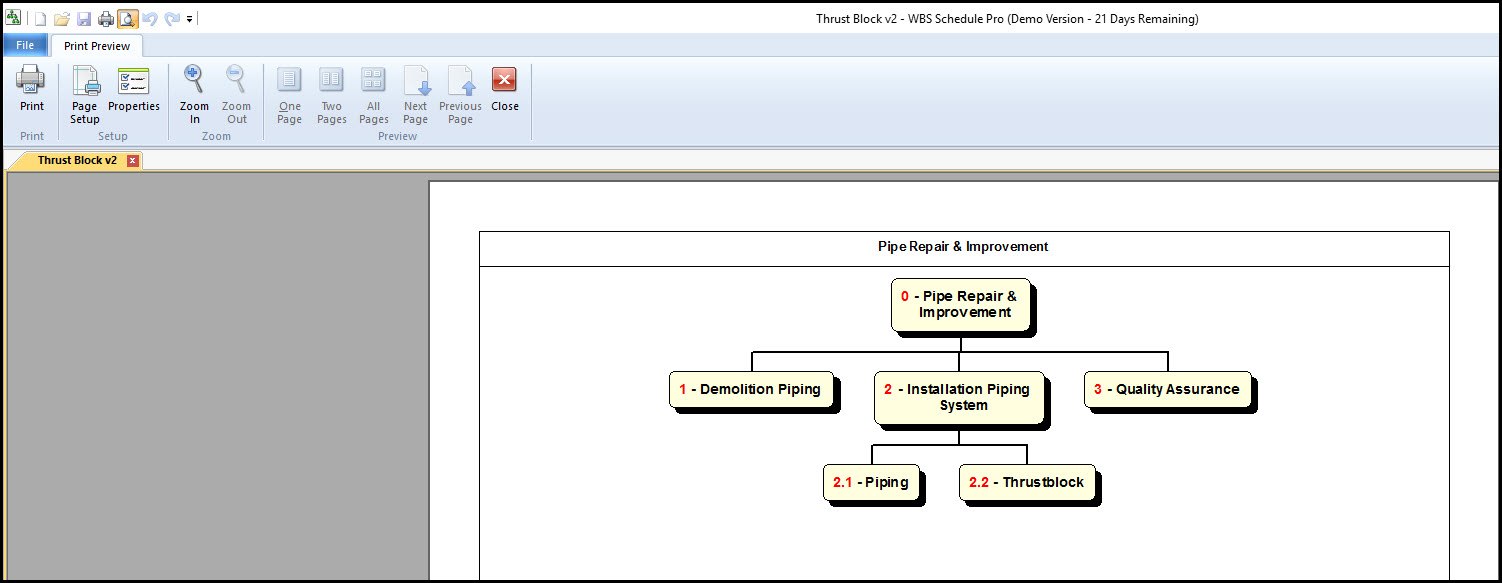
Figure 7 displays a print preview of our WBS Chart.
Figure 7
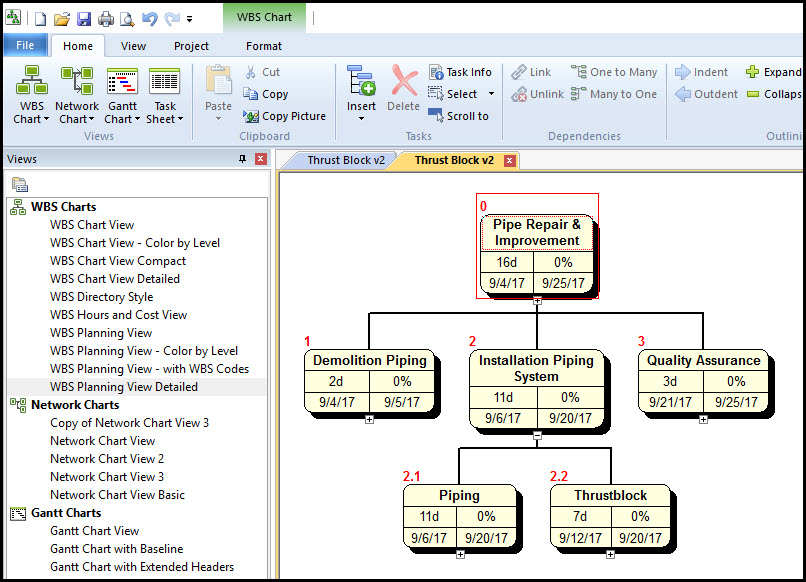
WBS Schedule Pro also has a detailed WBS Planning View, Figure 8.
Figure 8
Summary
The creation and presentation of the WBS is a major and important effort in the life of the project. WBS Schedule Pro supports generation and presentation of a hierarchical chart of the schedule’s WBS. Thus, it is possible to present to stakeholders a suitable hierarchical chart of all project deliverables and scope. Note it is also possible to configure WBS Schedule Pro to work seamlessly with Microsoft Project.