• Skip to main content
  • Skip to primary sidebar
  • Skip to footer

Ten Six Consulting

Project and Earned Value Management, Primavera P6 & Deltek Cobra & Acumen Services

703-910-2600
  • Training Classes
    • Primavera P6 Training
    • Deltek Training
    • Earned Value Management Training
    • Project Management Training
    • Open Training Class Dates
  • Scheduling Services
  • Earned Value Mgmt. Services
    • Consulting
      • RFP Support
      • Your EVM System
      • Certification
      • Data Analysis and Reporting
      • Post Contract Support
      • Staff Augmentation
      • WBS Guidelines for Government Acquisition Programs (MIL-STD 881D)
  • Tools
    • Primavera P6
      • Knowledge Transfer, Mentoring and Coaching
      • BI Publisher Services
    • Primavera Unifier
    • Deltek Cobra
      • Knowledge Transfer, Coaching and Mentoring
      • Staff Augmentation
    • Microsoft Project to Primavera P6 Conversion Services
    • Microsoft Project
      • Building an Integrated Master Schedule (IMS)
      • Integrating Microsoft Project with Deltek Cobra
      • Migrating From Microsoft Project To Oracle Primavera P6
  • Blog
    • Deltek Acumen
    • Deltek Cobra
    • Earned Value Mgmt
    • Microsoft Project
    • PMO
    • Primavera P6
    • Project Management
    • Risk Management
  • Contact Us

Stacked Histograms in P6 Professional

You are here: Home / Primavera P6 / Stacked Histograms in P6 Professional

January 27, 2017 By TheP6Pro

Primavera P6 Professional has long had capabilities to produce some pretty decent stacked resource histograms. That being said, many folks aren’t aware they are there or have not had time to explore the capabilities they offer. This article quickly shows you how to create a stacked histogram using some simple steps.

You can create a stacked histogram in the bottom details area of the Activities tab using the Resource Usage Profile view. As you can see below, they can produce some very useful resource information in a very attractive and easy to understand format that is guaranteed to impress even the most fastidious of data consumers.

stacked_000

You’ll need a resource loaded schedule to try out these steps for yourself in Primavera P6. This can be labor, non-labor or material resources.  When you create a stacked histogram, you will need to confine it to one type of resource, such as all labor or all materials. If you mix them, the graph will be blank.

Let’s get started

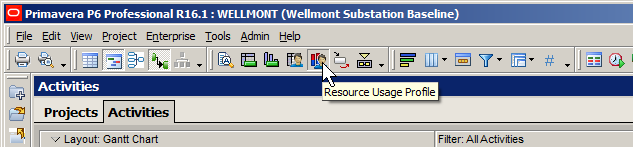
In the Activities tab, select the Resource Usage Profile option from the Bottom Layout tool group.

stacked_001
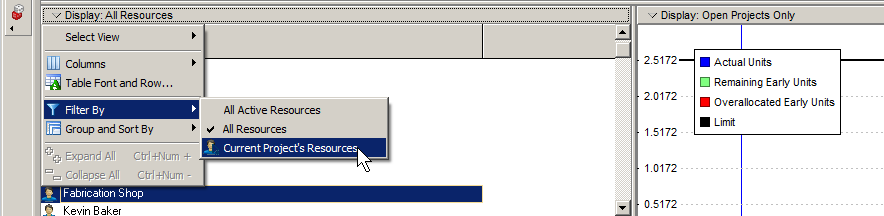
Next, let’s filter out any unnecessary resources by selecting the Current Project’s Resources option in the Display dropdown of the Resource Usage Profile tab.

stacked_002

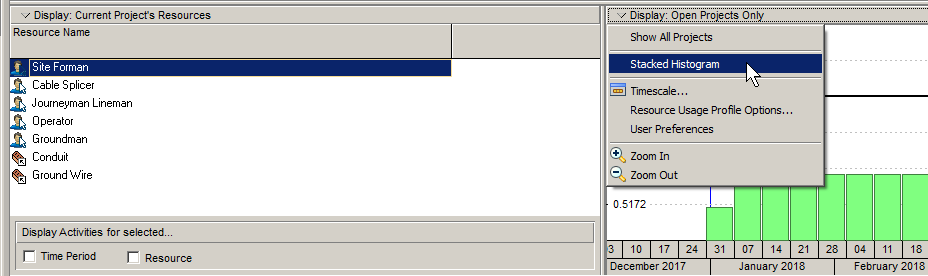
Next, click on the Display: dropdown in the top-left of the graph area and choose Stacked Histogram from the menu.

stacked_003

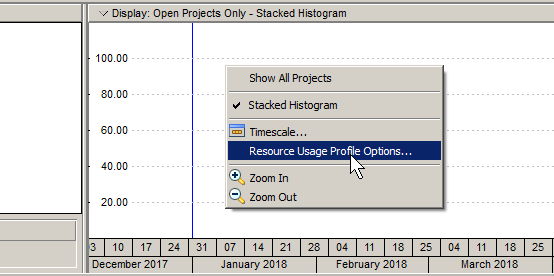
The graph area will go blank, typically displaying only some horizontal sight lines.

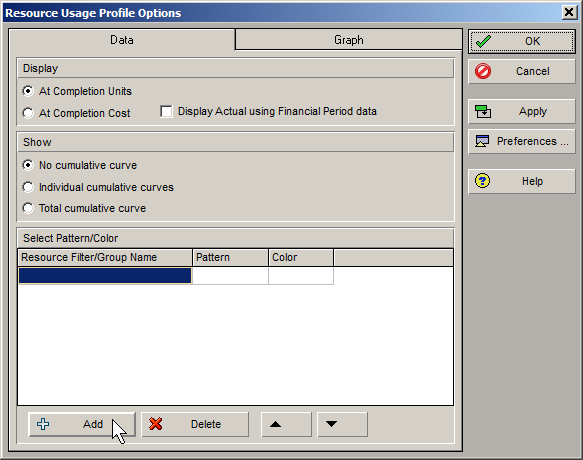
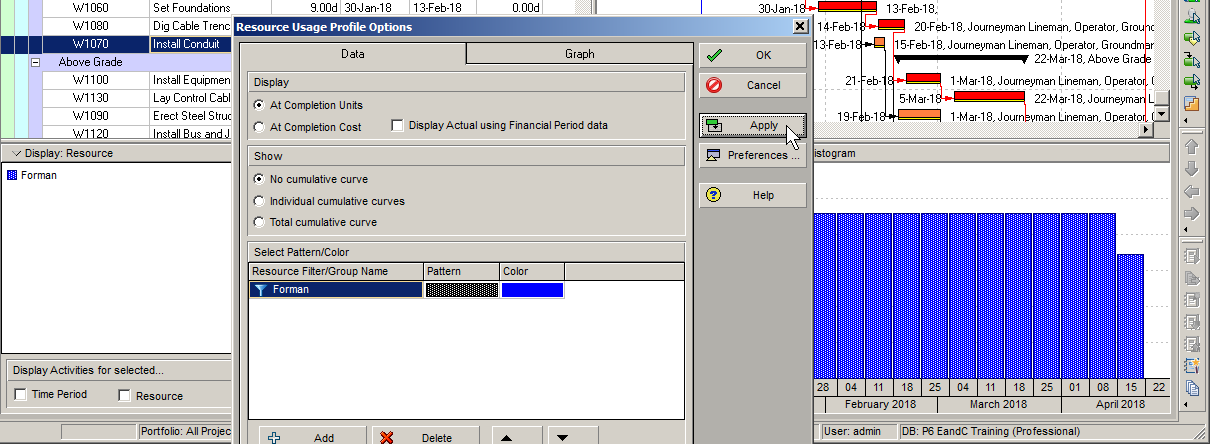
Right-click in this blank graph area and choose the Resource Usage Profile Options menu item.

stacked_004

In the Resource Usage Profile Options dialog, click on the Add button at the bottom of the Data tab.

stacked_005

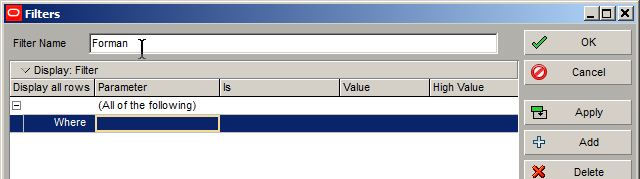
In the resulting Filters dialog, create a name for the filer, preferably the same as the resource you intend to display.  In this example we are calling the filter “Forman”, which will be the name for the stack bars and resource we select to display.

stacked_006

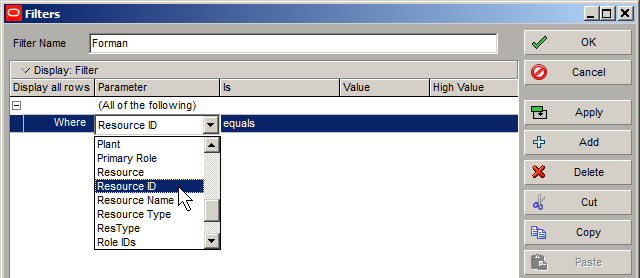
Next we click in the Parameter field and select Resource ID.

Tip – when you have the list open, click ‘R’ on your keyboard.  This list is character sensitive and will scroll to the first ‘R’ in the list.

stacked_007

With the ‘Is’ field set to ‘equals’, click on the Value field and select the resource you wish to display.  In this case we select the FORMAN resource from the top of the list.

stacked_008

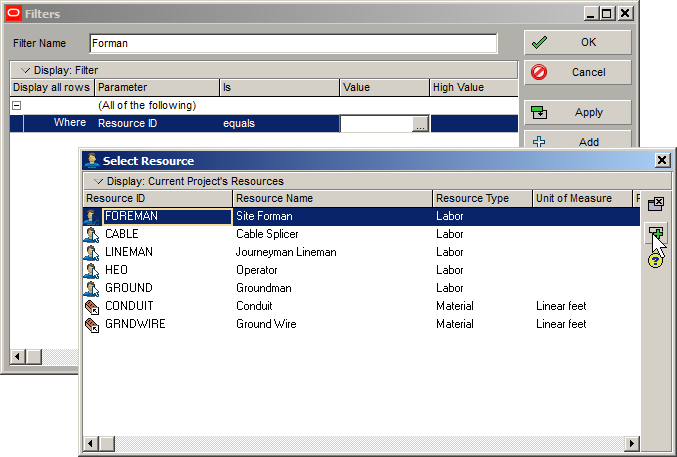
Having made our selection from the Select Resource dialog, we click the Select button to apply it and close the dialog.

Next we click on the Apply button back in the Filters dialog.  You will see the first of your stacked histogram selections appear in the graph area.

stacked_009

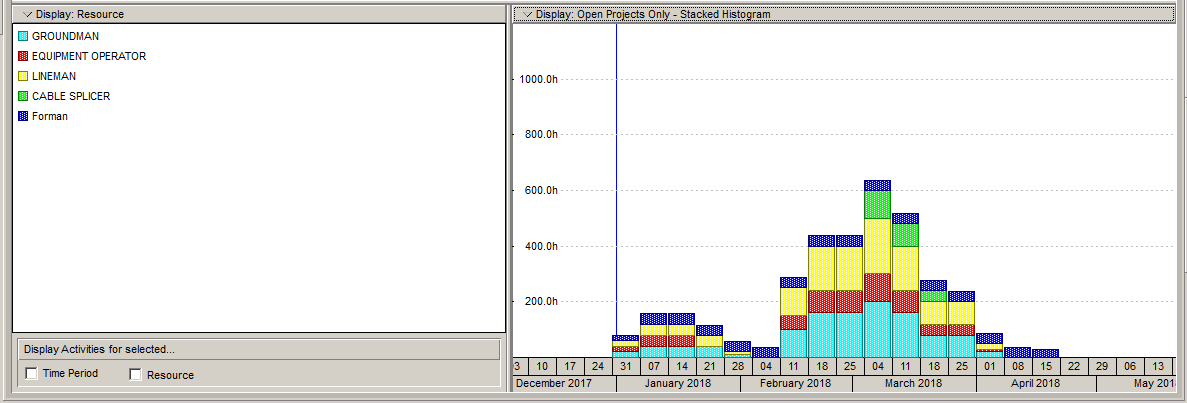
Now click the Add button again and repeat the process for all the resources you wish to include in your stacked histogram.  The final result will look similar to the following:

stacked_010

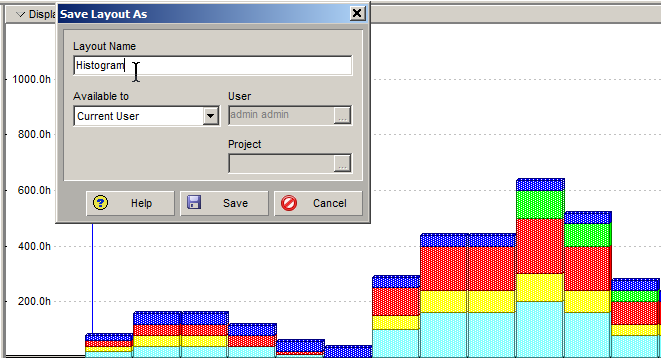
You can save your newly created histogram using the Save Layout As… feature, just as you can for other changes you make to a layout.  We recommend you do this to save a lot of work the next time you want to report a stacked histogram.

stacked_011

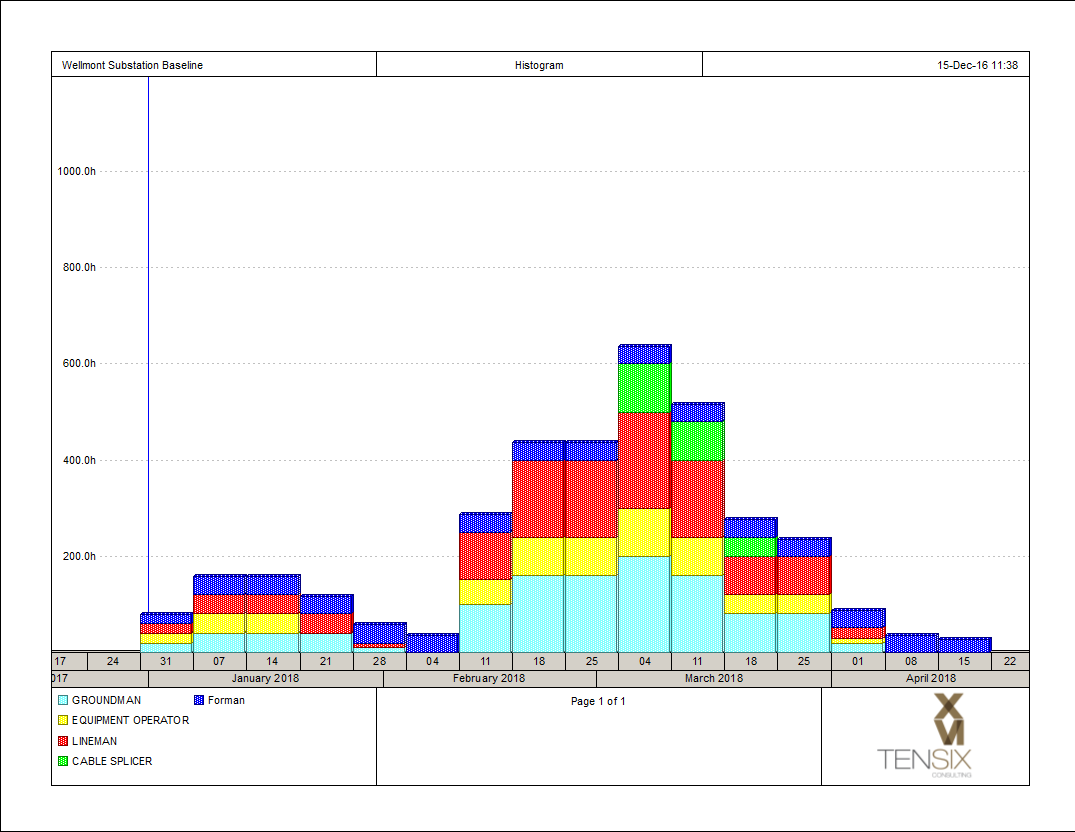
And of course you can print these graphs using the Profile option of the Page Setup, Options tab in the Print Preview view.

stacked_012

Summary

As you’ve just seen you can use the Primavera P6 Professional stacked histogram tool to create some very useful and attractive reports that will show you how resources are being deployed across your project. We’ve just shown you the basics here and suggest that you experiment with other settings in the Resources Usage Profile Options dialog to learn how to add such things as cumulative curves and other interesting option to your stack histogram reports.

Primary Sidebar

  • This field is for validation purposes and should be left unchanged.
  • Facebook
  • LinkedIn
  • Twitter

Categories

  • Deltek Acumen
  • Deltek Cobra
  • Earned Value Mgmt
  • Microsoft Project
  • PMO
  • Primavera P6
  • Project Management
  • Risk Management
CONTACT US

Footer

Upcoming Classes

Primavera P6 Professional Fundamentals
Primavera P6 EPPM Fundamentals
Primavera P6 EPPM Administrator
Primavera P6 BI Publisher Fundamentals
Deltek Cobra Fundamentals
Deltek Cobra Advanced
Deltek Acumen Fuse
Deltek Acumen Risk

  • This field is for validation purposes and should be left unchanged.
  • Facebook
  • LinkedIn
  • Twitter
  • Consulting Services
  • Clients
  • About Ten Six
  • Contact Us
  • Blog

Copyright © 2022 · Ten Six Consulting, LLC · 703.910.2600

  • Training Classes
    ▼
    • Primavera P6 Training
    • Deltek Training
    • Earned Value Management Training
    • Project Management Training
    • Open Training Class Dates
  • Scheduling Services
  • Earned Value Mgmt. Services
    ▼
    • Consulting
      ▼
      • RFP Support
      • Your EVM System
      • Certification
      • Data Analysis and Reporting
      • Post Contract Support
      • Staff Augmentation
      • WBS Guidelines for Government Acquisition Programs (MIL-STD 881D)
  • Tools
    ▼
    • Primavera P6
      ▼
      • Knowledge Transfer, Mentoring and Coaching
      • BI Publisher Services
    • Primavera Unifier
    • Deltek Cobra
      ▼
      • Knowledge Transfer, Coaching and Mentoring
      • Staff Augmentation
    • Microsoft Project to Primavera P6 Conversion Services
    • Microsoft Project
      ▼
      • Building an Integrated Master Schedule (IMS)
      • Integrating Microsoft Project with Deltek Cobra
      • Migrating From Microsoft Project To Oracle Primavera P6
  • Blog
    ▼
    • Deltek Acumen
    • Deltek Cobra
    • Earned Value Mgmt
    • Microsoft Project
    • PMO
    • Primavera P6
    • Project Management
    • Risk Management
  • Contact Us