If you are not sure how to set up a baseline to measure project progress in Microsoft 2013 then you may find this article very helpful.
After completion of the initial planning phase of the project, where the tasks, durations, task relationships, etc. have been entered and scheduled, it is time to make a baseline of the project.
A baseline is a snapshot of all the planned work before commencement of the work. The baseline should be approved by the project manager, sponsor, and other stakeholders, as appropriate. The baseline allows you to clearly display where the schedule is diverting from the original plan.
This article describes how to create a baseline and set up both your task view and Gantt chart view in preparation for measuring project performance in Microsoft Project 2013. Although, the article does provide a few updates it is not intended to provide an exhaustive review of schedule update procedures.
Start and Finish Column Headings
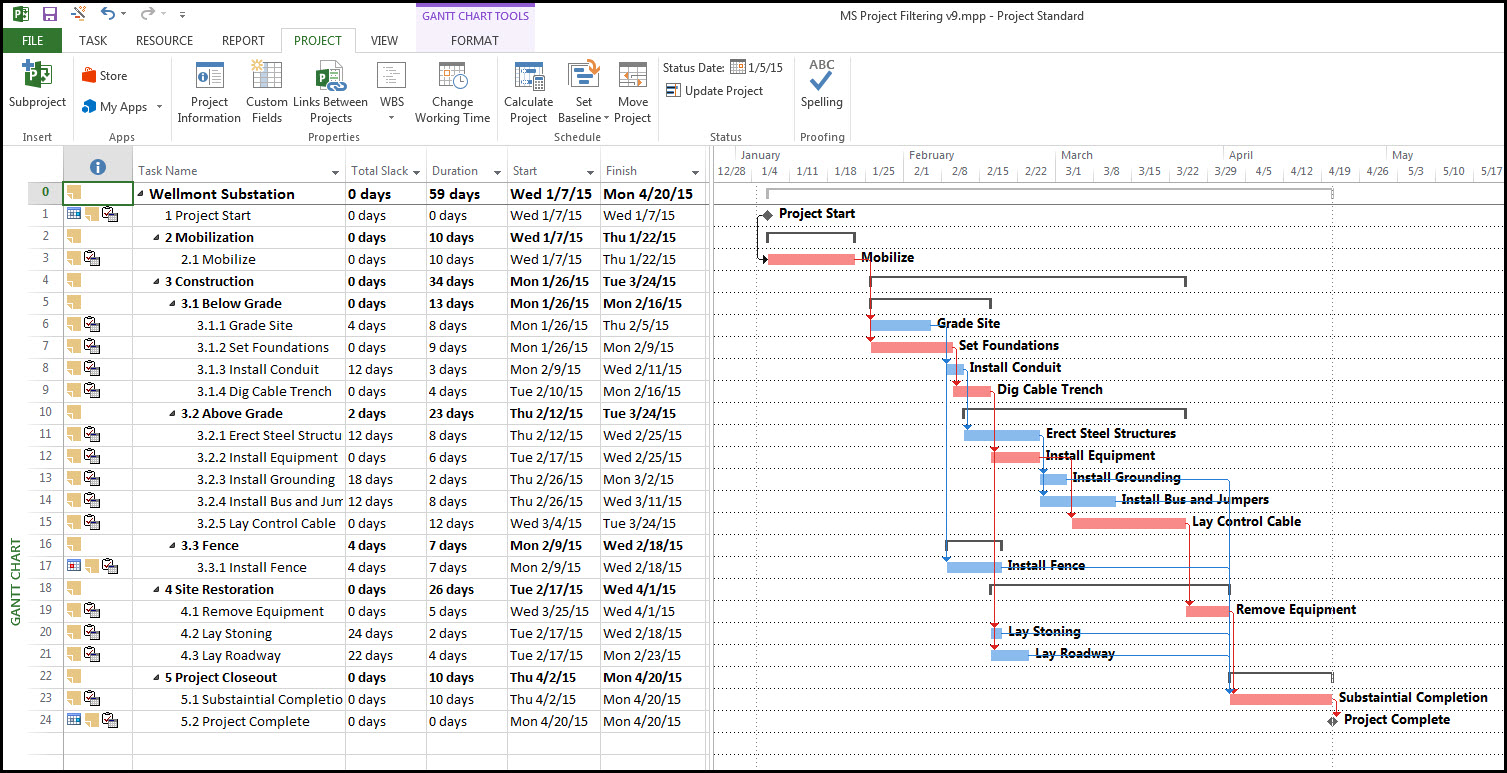
To begin Figure 1 displays a sample schedule with a Gantt chart, tasks, durations, and start and finish dates.

Figure 1
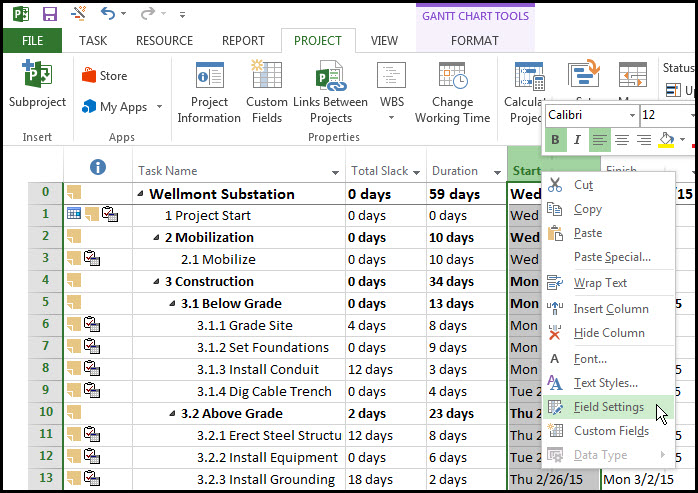
Before we start, it makes sense to change your start and finish columns to estimated start and estimated finish. This is done by right clicking on the respective column heading and selecting Field Setting from the resulting drop down menu, Figure 2.
Figure 2
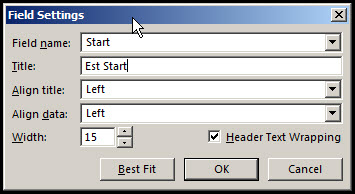
This brings up your Field Settings dialog. Keep the field name the same, but enter the Title Est Start, Figure 3, for the start column and Est Finish for the finish column.
Figure 3
Setting the Baseline
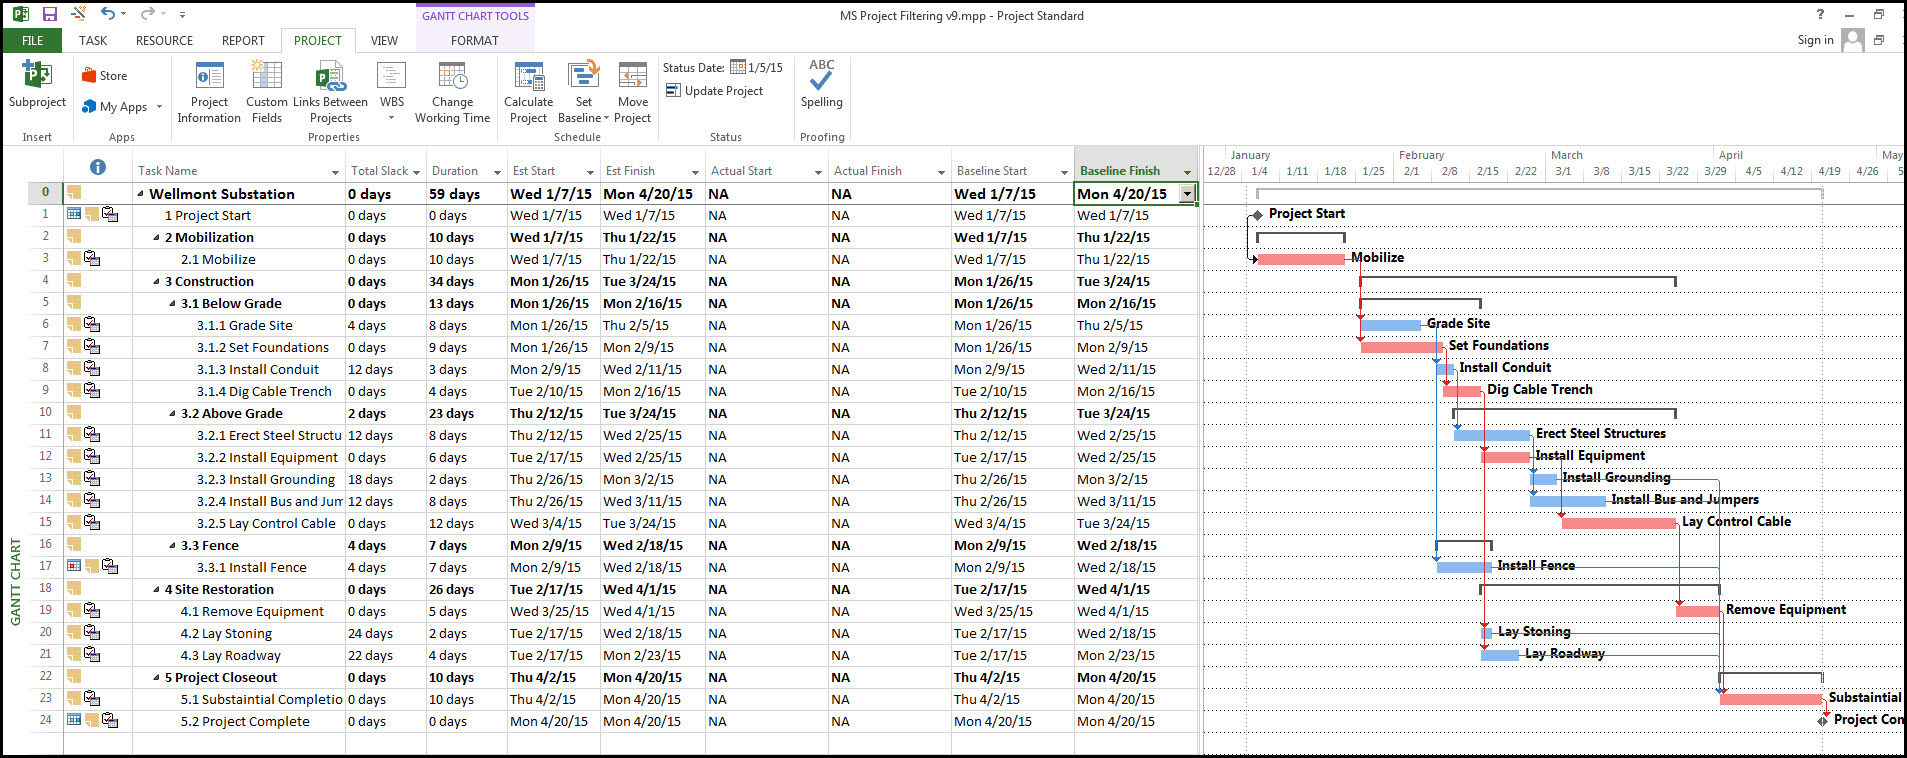
Next add four columns to your task view: Actual Start, Actual Finish, Baseline Start, and Baseline Finish, Figure 4.
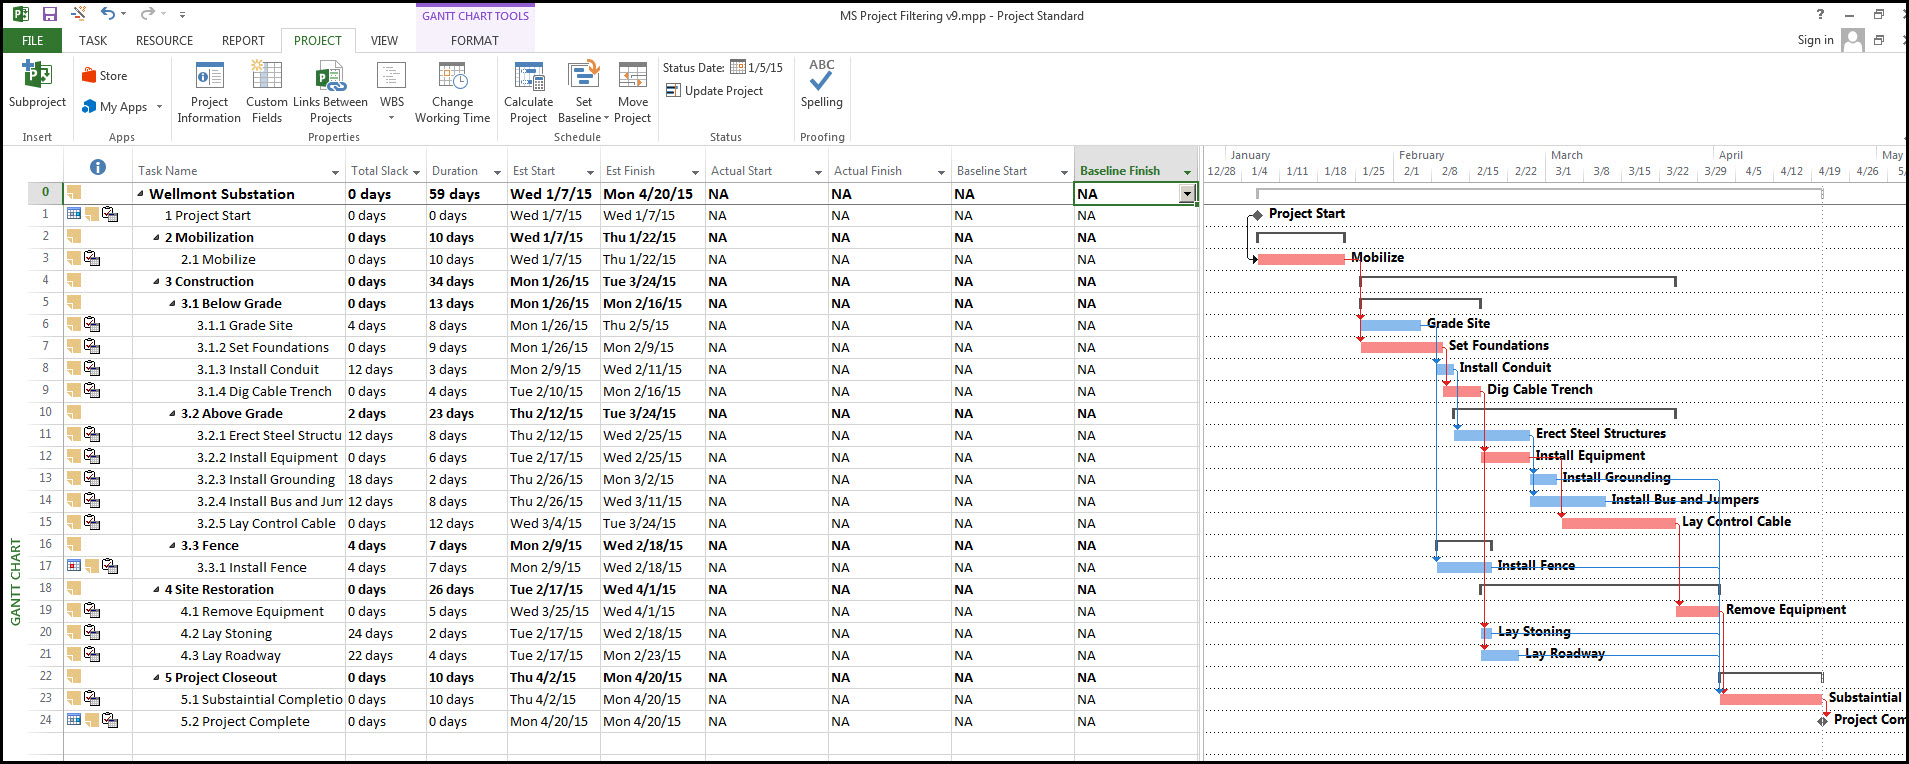
Figure 4
You will use the Actual Start and Actual Finish columns to enter actual schedule dates, and the Baseline Start and Baseline finish columns will be populated with the baseline dates once a baseline is fixed. Setting the baseline, in fact, is the next step. To set the baseline select the Project tab, Schedule ribbon, Set Baseline drop down menu, and click Set Baseline. This brings up the Set Baseline dialog, Figure 5.
Figure 5
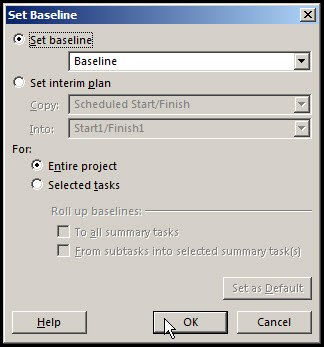
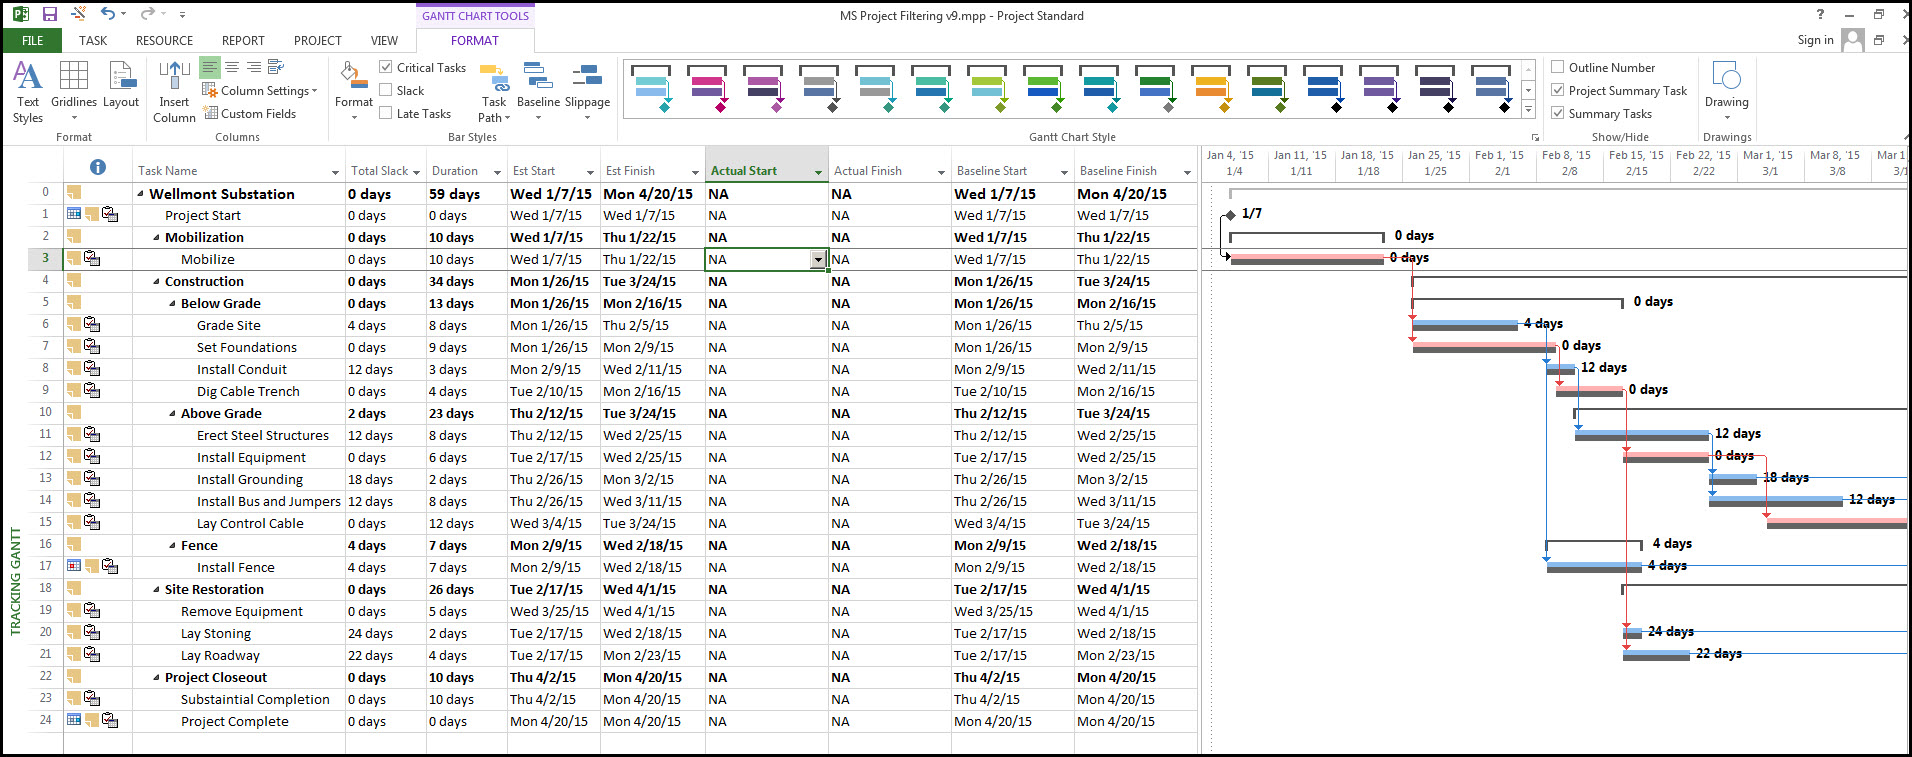
You want to set the baseline for the entire project, as displayed in Figure 5. Once you set the baseline you will notice that Microsoft Project 2013 has populated your Baseline Start and Baseline Finish columns with dates similar to your Estimated Start and Estimated Finish Columns, Figure 6.
Figure 6
Baseline on the Gantt Chart
Now that you have a baseline you want to view it on the Gantt chart. To display the baseline on the Gantt chart select the Task tab, View ribbon, Gantt Chart drop down menu, and click Tracking Gantt. Now you have your baseline displayed in gray and underneath your schedule bars, Figure 7.
Figure 7
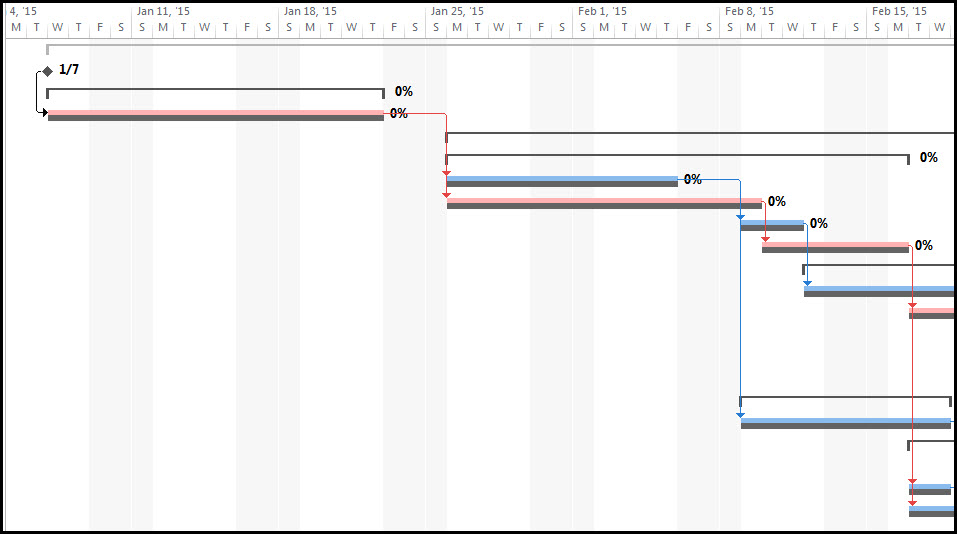
You may have noticed that your Gantt chart now displays in days, which makes it too large for ease of viewing. To change the Gantt chart timescale right click on the Gant chart date header and select Timescale, Figure 8.
Figure 8

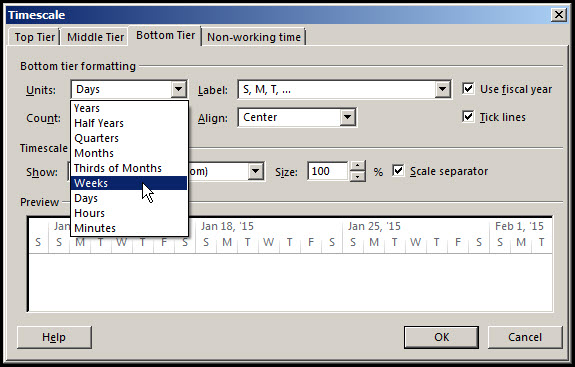
In the resulting Timescale dialog change the Bottom Tier units from Days to Weeks, Figure 9.
Figure 9
Your schedule will now look similar to Figure 10.
Figure 10
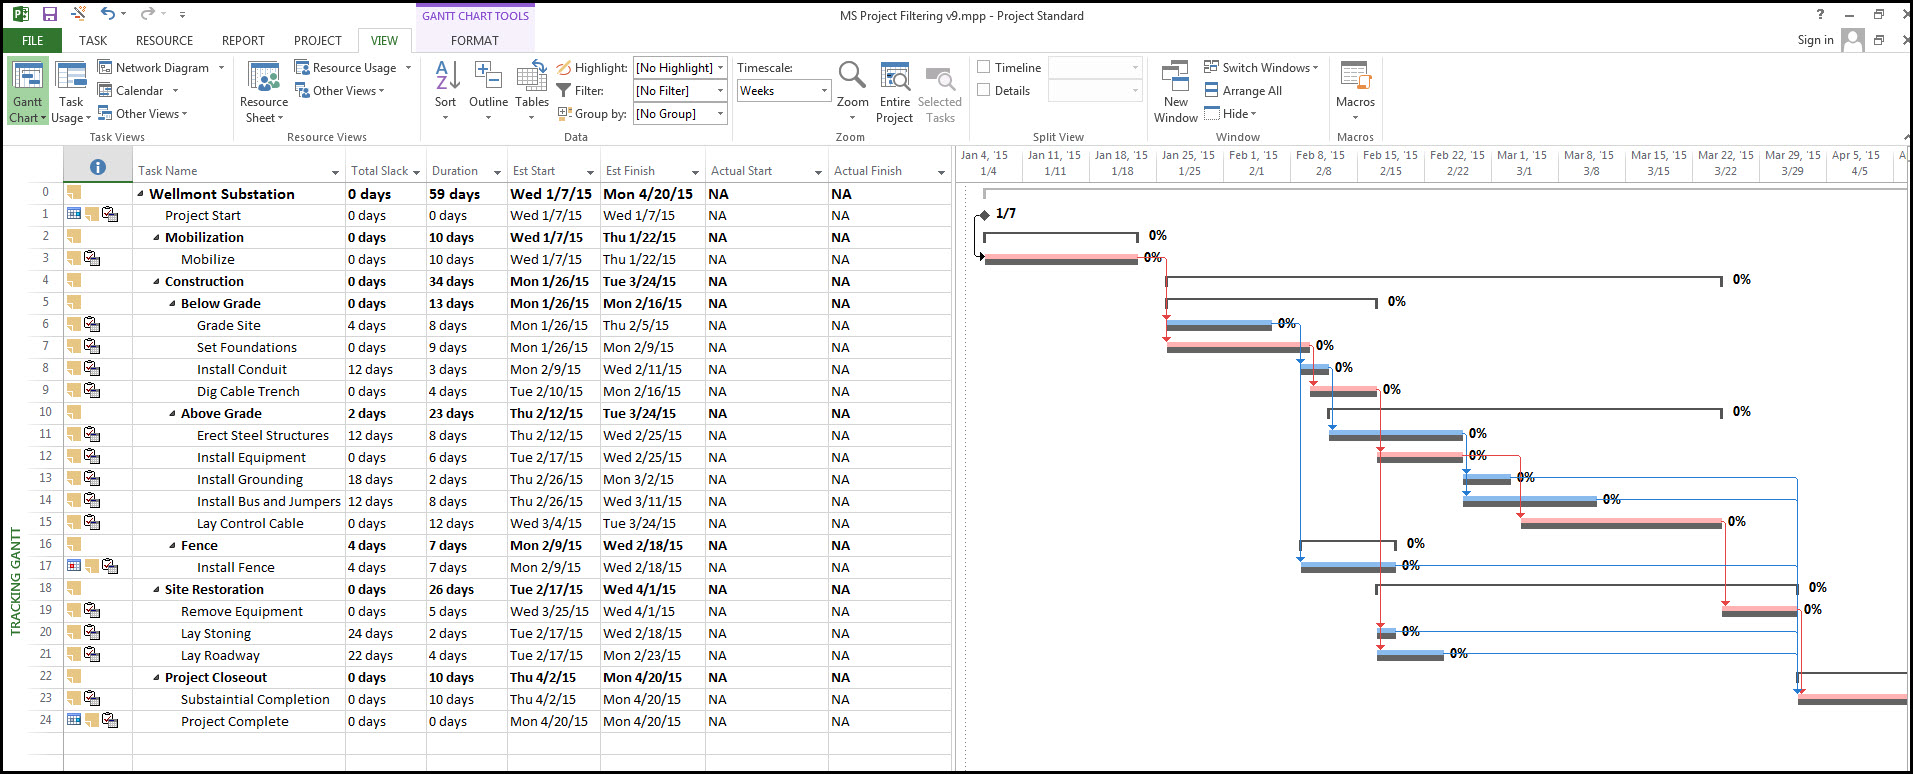
One last thing to change before commencing with project updates. You will want to change the Gantt chart labels to display the total slack. To do this select the Format tab, Bar Styles ribbon, Format drop down menu, and click Bar Styles. The Bar Styles dialog will appear, Figure 11.
Figure 11
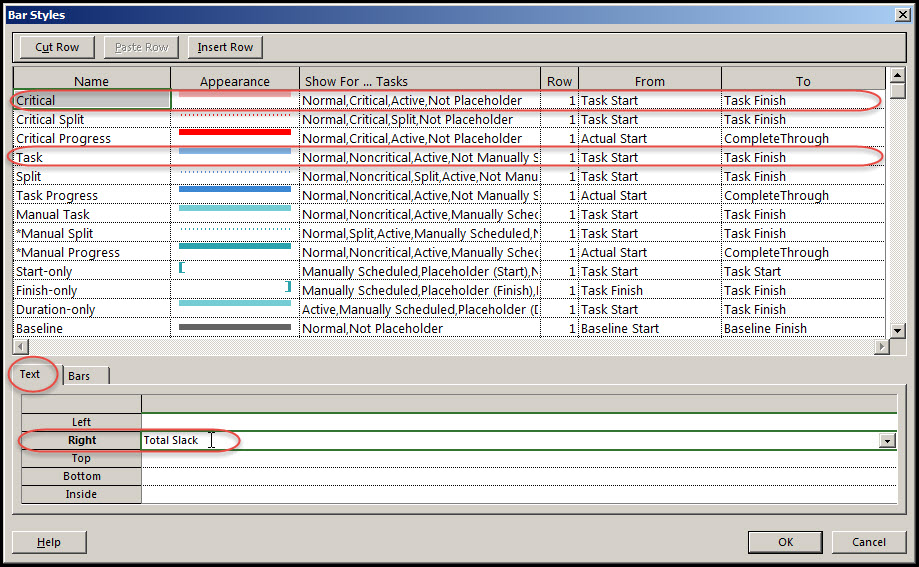
As shown in Figure 11, change the Text for Critical, Task, and Summary (not in figure) to Total Slack. Now your schedule with baseline is ready for updates, Figure 12.
Figure 12
Updates
To begin updating the schedule select the Project Start milestone and then select the Task tab, Schedule ribbon, and 100% icon, Figure 13. Microsoft Project 2013 will automatically populate the Actual Start and Actual Finish columns, again, Figure 13.
Figure 13

Now highlight the Mobilize task and in the Actual Start column enter Wed 1/7/15, Figure 14, which shows that the task stated on time.
Figure 14
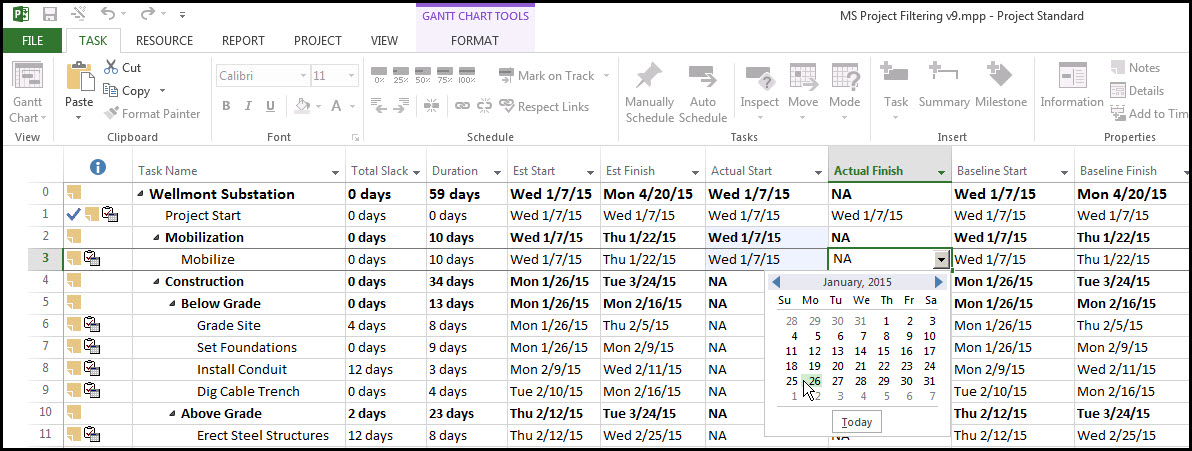
However, in the Actual Finish column enter a finish date of 1/26/15, which shows that the task completed one business day late, Figure 14. When you enter the late finish date the warning message in Figure 15 will appear.
Figure 15
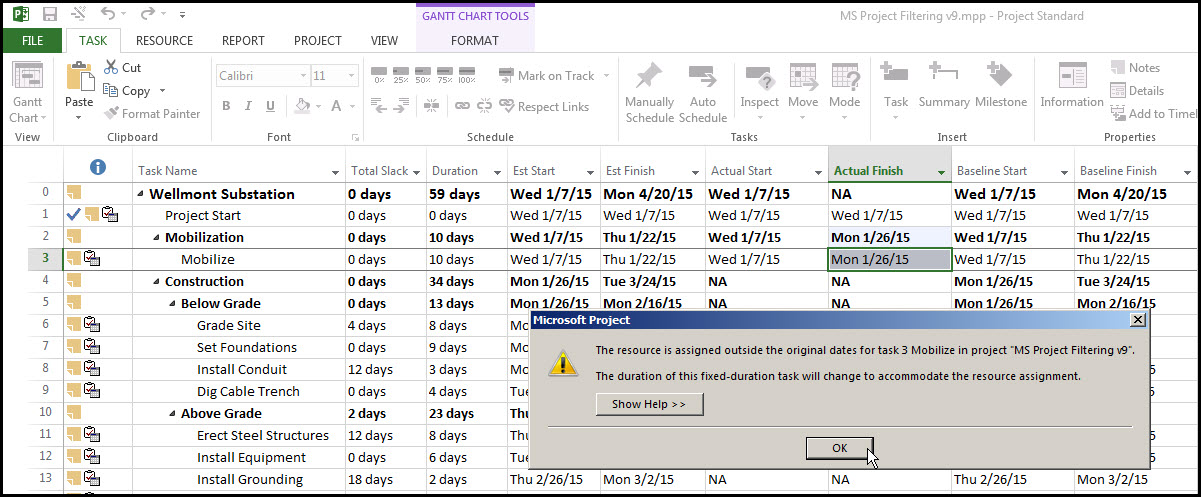
Select OK to say you understand the resource assignment is outside the original dates for Task 3 Mobilize. After entering the late finishing Mobilize task the Gantt chart will look similar to Figure 16.
Figure 16
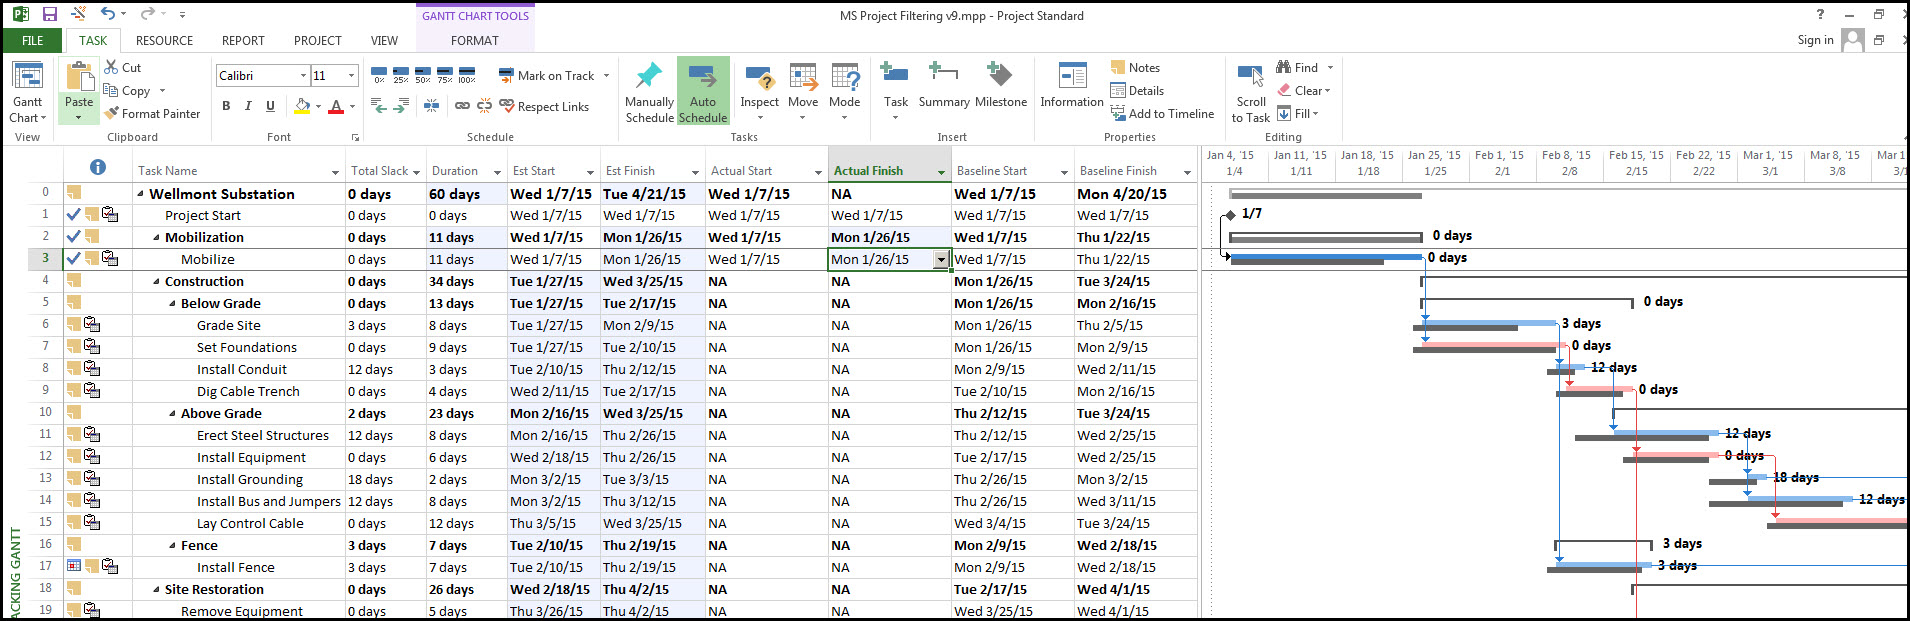
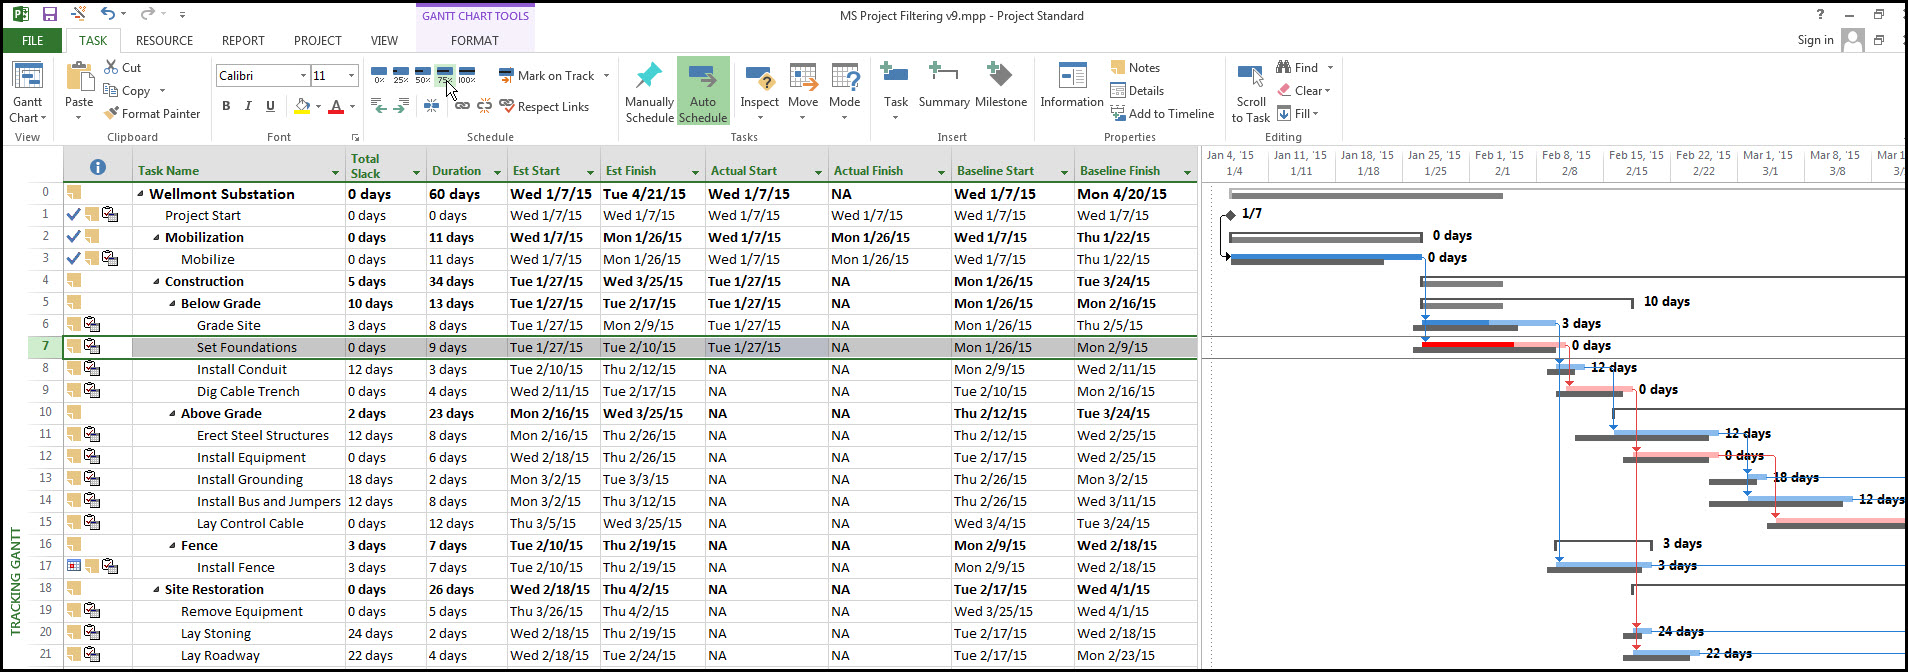
Because the Mobilize task is on the critical path all the tasks succeeding Mobilize will be one day delayed. Now let’s say you update your task up to and including the 1st of February, 2015. Again use the Task tab, Schedule ribbon, and % icons to define progress. As described in Figure 17, update the Grade Site task by saying it is 50% complete and the Set Foundation task by saying it is 75% complete.
Figure 17
You now have your schedule, including a baseline, and a few updates to send you on your way toward measuring project progress, and analyzing the relative success of your project.
Summary
In addition to setting the baseline, you will need to add actual and baseline columns to your task view, and also use the Tracking Gantt chart to view the baseline in the Gantt chart. Once the baseline is set and your task view and Gantt chart view adjusted for easy progress measurement, you are ready to commence updates.
It is highly recommended that you create a copy of your schedule and baseline before proceeding with the update procedures. Microsoft Project 2013 provides several ways to update your project progress, which you can explore in more detail having prepared your schedule for updates.
After completion of the initial planning phase of the project, where the activities, activity durations, and activity relationships have been successfully entered and scheduled, it is time to make a baseline of the project. The baseline is a complete copy of the project that is linked to the original project. The baseline allows you to clearly display where the project is diverting from the original plan.