Creating a schedule update report for program sponsors or customers that they are happy with is not always an easy task. What do you provide them? Would a progressed Gantt chart be sufficient? Or how about a tabulated report? Well, a tabulated report may provide the sponsors the level of detail they desire and in a better format.
Your schedule, which includes both physical and duration activity percent complete types, has progressed several weeks. Because your schedule includes activity steps that are not displayed on the Gantt chart a tabulated report would be better than a print out of the Gantt chart. Details on activity steps may be included in a tabulated report. The tabulated report may also be tailored for easy reading of data.
This article describes how to use the reports wizard in Primavera P6 to create a status report of a schedule that includes detailed activity step information.
The schedule for our example is displayed in Figure 1.
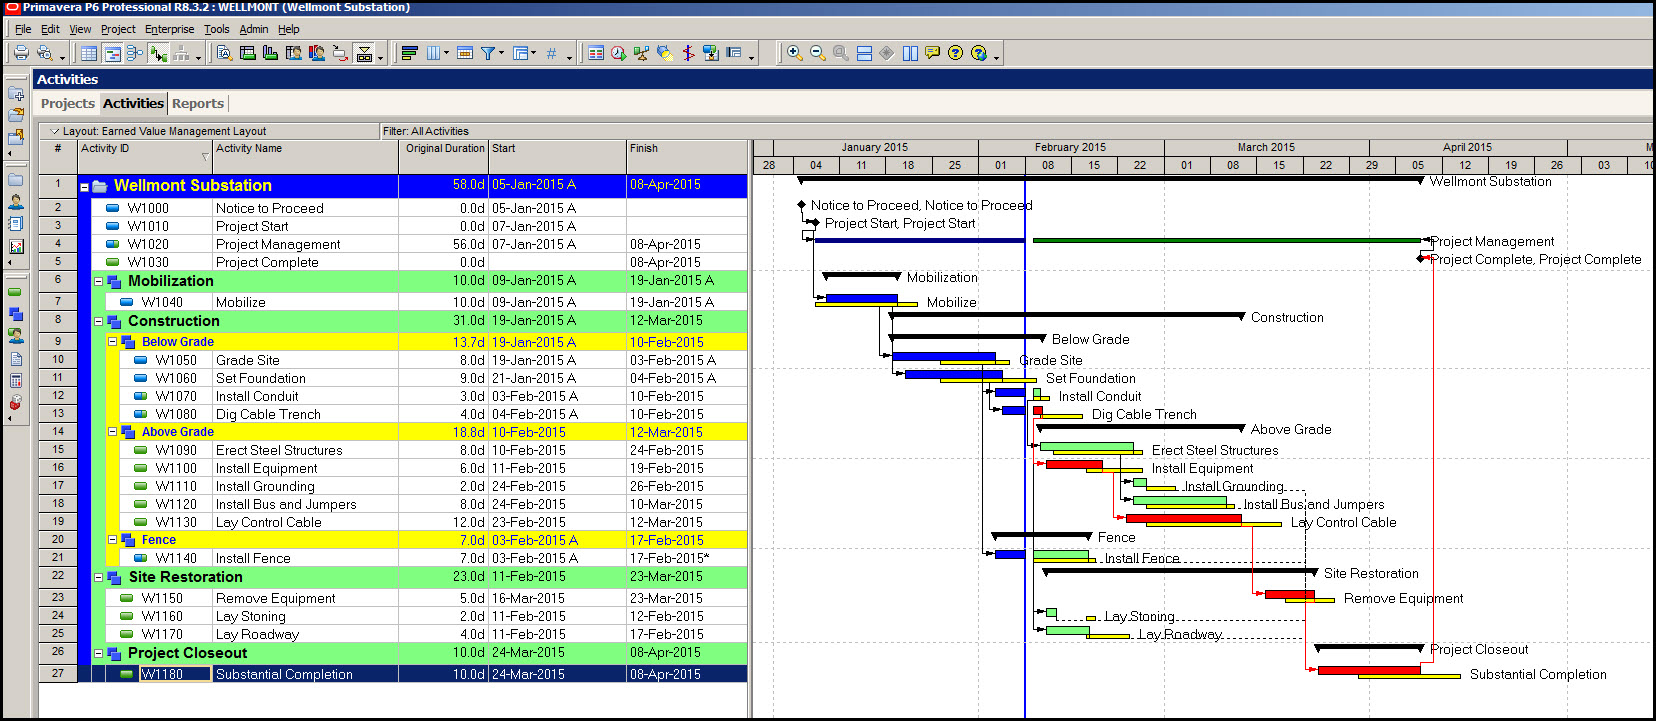 Figure 1
The Gantt chart shows that this schedule has several weeks of schedule updates. To create a report for this schedule, activate the Report Wizard by first selecting the reports icon in the enterprise tool group and second by selecting the +Add button on the far right side of the Reports view.
This brings up the Report Wizard ‘Create or Modify’ Report dialog, Figure 2.
 Figure 2
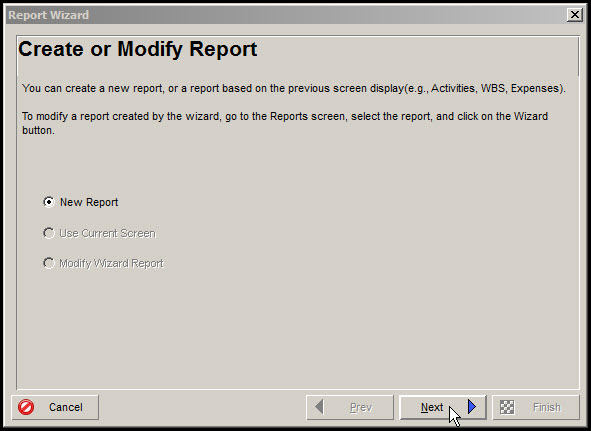
Selecting next brings up the ‘Select Subject Area’ dialog, Figure 3. You can think of subject areas as the Report Wizard’s version of looking at the Activities table, or Projects table: an object that provides columns based on particular attributes of the project data.
Figure 3
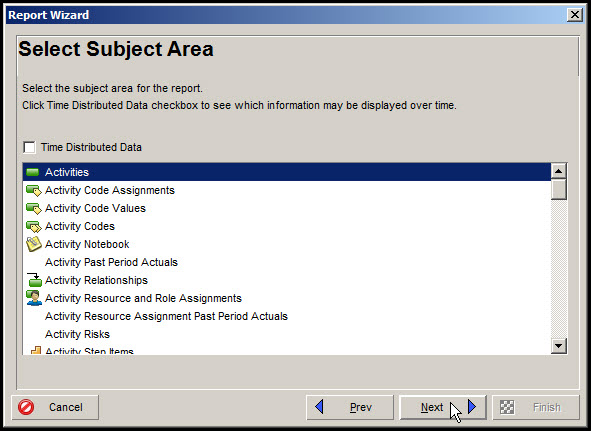
Highlight Activities then select next. The next dialog provides the option to include additional subject areas in the report, Figure 4.
Figure 4
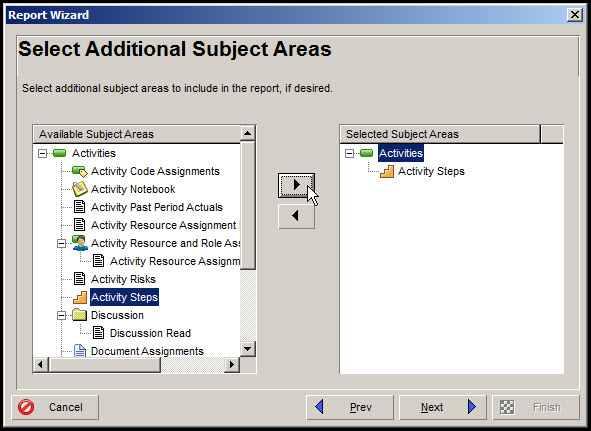
Add Activity Steps as they are defined for the mobilize activity, which is not apparent from viewing the Gantt chart.
Clicking Next brings up the ‘Configure Selected Subject Areas’ dialog. First configure the report columns by selecting the columns button, Figure 5.
Figure 5

Enter all the column options displayed in Figure 6.
Figure 6

This includes actual start and finish and primary baseline start and finish. It also includes Physical % Complete to display the progress of our activity steps and Duration % Complete for the progress of all our other activities. We do not need to specify a group and sort. However, we do want to include a filter as displayed in Figure 7.
Figure 7

This filter will include all ‘In Progress’ or ‘Completed’ activities in the report. The final step is to add a Report Title, Figure 8.
Figure 8

Now you are ready to run the report, Figure 9.
Figure 9
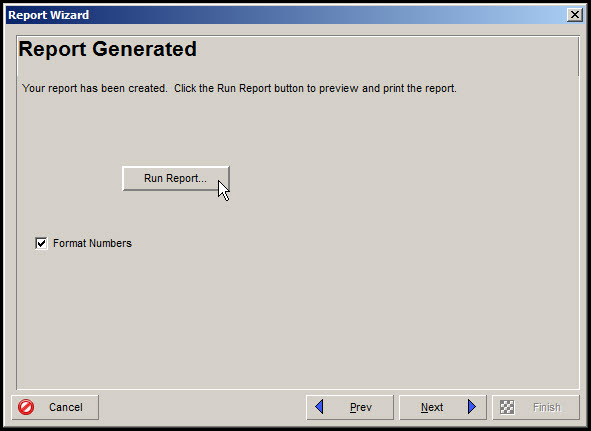
Run the report and select the print preview option.
The outputted report for our example schedule is displayed in Figure 10.
Figure 10
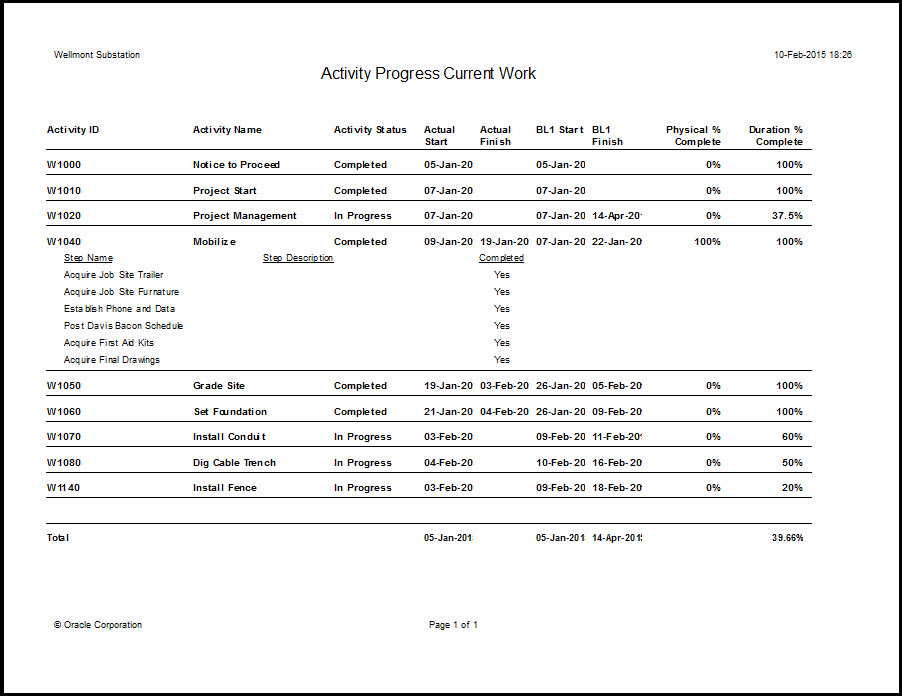
The project management activity, W1020 is 37.5% complete, as displayed in the ‘Duration % Complete’ column. The Mobilize activity actual start was January 9th, and the baseline start (BL1 Start) date was January 7th. Note the individual step names for the Mobilize activity, W1040. All the steps are complete and the ‘Physical % Complete’ for the Mobilize (W1040) activity is 100%.
According to the ‘Duration % Complete’ column Install Conduit (W1070), Dig Cable Trench (W1080), and Install Fence (W1140) are 60%, 50%, and 20% complete, respectively.
Last, note the Total row at the bottom of the page that shows a baseline finish (BL1 Finish) date of April 14th, 2015.
Summary
The Report Wizard in Primavera P6 allows for the inclusion of detailed information about the schedule. This data can be organized in columns, which may then be further sorted and filtered. Both simple and complex filters may be created to display the activities of interest, such as Completed or In Progress activities.
Once created, reports may be edited by the Primavera P6 Report Wizard to make adjustments as appropriate. The P6 Report Wizard includes the options necessary to suit the schedule review needs of program sponsors and upper management.