 P6 Professional can collapse bars to grouping bands and also has the option to show relationship lines for collapsed bars as well. Let’s take a look.
In P6 Professional, you can set the Gantt chart graphics to “show bar[s] when collapsed.” This was demonstrated in our blog post The Collapsed Schedule View In Primavera P6.
However, the collapsed bars in this blog did not show relationship lines. P6 Professional has the Bar Chart Option to “show relationships for collapsed bars” when collapsed to grouping bands.
This article demonstrates a quick tip to display relationship lines for collapsed tasks in Primavera P6 Professional.
Figure 1 shows our demonstration schedule.
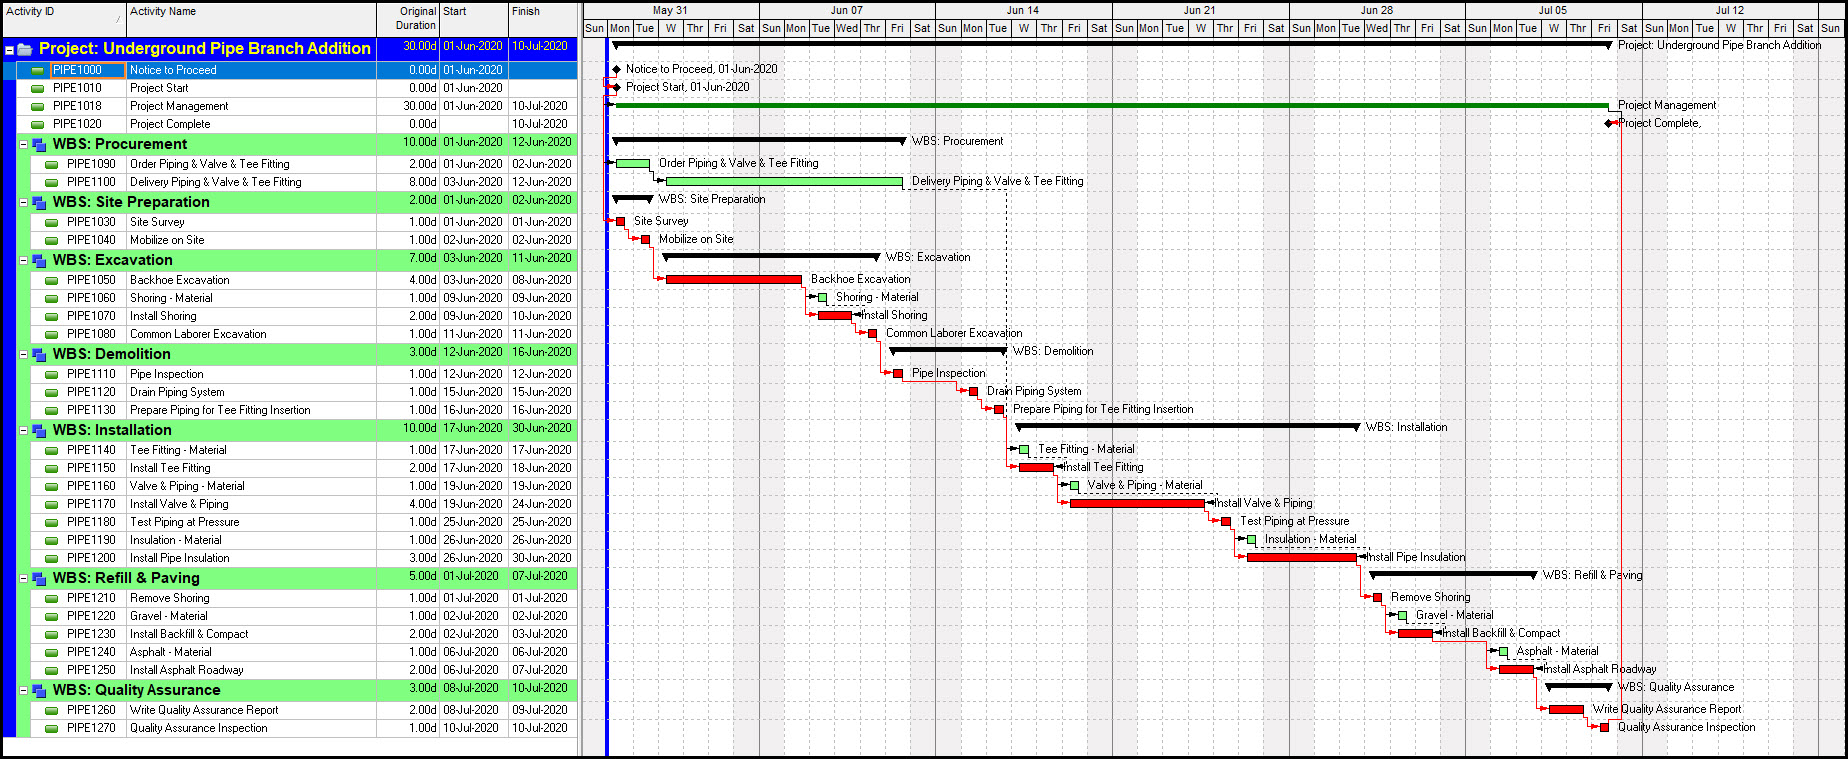 Figure 1
We want to show the bars when collapsed. This is done for each bar definition we want to display after collapsing. In the bars dialogue, Figure 2, we toggle to “show bar when collapsed” for the Remaining Work bar definition.
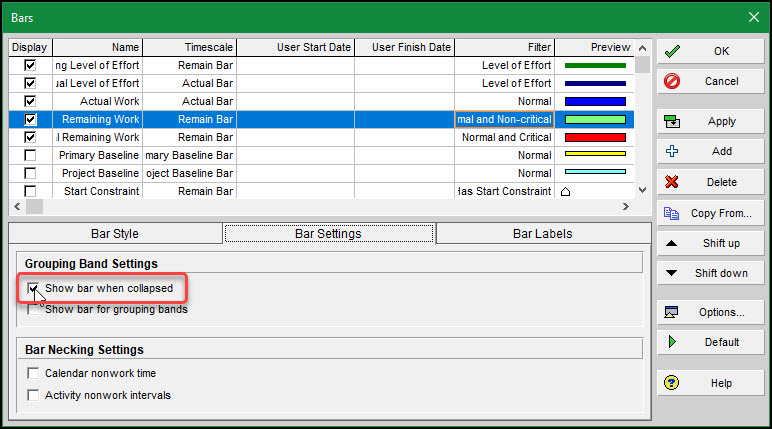 Figure 2
We repeat this for the Critical Remaining Work and Actual Work bar definitions. The Actual Work bar definition comes into play when tasks are progressed. Then we choose View | Collapse To … | Collapse Grouping Bands to WBS Level 2, Figure 3.
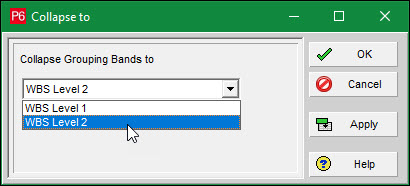 Figure 3
The resulting schedule appears in Figure 4.
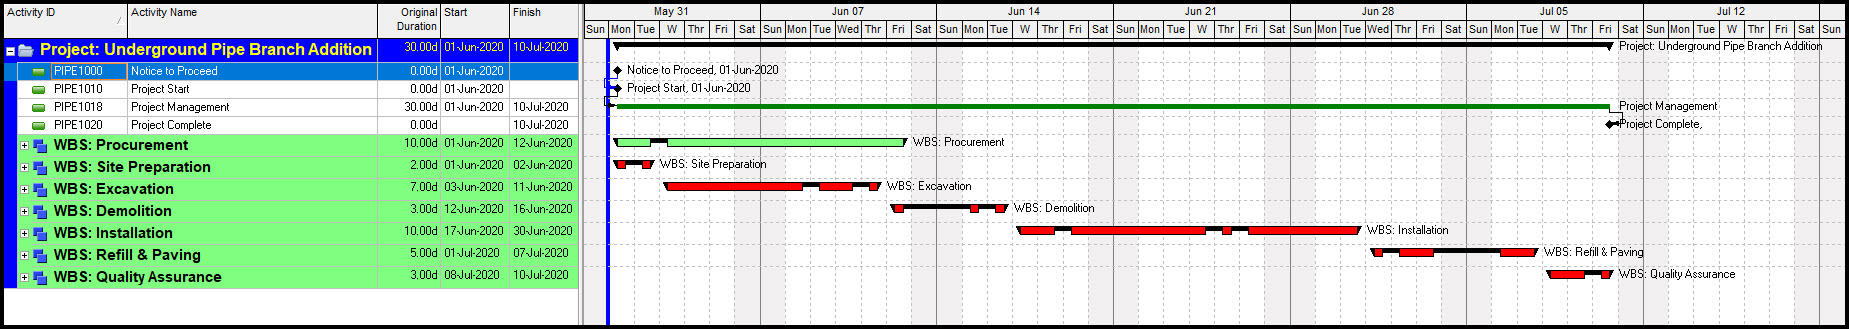 Figure 4
This is good, but we want to clean up the Summary bar graphics. We choose View | Bars, select the summary bar definition, and choose Bar Style. We make the end shapes blank, Figure 5.
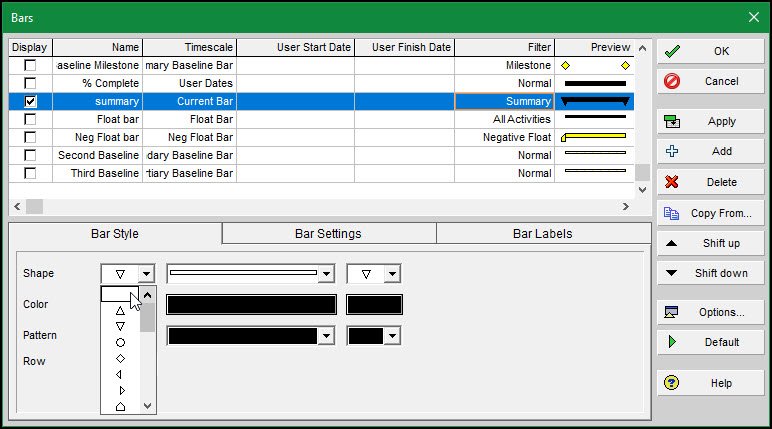 Figure 5
We make the center bar thick, Figure 6.
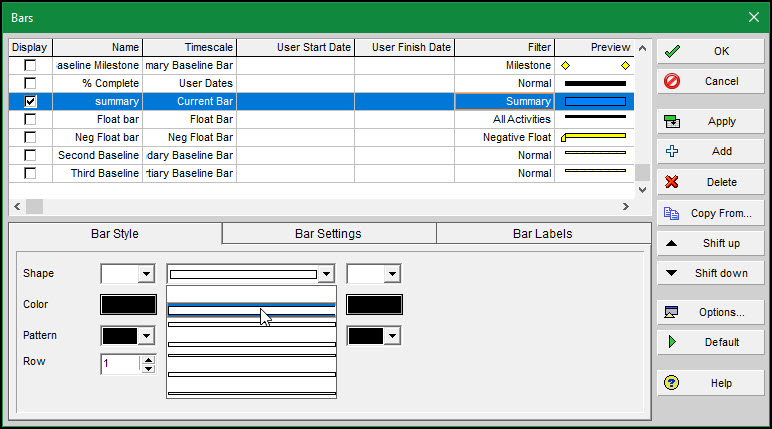 Figure 6
We choose the color medium blue or periwinkle, then OK, Figure 7.
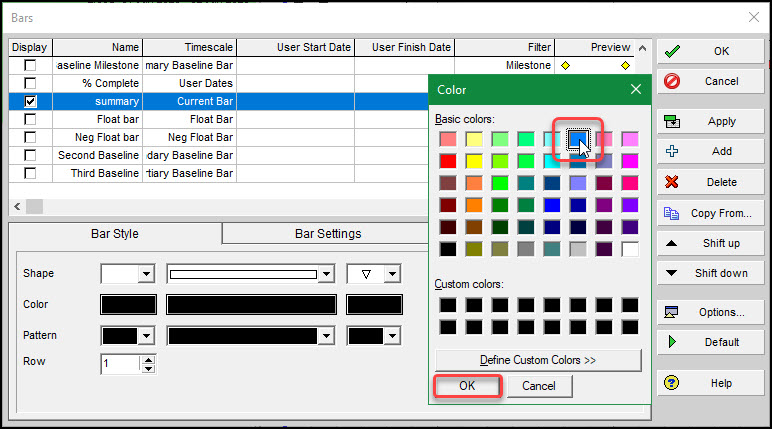 Figure 7
Figure 8 displays the activity table and cleaned-up Gantt chart.
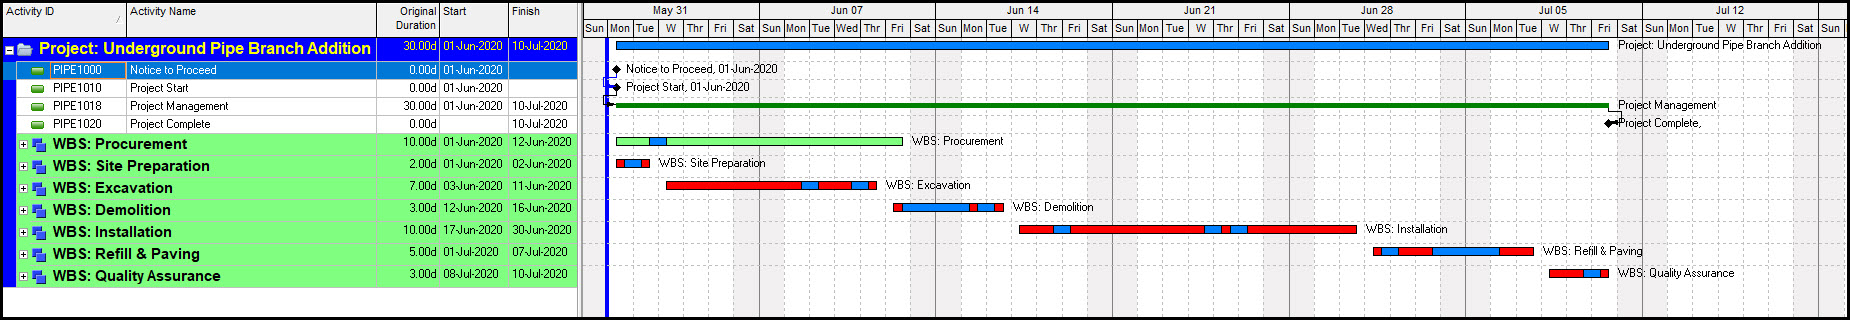 Figure 8
This is a hilltop view of the schedule, but it would be good to include relationship lines so we can trace the network logic. We right-click on the Gantt chart and choose Bar Chart Options … Figure 9.
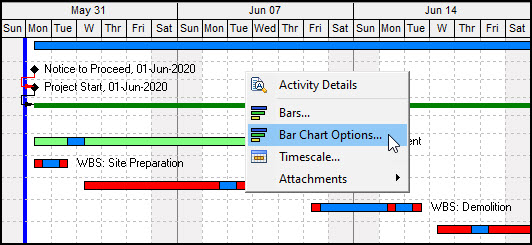 Figure 9
We click the Collapsed Bars tab and toggle “show relationships for collapsed bars” Figure 10.
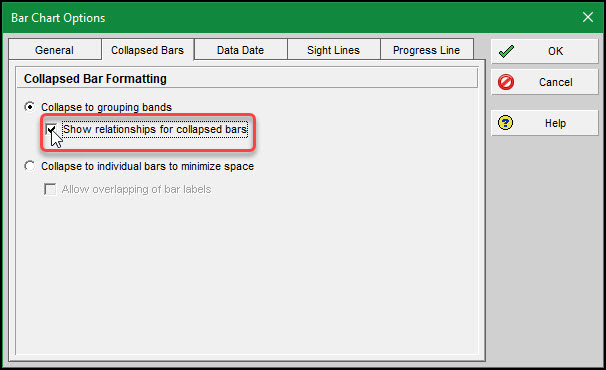 Figure 10
The final Gant chart with relationship links connecting the collapsed bars appears in Figure 11.
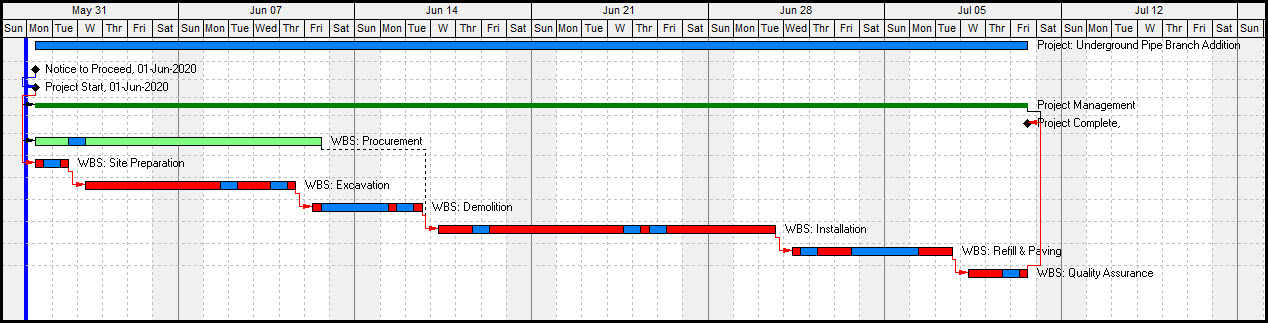 Figure 11
This provides a high-level view of the schedule, including relationship lines. Observe the blue (periwinkle) sections, which are the nonwork intervals.
Summary
A high-level collapsed view of the schedule, showing periods of activity and nonactivity, is possible. Further, to track the network logic on the Gantt chart, toggle the display “relationship lines for collapsed bars” bar chart option. In this way, you display prominent paths through the network logic.