Baselines are important as schedule progress is measured against the baseline. When measuring progress, schedulers will want to pay particular attention to the critical path. It may also be helpful display a P6 critical baseline path for comparison with the critical path after updates.
The critical path of a schedule may change depending on the status update. Primavera P6 Professional supports comparison of the current schedule situation with the original baseline. It is also helpful to monitor progress based on the original critical path baseline. It is possible in Primavera P6 Professional to display red baseline bars indicating the critical path baseline.
This article demonstrates how to filter and color critical path baseline bars in Primavera P6 Professional.
In Figure 1 we have a demonstration schedule.
 Figure 1

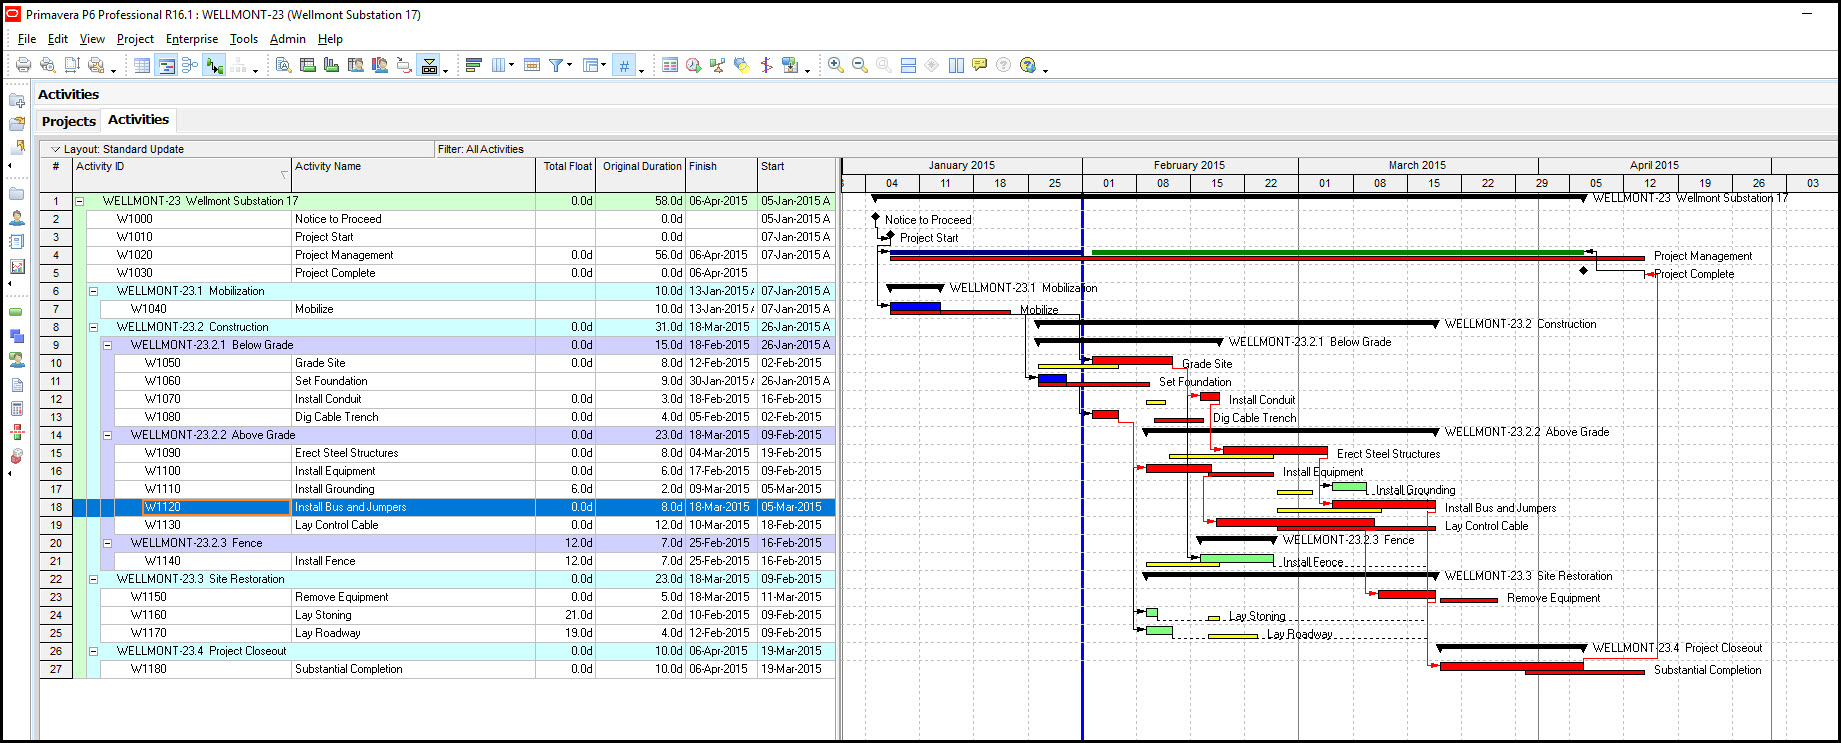
In Figure 2 our demonstration schedule has been progressed one month, January.
Figure 2

Note that the actual progress differs significantly from the baseline, and the critical path changes. It therefore makes sense to highlight the original critical baseline path.
It is possible in Primavera P6 Professional to color red the original project baseline critical path. First we want to create a critical baseline filter, Figure 3.
Figure 3
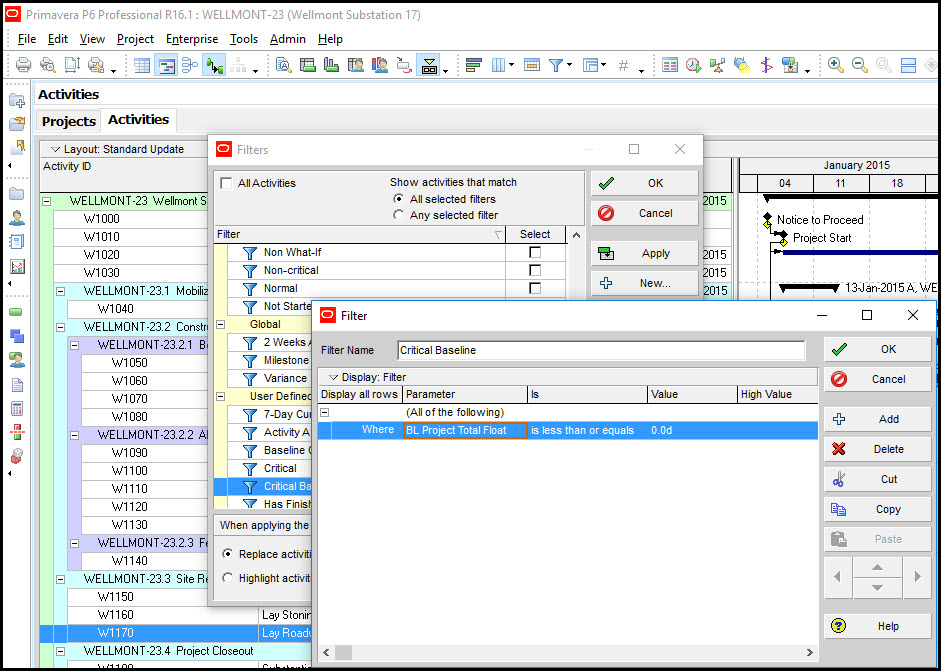
The parameter in the filter is BL Project Total Float, which is the total float of project baseline activities. (Note we could have set the filter parameter to BL1 Total Float, which is the primary baseline total float). We also want to capture all project baseline activities with total float less than or equal to zero.
Next we create a unique Gantt chart bar definition for critical baseline activities, Figure 4.
Figure 4
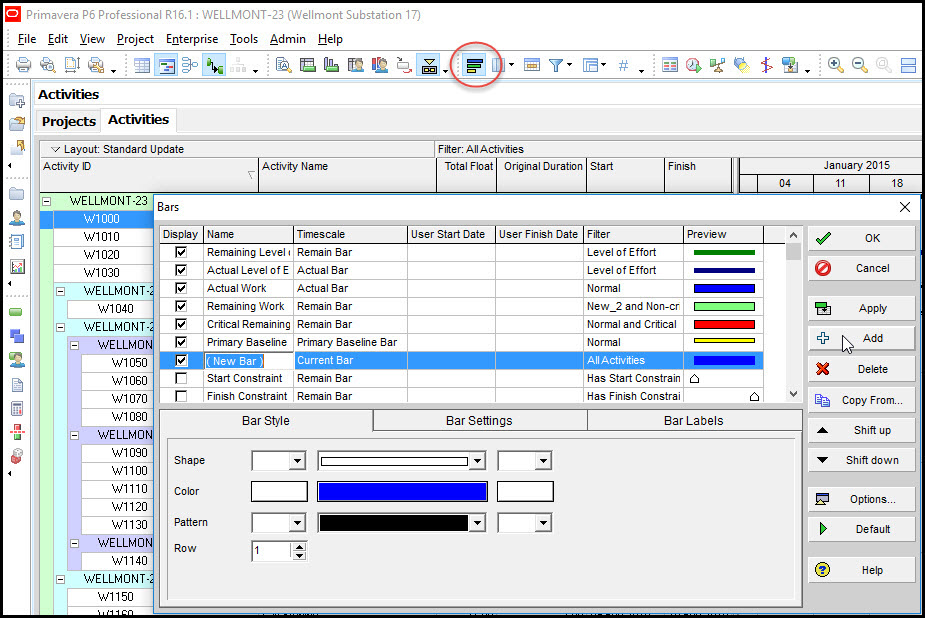
Provide an appropriate name, ‘Critical Baseline’, Figure 5.
Figure 5

Set the timescale to either ‘project baseline bar’ or ‘primary baseline bar’; both will work as the same baseline is assigned to the project baseline and primary baseline. Set the filter to our new ‘critical baseline’ filter, Figure 6. Also, choose the color red and appropriate shape, Figure 6.
Figure 6

The final schedule with critical path baseline is displayed in Figure 7.
Figure 7
Now we can compare the new critical path to the original baseline critical path.
Summary
Schedulers should keep a close eye on the critical path when progressing the schedule. Sometimes schedule updates cause the critical path to shift to other activities. In these situations it is nice to have a Gantt chart displaying the original critical path baseline.
In Primavera P6 Professional it is possible to first create a filter that captures critical path baseline activities, and second associate that filter with a Gantt chart bars definition. Warning, if your critical baseline does not appear you may have the shift your critical baseline bars definition lower in the stack than the primary baseline bar. Where you are in the bars dialog stack makes a difference to how graphics displays on the Gantt chart. Bars lower in the stack are overlaid on top of bars higher in the stack.
If your primary baseline bar is overlaid on top of the critical baseline bar, your critical baseline bar will not appear. Experiment with the bars dialog to familiarize yourself with the effect bars stack position has on the appearance of graphics on your Gantt chart.