 We recently received an inquiry about the P6 Professional Resource Usage Profile not correctly plotting when displaying hourly allocations of a resource. Here’s a look at what was going on.
P6 Professional displays the Gantt chart and resource usage profiles for both Day/Hour and Week/Day timescales. However, the resource usage profile does not always plot correctly when the timescale is Day/Hour.
What happens is that the daily effort for a task congregates all on the first hour. Oracle is aware of this issue and has a built-in solution explained in Doc ID 893916.1 which is titled “Resource Spread Not Displayed Correctly When Setting the Timescale Date Interval to Day/Hour or Day/Shift.
This article demonstrates how to set P6 Professional to properly display a resource usage profile for on a Day/Hour timescale and, further, we show how to add an additional workweek day to eliminate a resource daily and hourly overallocation.
We have in Figure 1, the resource usage profile of a resource assigned to a single ‘install piping’ task.
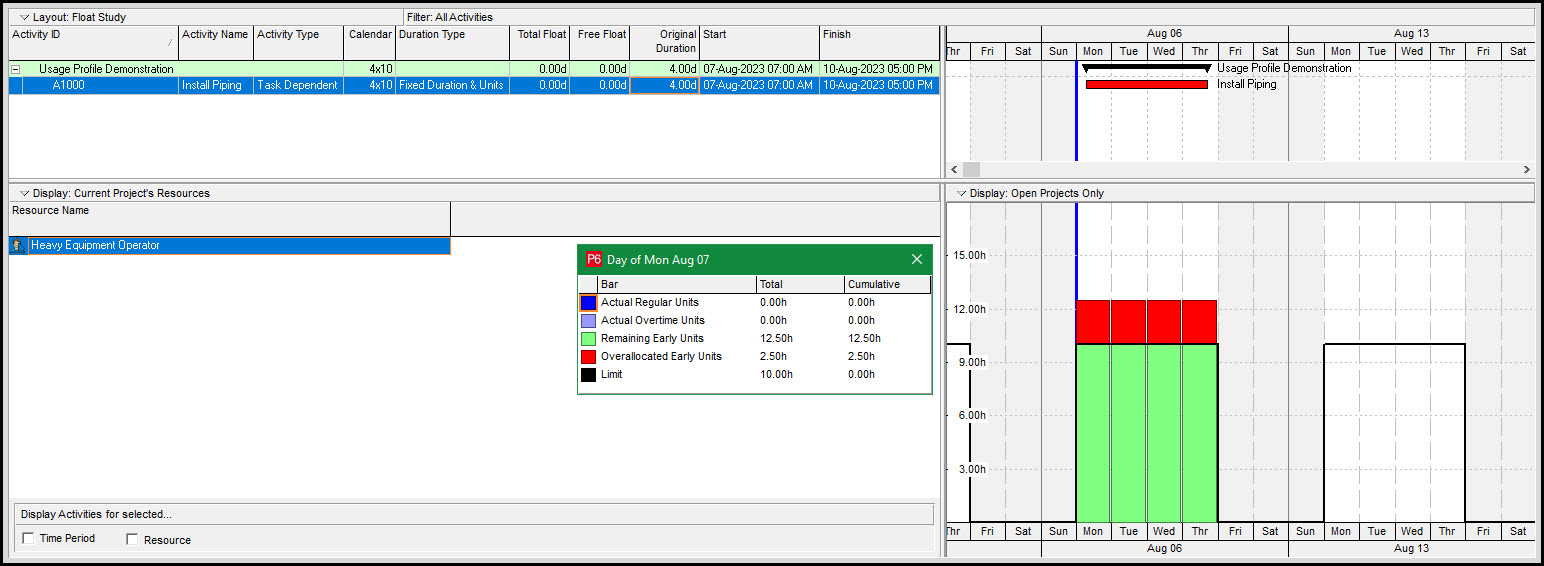 Figure 1
The Heavy Equipment Operator (HEO) resource assigned to this task is overallocated. The workweek is for four 10-hour days, but we scheduled the HEO to work four 12.5-hour days for a total 50-hour workload. We want to review this overallocation on a Day/Hour timescale for another perspective. We change the timescale of the spread to Day/Hour, Figure 2.
 Figure 2
The resulting resource usage profile displays in Figure 3.
 Figure 3
According to the histogram, all the work for the day takes place at interval zero. None of the work happens during the allotted 7-am through 4-pm workday, which is wrong. The reason for this issue is that we need to adjust the user preferences | resource analysis – interval for time-distributed calculations from Day to Hour, Figure 4.
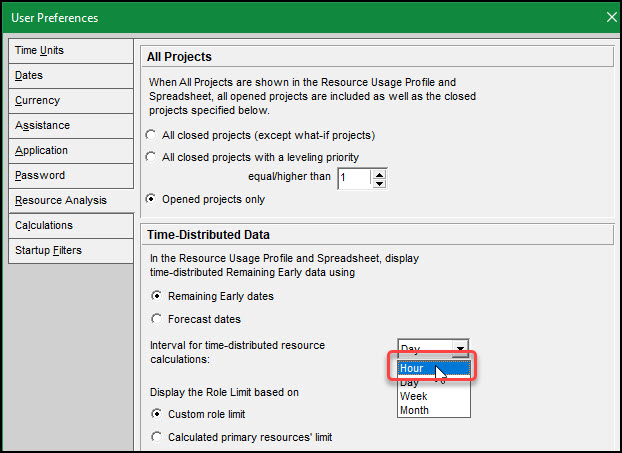 Figure 4
When we adjust the interval from Day to Hour a popup dialogue appears, Figure 5.
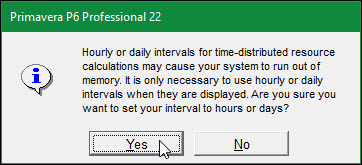 Figure 5
This dialogue explains why the user preference | resource analysis default is not set to Hourly. Because the Hourly intervals for time-distributed resource calculations may cause your system to run out of memory. To avoid memory problems the default is Day and not Hour. Setting the user preference | resource analysis to Day and upon exiting the user preferences the HEO spread plots in Figure 6.
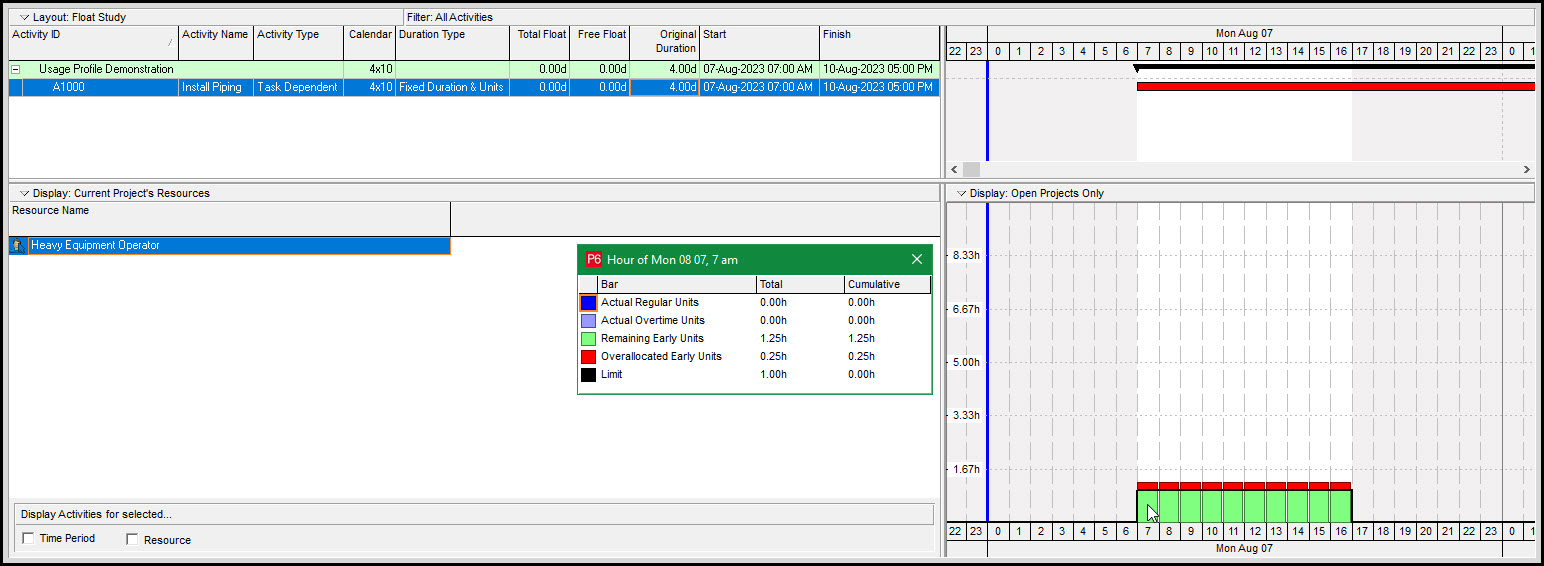 Figure 6
The plot in Figure 6 is a proper histogram.
The HEO is overallocated 0.25-hours every hour, Figure 6. Let us demonstrate how to schedule the HEO to work an additional day on Friday to eliminate this overallocation. In Figure 7, we change the timescale back again to Week/Day.
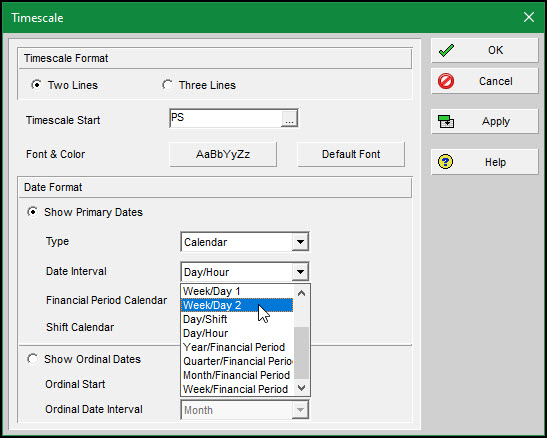 Figure 7
The HEO plot spread displays in Figure 8 for a Week/Day timescale.
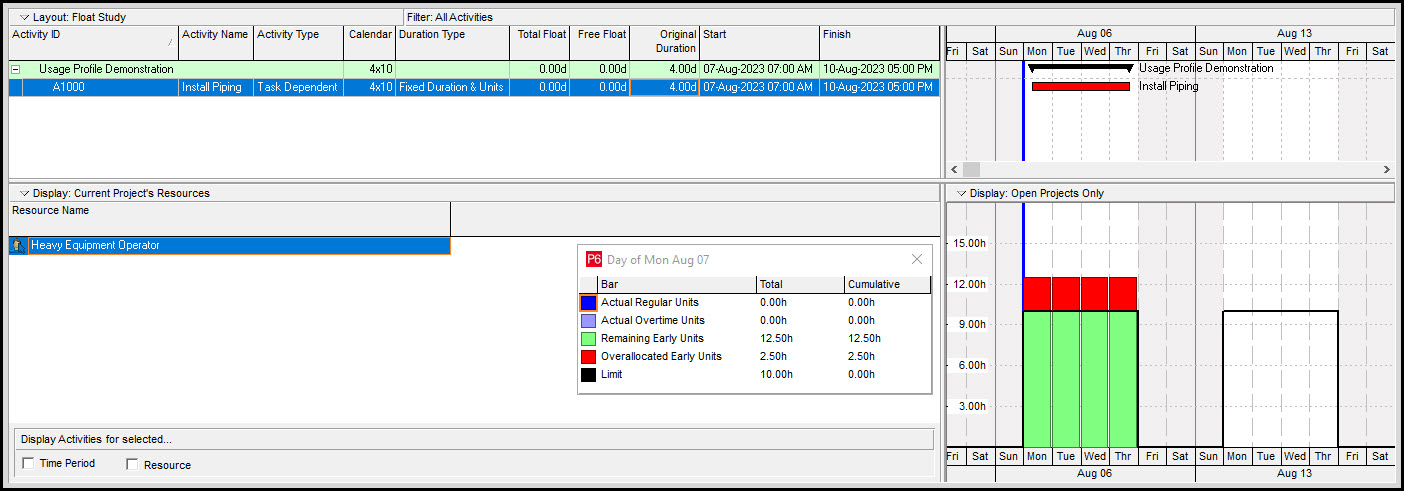 Figure 8
We need to include an exception day to work on Friday, August 11th. Let us continue and modify our four-day workweek, Figure 9.
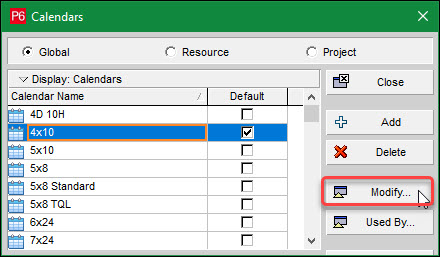 Figure 9
In Figure 10 we make Friday August 11th, 2023, a workday.
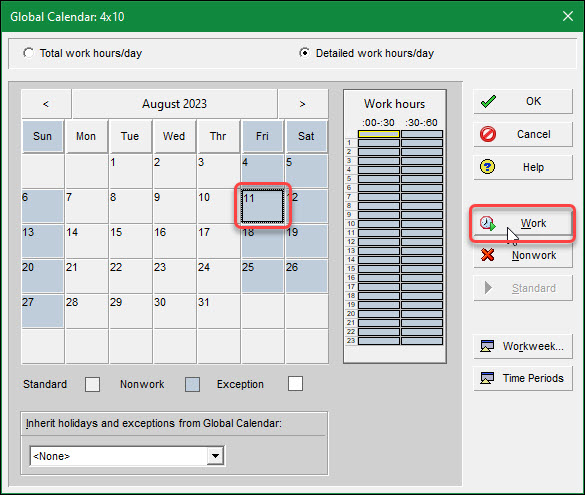 Figure 10
Friday August 11th becomes an exception day in Figure 11, but it defaults to an 8-hour day, which does not work for our 10-hour a day workweek.
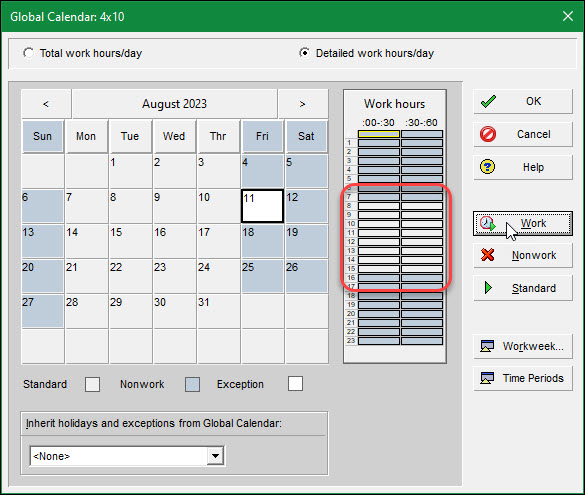 Figure 11
We correct this issue by adding half hour work times between 7 and 8-am and 3 and 4-pm, Figure 12 (yellow highlights), again, Figure 12.
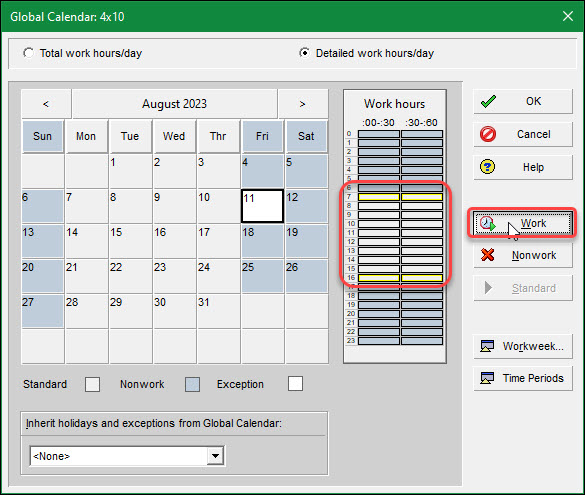 Figure 12
Now when we plot the histogram, Figure 13, Friday is included as a full 10-hour workday. Observe the black limit line.
 Figure 13
(Note that the original duration of the ‘install pipe’ task is 4-days, Figure 13.) Friday, however, is not currently utilized for our HEO. The reason is that currently the HEO ‘Install Piping’ effort is for four days at 12.5-hour per day.
The duration type is set to ‘fixed duration and units’. (Note the duration type determines how P6 recalculates units, duration, and units/time when adding or removing multiple resource assignments on activities.) This means that the duration and units (or work) stay fixed unless we individually adjust them.
If we manually change the duration the budget remains constant, and the changing variable becomes units/time (or daily effort). So instead of doing the 50-hours workload in four days the HEO does 50-hours work in five days. The daily effort, therefore, reduces from 12.5-hours per day down to 10-hours per day, which is what we want.
Proceeding in Figure 14, we extend the duration of ‘install piping’ to five days.
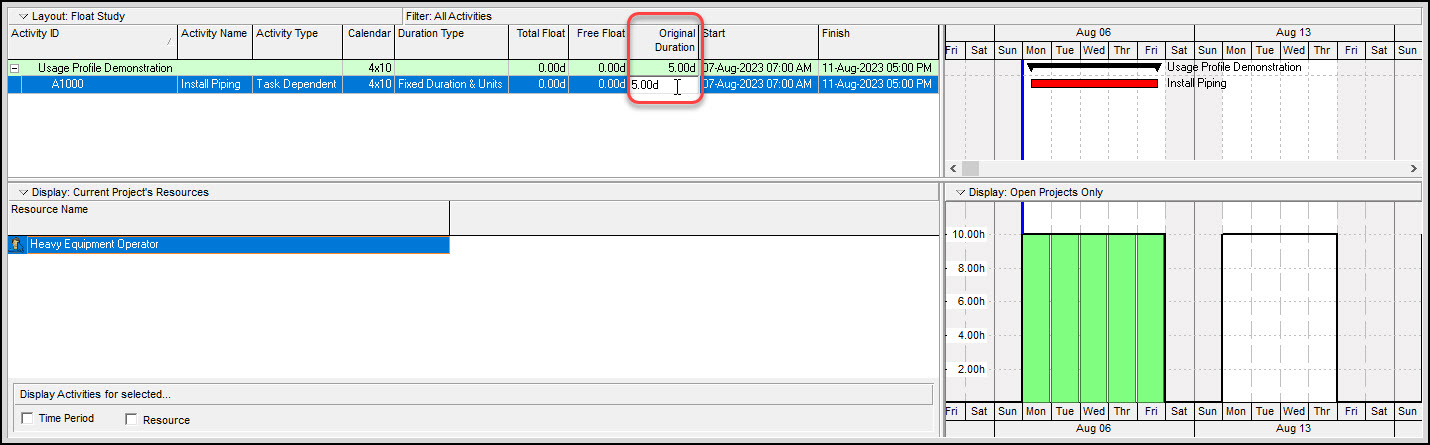 Figure 14
Observe that our HEO is perfectly allocated, and our plan is to complete the ‘install piping’ effort in five days working 10-hours each day. To see this time distribution on an hourly basis we adjust the date interval to Day/Hour, Figure 15.
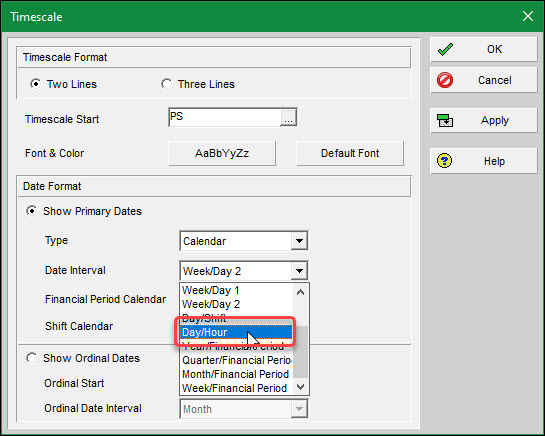 Figure 15
The final spread on an hourly timescale displays in Figure 16.
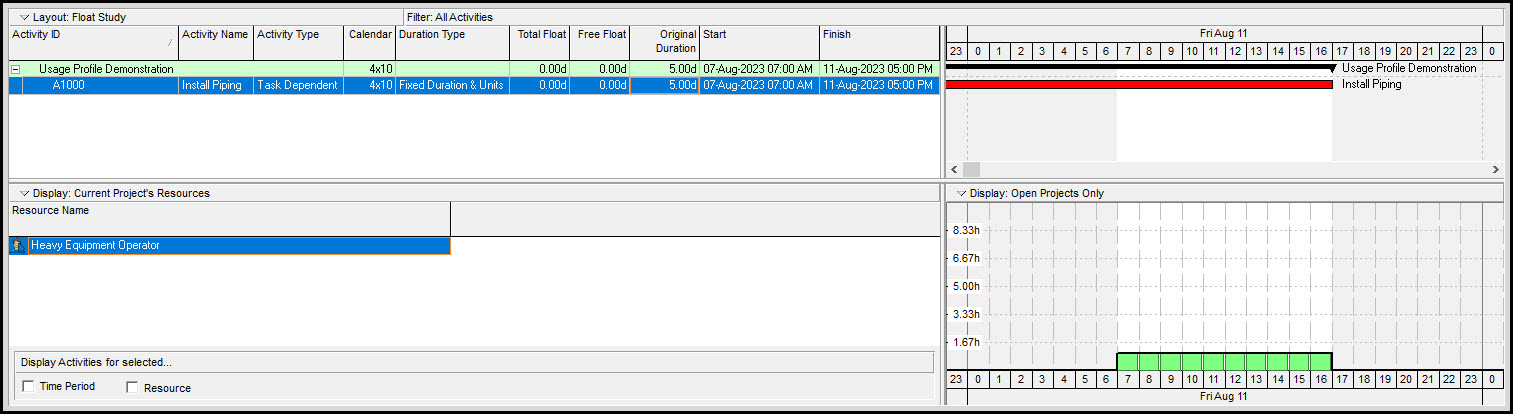 Figure 16
So, the plots for both the Week/Day and Day/Hour agree and provide confirmation that the Friday exception day suffices to fill the gap and meet the schedule resource allocation requirements.
Summary
P6 Professional can display the resource usage profile on an hourly basis, but to conserve computer memory, hourly is not the default. If the timescale is set to Day/Hour and the user preferences | resource analysis interval for time-distributed resource calculation is set to Day, P6 erroneously lumps the entire workday on a single interval.
You can correct this issue simply by adjusting the interval for time-distributed resource calculations down to Hour. In this way you display the work histogram on an hourly basis and can better strategize the workload spread.