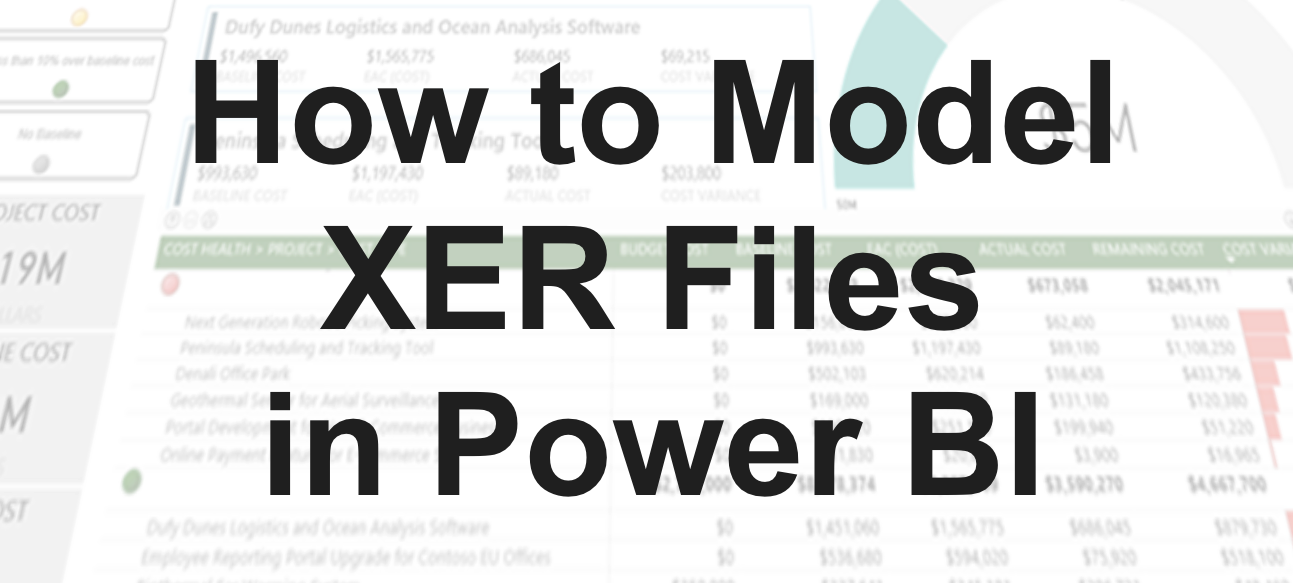
 If you’re new to Power BI and working with Primavera P6’s XER files, then this blog post is for you. We’ll walk through the basic steps of modeling XER files in Power BI, focusing on connecting tables and extracting essential metrics.
What is an XER File?
An XER file acts as a snapshot of the production database of P6, capturing detailed project information such as tasks, schedules, resources and other project planning elements. This format is particularly useful for sharing project data across different systems or with users who may not have direct access to the Primavera P6 environment. The versatility of XER files makes them a standard choice for backing up, transferring and collaborative reviewing of project plans in various stages of development.
Step 1: Preparing Your XER File
Before diving into Power BI, ensure your XER file from Primavera P6 is ready. This file contains crucial project management data like tasks, resources, and timelines. If you don’t have Primavera P6, consider using a converter tool to change the XER file into a CSV format for easier handling in Power BI.
 Step 2: Importing Data into Power BI
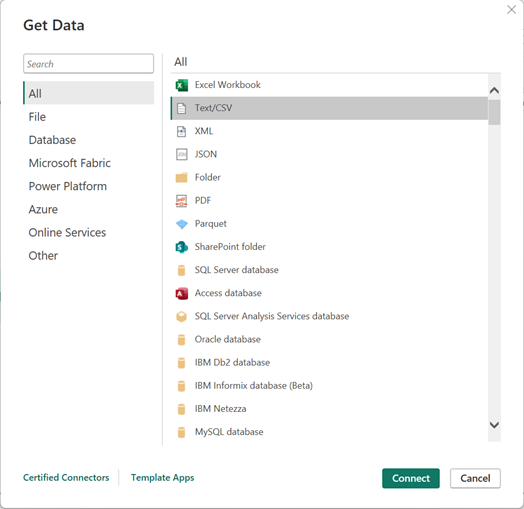
Open Power BI and begin by importing your XER or converted CSV file. Go to ‘Get Data’ and select text-based file. Once loaded, Power BI will display the data tables available in the file.
Understanding Tables in XER Files
The number of tables in an XER file, which is a data export from Primavera P6, can vary depending on the complexity of the project and the specific data included in the export. Generally, an XER file can contain dozens of tables, each representing different aspects of project data such as tasks, resources, calendars, project details and more.
Common tables in an XER file include:
- Project details
- WBS (Work Breakdown Structure)
- Activities
- Resources
- Resource assignments
- Calendars
- Relationships (dependencies between activities)
- Activity codes
- Resource codes
- Baselines
- Costs
Each XER file will need to be denormalized (or broken up in to many tables). One way, is with the filtering line below in M code that is used in the Power Query editor. Each XER will have a column that has the value %T when it is a table title.
Here you can see I am isolating all the information for the Project table. This line obviously works for the other tables as well but you just need to change the table name from Project to the table you are trying to get from the xer file.
= Table.SelectRows(Source, each ([#”Table “] = “PROJECT”) and ([Column1] <> “%T”))
The exact number and type of tables can differ based on the project’s requirements, the data exported from Primavera P6 and the version of the software. For a precise count and details of the tables in a specific XER file, you would typically use Primavera P6 or a compatible viewer that can interpret and display the contents of the XER file.
Note that all relationships are one to many
Step 3: Establishing Table Relationships
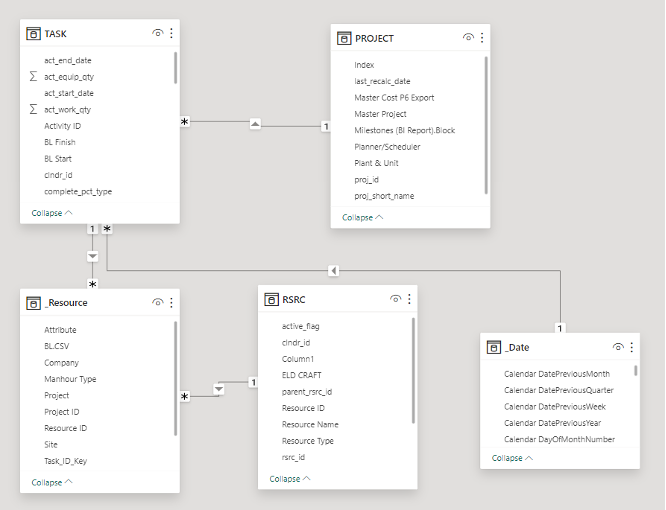
After loading your data, navigate to the ‘Model’ view in Power BI. Here, you’ll create relationships between tables:
Link TASK to ASSIGNMENT: Connect the Task ID in the TASK table to the corresponding Task ID in the ASSIGNMENT table. This connection is crucial for understanding resource allocation to tasks.
Link Project to Task. You can do this on the Proj_ID. Each Project will have multiples tasks assigned to it.
Link ASSIGNMENT to RESOURCE: Connect the Resource ID in the ASSIGNMENT table to the Resource ID in the RESOURCE table. This shows which resources are used for which tasks.
Creating these relationships allows Power BI to accurately analyze and display data across tables.
A quick note on One-to-Many Relationships
In Power BI, a “one-to-many” relationship refers to a type of connection between two tables where a single record in one table (the “one” side) can relate to one or more records in another table (the “many” side). This is a common scenario in data modeling, especially when dealing with relational databases.
Note that you do not want to have a lot of many to many relationships (or really any at all) in a good model.
Step 4: Focusing on Key Metrics
With your tables connected, you can now focus on extracting key metrics. These might include:
Task Durations: Calculate the duration of tasks using the Start and Finish dates in the TASK table.
Resource Allocation: Analyze how resources are allocated across tasks using the ASSIGNMENT and RESOURCE tables.
Project Timeline: Utilize the PROJECT table to understand the overall timeline and milestones.
Step 5: Visualizing the Data
Power BI excels in data visualization.
- Use the ‘Report’ view to create charts and graphs:
- Create a Gantt chart to visualize task durations and dependencies.
- Use bar charts to show resource allocation.
- Develop a timeline or milestone chart from the PROJECT table data.
Conclusion
Modeling XER files in Power BI can initially seem daunting, but by understanding the basic table structure and relationships, you can effectively visualize project management data. Start with simple connections and gradually explore more complex metrics as you become more comfortable with Power BI.