 Create a Plan on a Page
Have you ever needed to explain the whole project to someone? A detailed Oracle Primavera P6 schedule, with its many lines and dependencies, isn’t the best way to communicate the big picture. If you want to show stakeholders the overall journey, a plan on a page is a good tool to do that.
The idea of a plan on a page is common in many sectors. It’s a way of visualizing your whole project on a single sheet, often a slide. You don’t use that plan to manage the day-to-day work of the project – how could you? It is not in any way detailed enough to use for monitoring and controlling the work but it does serve as a communication vehicle to help show major phases and milestones during the duration.
Here’s how to create a plan on a page.
Step 1: Get the data
While we talk about this artifact being a plan on a page, actually it’s a project management schedule, to use the correct terminology. You are creating a visual roadmap; a representation of your detailed plan.
The data required to go into the plan includes the major steps or phases, key dates, decision points and governance points, delivery milestones and anything else you feel would help tell the story of the project at high level.
If you already have a detailed schedule in Microsoft Project or an equivalent tool, that will provide the data for the plan on a page. If you don’t yet have a detailed schedule, the plan on a page can act as a starting point for collating the large, immovable milestones and the broad phases of work.
You can collect this information either from existing project schedules, the business case or initiation document, or by holding planning workshops with key stakeholders.
Step 2: Select the content
In our experience, there is often too much data available for the plan on a page. If you include everything, the diagram ends up looking cluttered. Given that the point of consolidating your schedule is to create a smart, easy-to-understand roadmap, clutter should be avoided.
Make decisions about what to include. For example, you might keep in one governance milestone but not mention the others as they are more routine. You might mention the start and end of user testing but not other kinds of software testing. You might include dates when machinery is due on site because it helps draw attention to those key dependencies and assumptions.
Step 3: Create a template
Next, create a template to display your data. You may be able to pull a summary plan out of your enterprise project management tools. However, we often see people use the detailed schedule and work breakdown structure as a way of informing what goes on to a single slide.
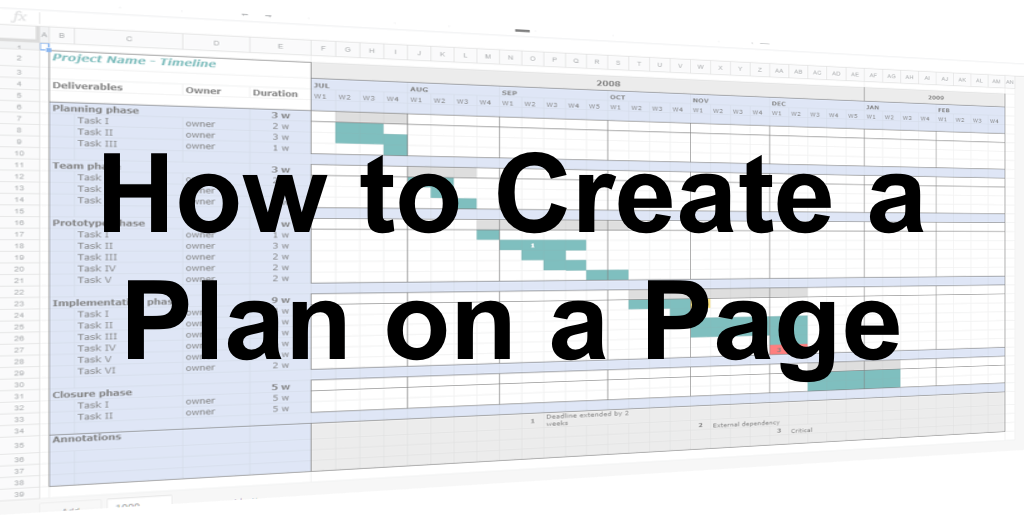
A common template shows the timeframe across the top, often in months, and workstreams or key themes down the side. Bars show the work, with the name of the phase or activity written on them. Like a traditional Gantt chart, diamond shapes can be used to mark milestones, with arrows and text boxes adding more context as required.
This gives you a basic, manually-created Gantt chart. There are online tools you can use to create roadmaps. You may find the PMO has a set standard for this kind of graphic to save you the effort of creating a template from scratch.
Step 4: Populate the template
Now you have the data and the format in which to present it, take some time to put the items into the template. Align boxes, use colors and add explanatory text as required.
Remember, the goal is to get the whole project outline on to a single page as a communication tool, so it does not have to be detailed or even perfect. If a task is due to take place on 15 December, it is fine to show it on the slide as happening in the early part of the month. Unless your timeline is showing days instead of months, it will be difficult to get boxes and text in the perfect location. As long as it is good enough to show the broad journey and key steps, then it will serve its purpose as a plan on a page.
Step 5: Share for feedback
Finally, share your finished page with stakeholders. See what they think of it. We know of projects where the final document was shared and the sponsor suddenly started to realize the immense nature of what was being undertaken – don’t underestimate how powerful it can be to show someone a roadmap that is basically a few blocks and arrows on a page.
Ask for feedback on how useful it is and what else should be included. You don’t want to spend hours tweaking and perfecting something that is not the equivalent of a detailed project schedule, but if it helps for stakeholder engagement to show slightly different items or to structure things in a different way, then take that feedback on board.
How to use the plan on the page
As a communication tool, your new plan has many uses. For example:
- Use as a summary slide at the beginning of presentations to show what the project is setting out to do
- Include in your project reporting
- Draw a line down the plan to mark today as a quick way of showing what has happened to date and what is still to come
- Share with new starters, vendors or stakeholders as they join the project team as part of their onboarding.
As we’ve said, this kind of plan will never replace the detailed project scheduling, monitoring and control you do as a project manager. However, it can be a useful part of your communications planning and stakeholder engagement. Will you try it?