 I received a recent question: how do you display the government fiscal year (GFY) calendar on the Gantt chart timescale in Primavera P6 Professional? Yes, this is possible, so let’s take a look at how you can do it.
In this example, we want our P6 Professional Gantt Gant chart to display both the federal Government Financial Year (GFY) in quarters and the standard Gregorian calendar. The US Federal government’s fiscal year begins October 1st and not January 1st. This adds an interesting element to the request, because this means that October 1st, 2024, on the Gregorian calendar equates to October 1st, 2025, for the federal government’s fiscal year calendar. Fortunately, P6 Professional can display the Gregorian calendar and the offset federal GFY calendar on the same timescale for comparison.
This article demonstrates a how-to quick tip to display the US federal GFY calendar offset from and alongside the Gregorian calendar and both on the same P6 Professional Gantt chart timescale.
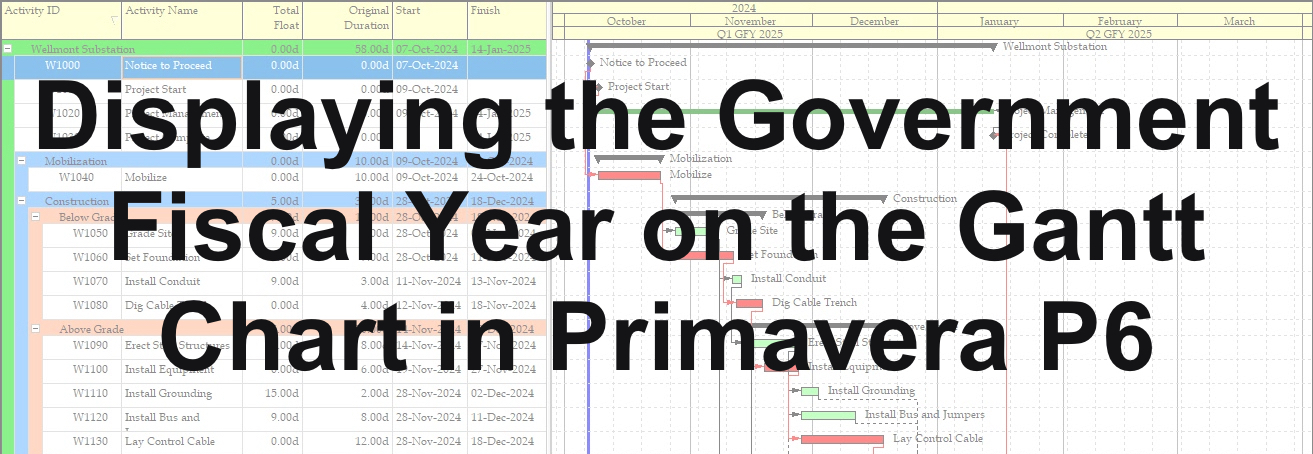
In Figure 1 we have our demonstration project schedule.
 Figure 1
This project begins October 7th, 2024. Currently, the timescale on the Gantt chart displays the Gregorian calendar. In addition to the Gregorian calendar, we want the US federal GFY calendar shown on the Gantt chart timescale.
To achieve our desired dual-purpose timescale, we must first generate financial periods reflecting the offset GFY. Proceed and choose Admin | Financial Periods…, Figure 2.
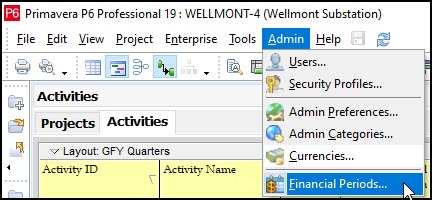 Figure 2
In the Financial Periods dialog, Figure 3, we set the Batch Start Date to 01-Oct-2024 and the Batch Finish Date to 30-Sep-2025, reflecting the US federal GFY, 2025.
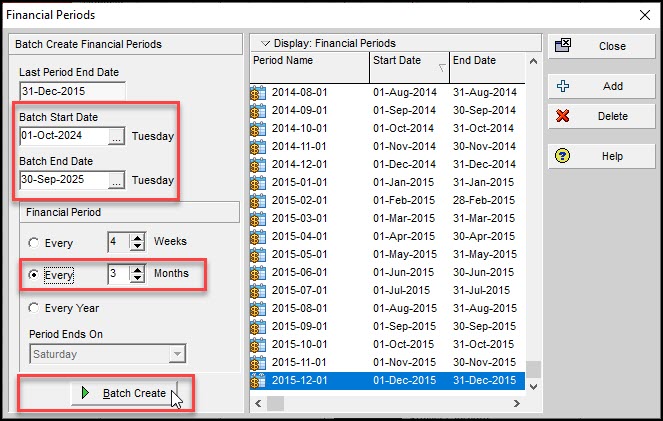 Figure 3
Note that the Financial Period is toggled to 3-month periods, Figure 3. We continue in Figure 3 and click Batch Create. A dialogue appears and asks you to confirm your intention to create the financial periods, Figure 4.
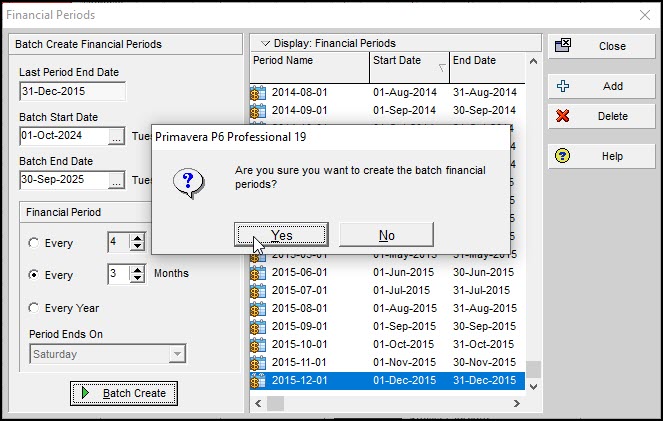 Figure 4
Click OK, and if the Batch Create was successful you will receive the respective dialogue, Figure 5.
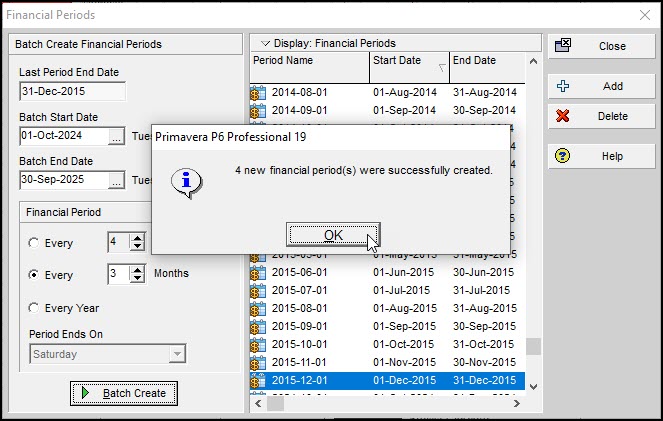 Figure 5
Click OK, again, Figure 5. Now we need to edit the Period Name for each period to reflect the federal GFY nomenclature, Figure 6.
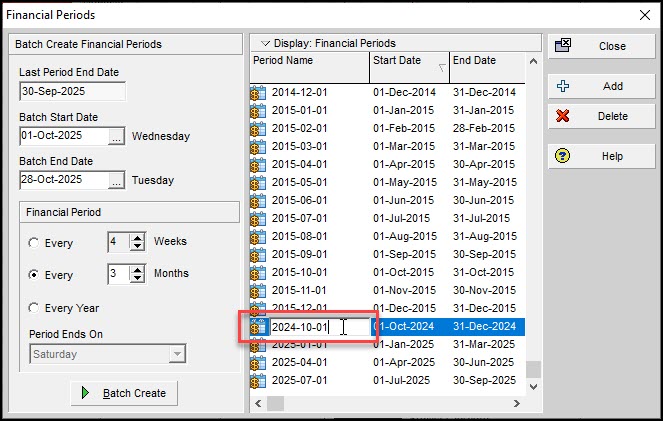 Figure 6
Type in your preferred labeling for the GFY labeling, Figure 7.
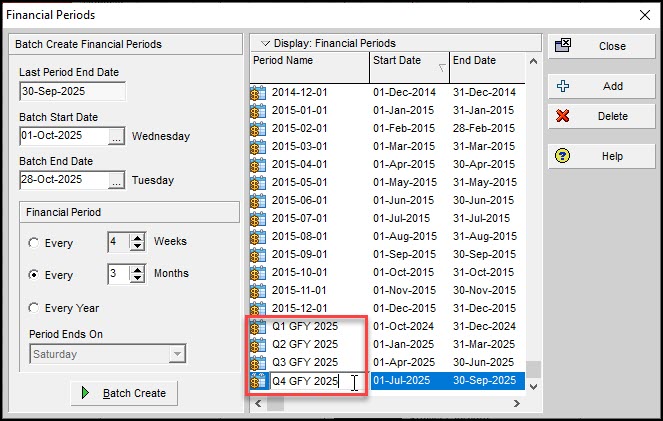 Figure 7
Great! Now we are ready to set our schedule’s timescale. Right click on the Gantt chart and choose Timescale… from the popup menu, Figure 8.
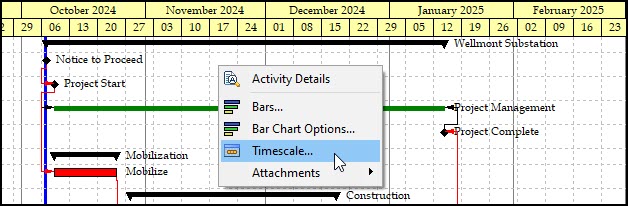 Figure 8
In the Date Format frame of the Timescale dialog choose the Type Calendar and Date Interval ‘Month/Financial Period’, Figure 9.
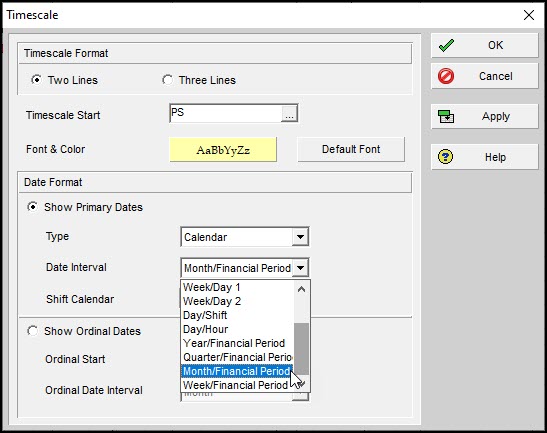 Figure 9
Click OK, and the Gantt chart time scale appears as in Figure 10.
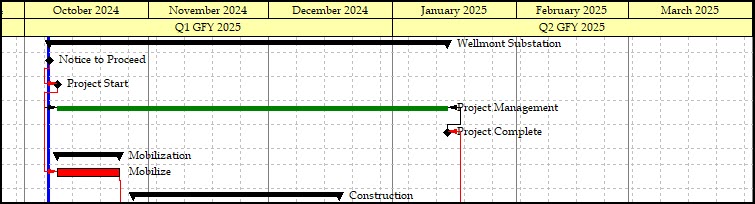 Figure 10
We could also choose the Timescale Format to have the timescale display three lines, Figure 11.
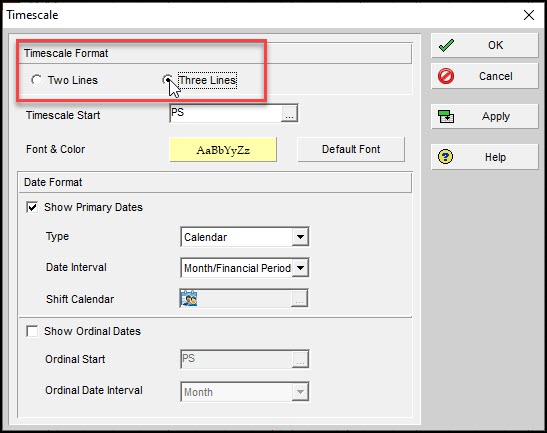 Figure 11
The timescale plots like Figure 12.
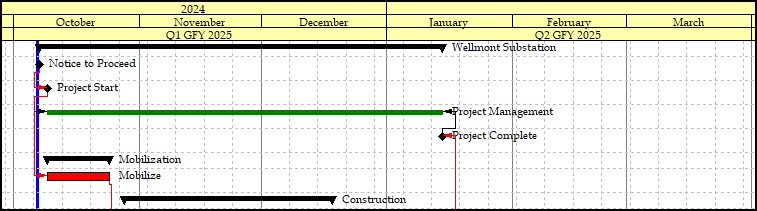 Figure 12
Our final demonstration schedule displays in Figure 13.
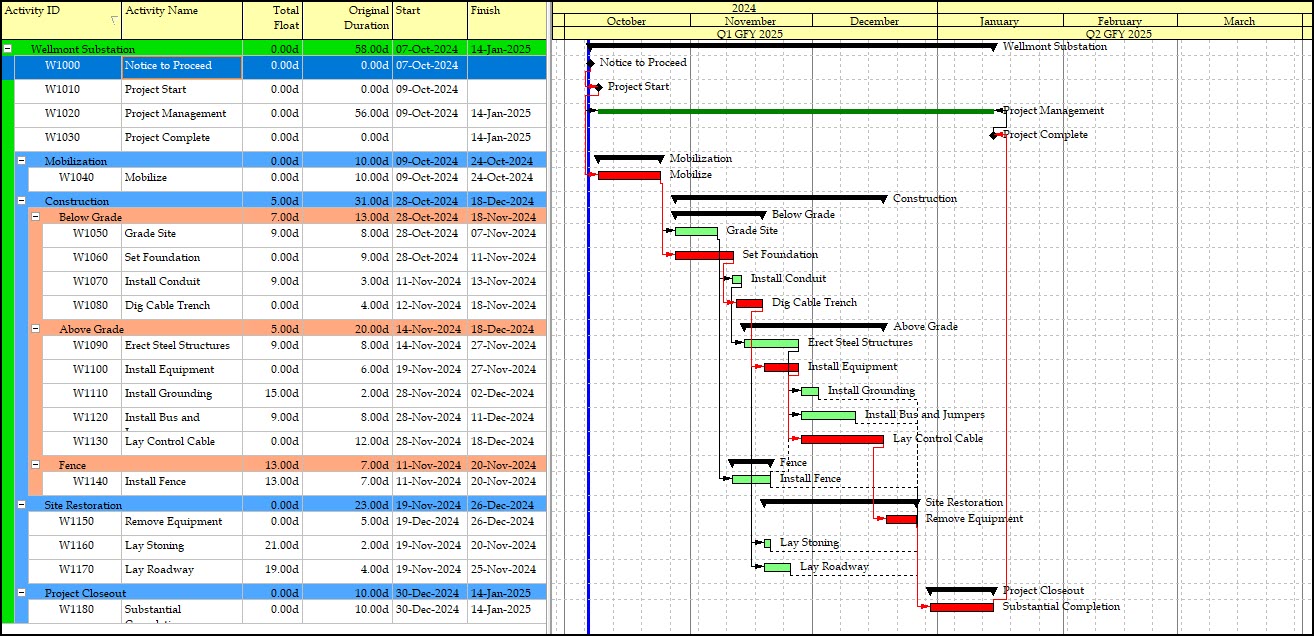 Figure 13
And now that you have financial periods defined you can choose Tools | Store Period Performance… to record actuals for the selected financial period along with earned value and planned value. In this way you can track previous periods and compare current and future trends.
Summary
The Gantt chart is like the heart and soul of the scheduling software, so the more you understand how the P6 Professional graphics of the Gantt chart works, the better. The Federal government has its own offset fiscal calendar for budget reporting. Comparing the federal GFY to the Gregorian calendar helps orient stakeholders on the current budget situation. So, the ability to plot the GFY calendar alongside the Gregorian calendar is a huge help.
The key step in Primavera P6 Professional, is to batch create financial periods for your fiscal calendar then rename the Period Name to label and identify the financial period with the federal Government Fiscal Year and respective quarters. And, having created the financial periods, you can then tap into the P6 Store Period Performance feature to track actuals, earned value, and planned value. And investigate trends.