 We were recently asked how P6 Professional can display two Gantt charts side by side. Let’s take a look at how to do this.
In P6 Professional, it is possible to open multiple projects simultaneously and display their activity tables and Gantt charts. P6 orients the schedules on the display by listing them by Project ID and in ascending order from the top of the screen to the bottom.
So, it is a simple matter of vertically displaying Gantt charts one above or below the other. However, our inquirer wanted to display two Gantt charts side by side, horizontally. This is more involved and requires a little ingenuity.
This P6 Professional article demonstrates how to display two Gantt charts side by side on the display.
We begin by selecting the first project, Pipe Repairs-12, holding the shift key down, and selecting the second project, Pipe Repairs-13, then right-click and choose Open Project from the popup menu, Figure 1.
 Figure 1
The activities tab lists the schedules in ascending Project ID order from top to bottom of the screen, Figure 2.
 Figure 2
So, it is simple to vertically display the Gantt charts one above the other.
Let’s demonstrate how to display the two Gantt charts horizontally, side by side. We continue and choose Project | Additional Activities View, Figure 3.
 Figure 3
This adds another Activities tab, Activities-2, which becomes the active tab. Return to the previous by clicking the Activities tab, Figure 4.
 Figure 4
Choose View | Tab Groups | New Vertical Tab Group, Figure 5.
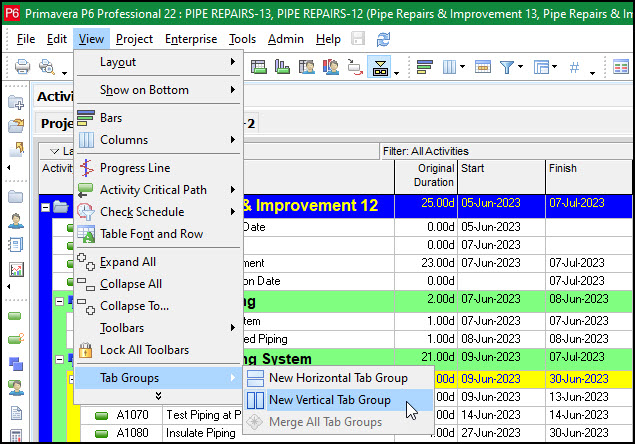 Figure 5
The two schedules are displayed side by side but are not vertically aligned, Figure 6.
 Figure 6
This is because the projects tab is resident. We need to exit the Projects tab. To do this, select the Projects tab, Figure 7, to make it active.
 Figure 7
Then click to exit the Projects tab, Figure 8.
 Figure 8
Now, the schedules are vertically aligned. Now, let us make the Gantt charts next to each other with no activity table between them. Vertically scroll the first schedule to the top of the display, then click on the Activities-2 vertical frame separator and move its Gantt chart frame overtop its activity table, Figure 9.
 Figure 9
We now must align the two Gantt charts. Click the upper right to exit the full-screen mode, Figure 10.
 Figure 10
Adjust the lower right corner of the current frame accordingly, Figure 11.
 Figure 11
Adjust the vertical scroll bar for the Activities-2 schedule; the schedules and side-by-side Gantt charts are displayed in Figure 12.
 Figure 12
So, we have the Gantt charts horizontally and side by side, the initial plan, and a snapshot.
Both schedules have the blue data date line at the start of the project. When multiple projects are open, P6 Professional displays one (blue) data date line for all open projects. The snapshot with the progress updates has a status date of June 18, 2023, but the (blue) data date line for this snapshot is displayed at the project start date.
Summary
The P6 Professional Activities Additional View and New Vertical Tab Group features make it possible to display Gantt charts side by side. It does take several frame and scroll adjustments and some inventiveness, but it is feasible.
Be aware that both Gantt charts will display the same status date of the project and the earliest data date of the two schedules.