 In Deltek Acumen Fuse, you may choose your diagnostic scoring methods as either metric-based scoring or record-based scoring as a measure to check the quality of a respective schedule.
When considering which diagnostic scoring methods, metric-based or record-based scoring, it is important to note that a record is an activity or task. Also, the scoring method you choose to measure schedule quality has a significant impact on a schedule’s overall quality score.
In metric-based scoring, Acumen Fuse calculates the quality score using an average of the metric scores. This method allows for incremental improvements to activities to be reflected in the overall score. Schedules typically receive higher scores when metric-based scoring is implemented. A single task would need to fail in multiple areas simultaneously to receive a very low score. Record-based scoring is more conservative. And uses the more stringent criterion and/or mantra “record fails if one metric fails”.
In record-based scoring if an activity fails any of the quality scoring metrics, then the activity has effectively failed all the metrics. The breach of any single metric on an activity will prevent that activity from receiving a passing grade. This is the default setting in Deltek Acumen Fuseand generally provides a more vigorous and robust response to issues that exist in the schedule.
This article provides quick tip guidance on the most suitable diagnostic scoring methods for Deltek Acumen Fuse’s schedule quality analysis.
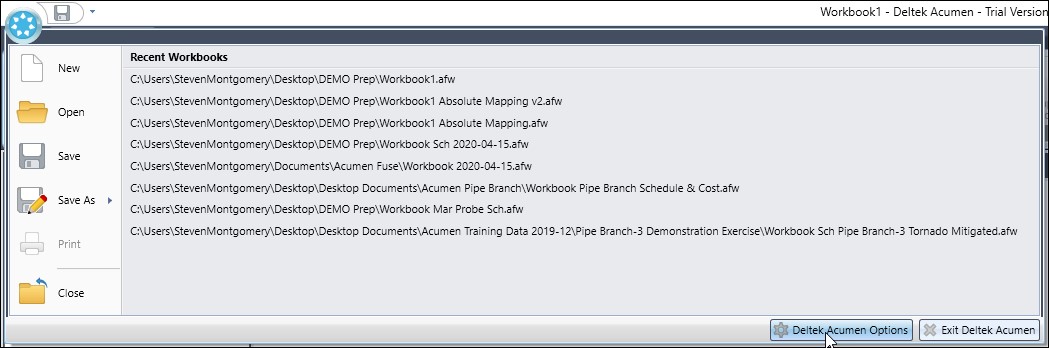
Let us first measure schedule quality using metric-based scoring. Click on the Deltek Acumen home button. In the resulting dialog, Figure 1, select the Deltek Acumen Options button.
 Figure 1
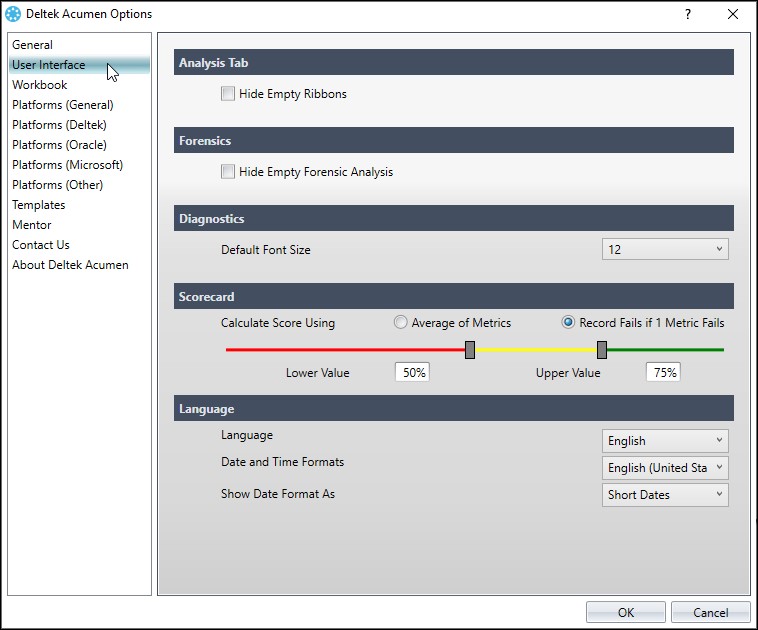
In the Options dialog, click on the User Interface page, Figure 2.
Figure 2
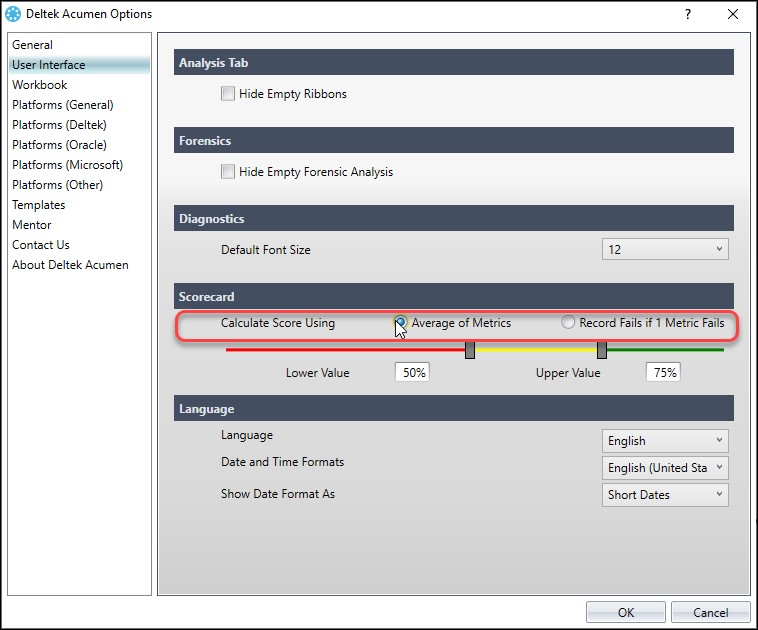
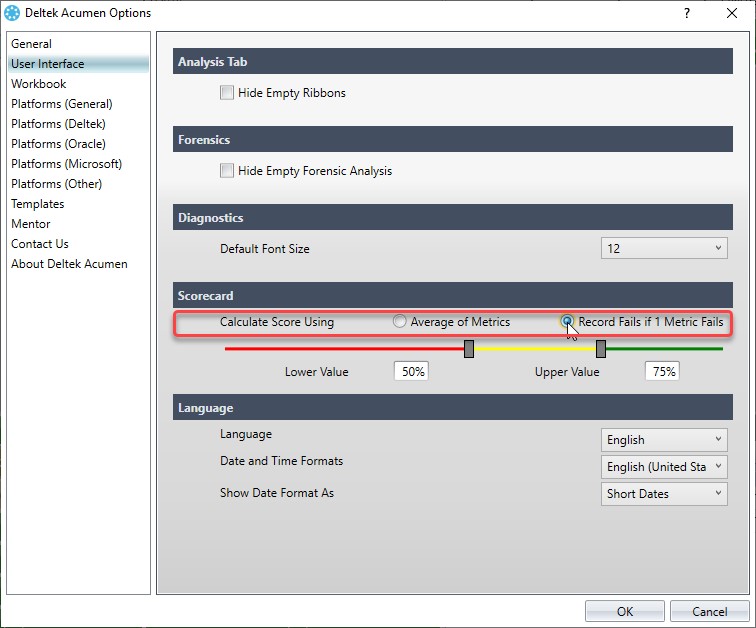
Locate ‘Calculate Score Using’ option and toggle, Average of Metrics, Figure 3.
Figure 3
Now we choose a XER file to read in. Choose S1 // Projects | Oracle Primavera, Figure 4.
Figure 4

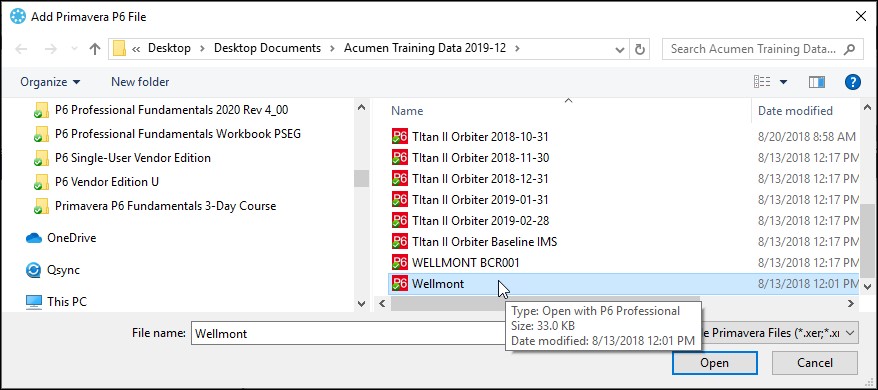
In the resulting ‘Add Primavera P6 File’ dialog, Figure 5, choose Wellmont and click Open.
Figure 5
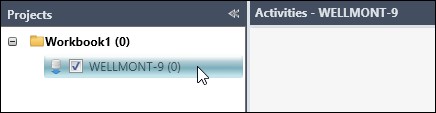
The project will appear in the Project navigation window to the left of the screen, Figure 6.
Figure 6
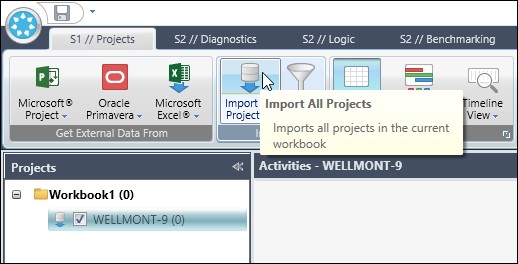
The project is now linked to Workbook1, but not quite imported. Click on Import All Projects, Figure 7.
Figure 7
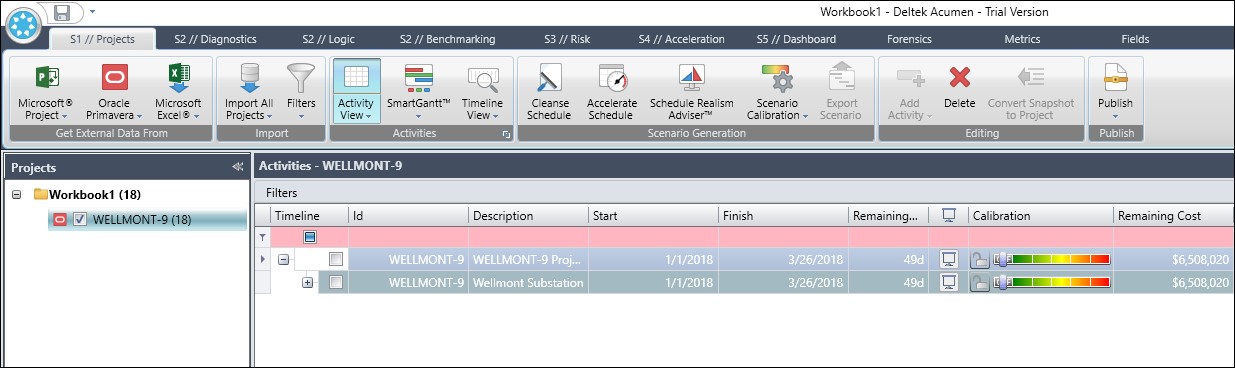
This imports the XER project into Deltek Acumen, Figure 8.
Figure 8
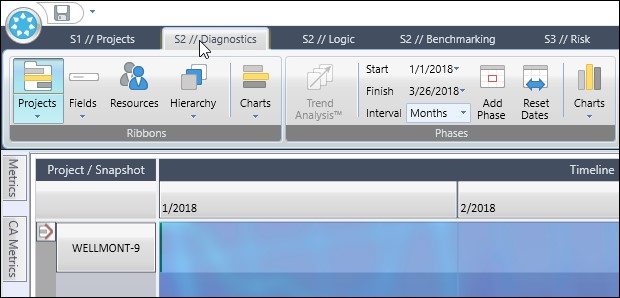
Click on the S2 // Diagnostics tab, Figure 9.
Figure 9
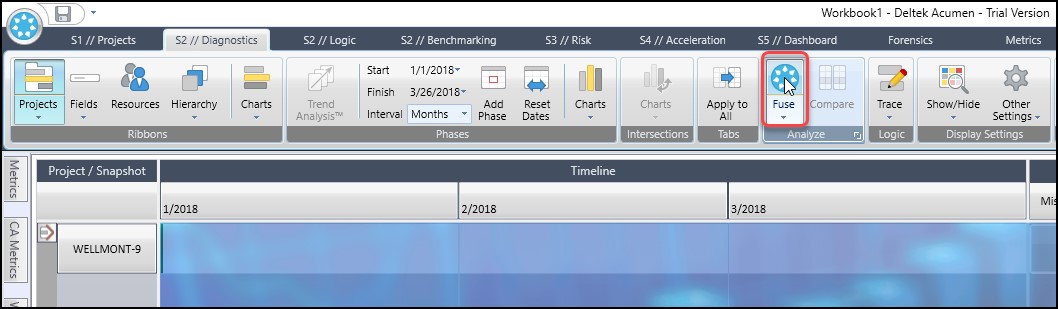
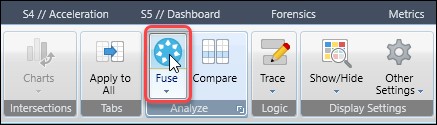
In the Analysis section of the Diagnostics ribbon, click on the upper half of the Fuse ribbon, Figure 10.
Figure 10
Deltek Acumen then runs a Fuse analysis of the schedule. When the analysis is completed, you will see the following Ribbon and Phase Analyzer metrics appear on the screen, Figure 11.
Figure 11
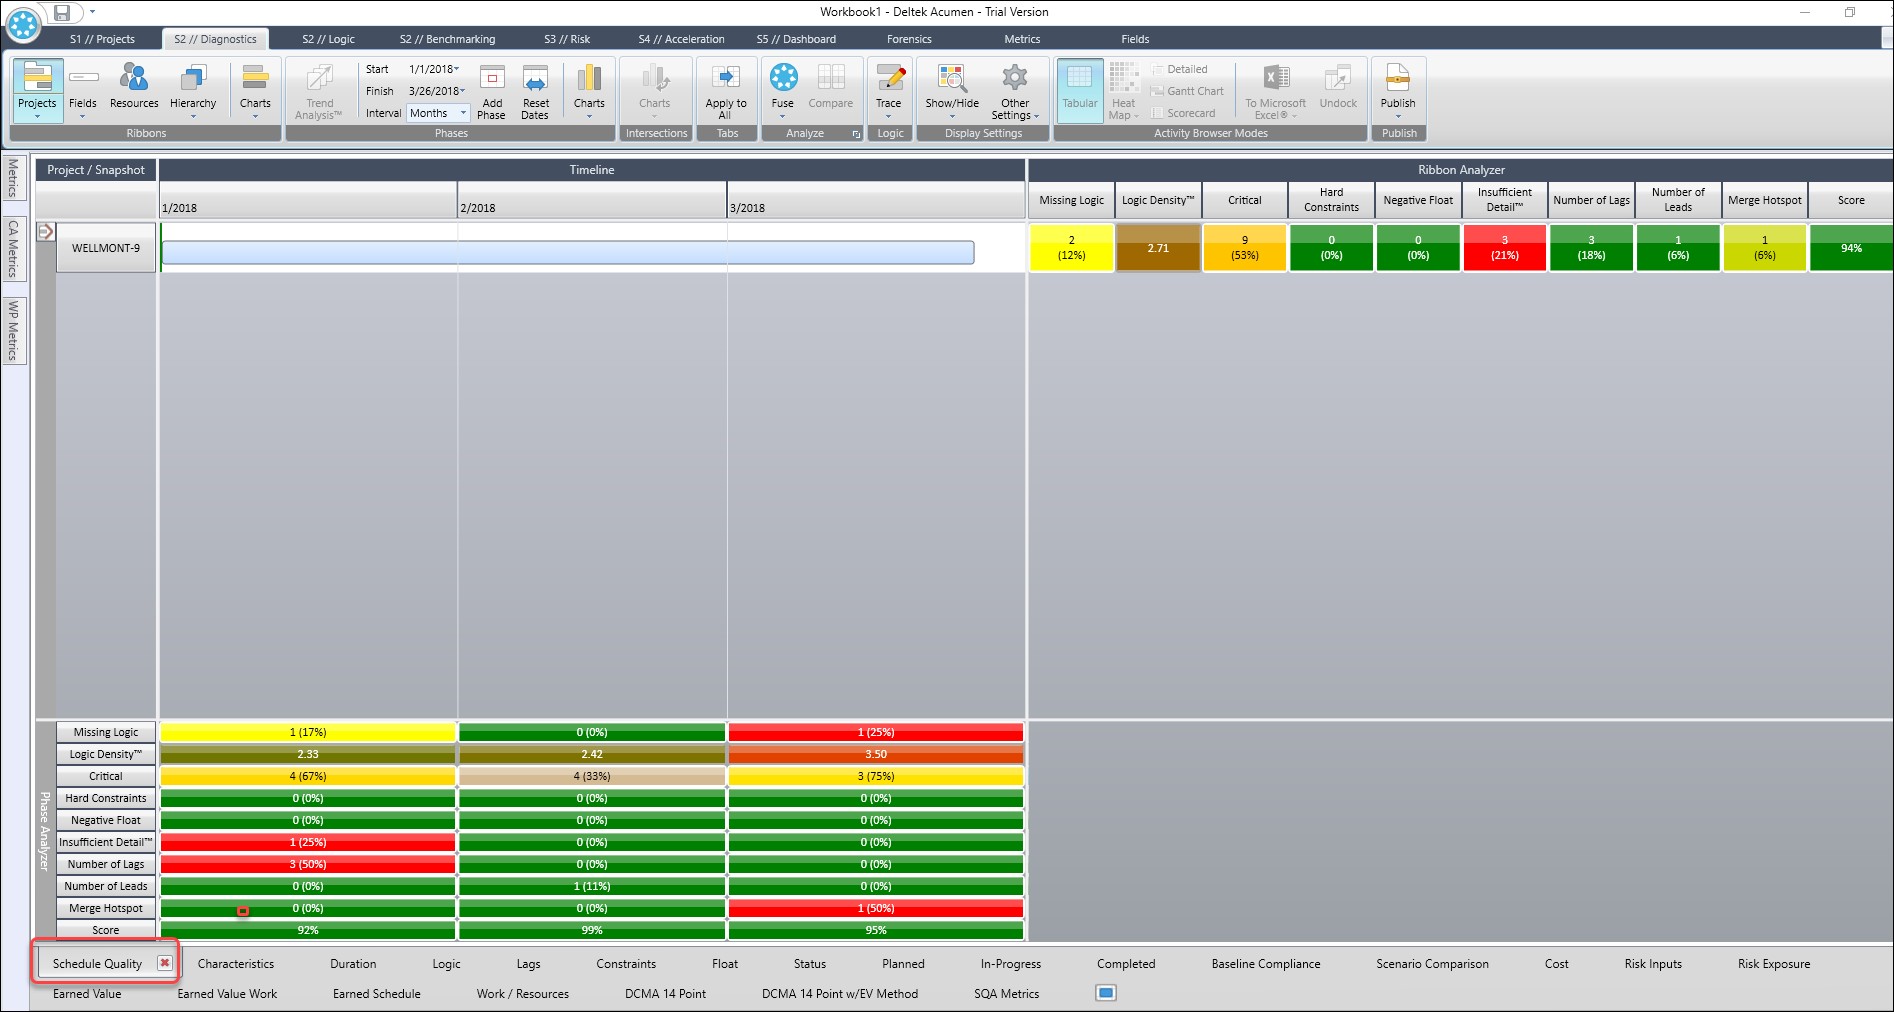
We see from the lower left corner of the screen that Acumen ran a Schedule Quality metric group Fuse analysis of the schedule. Now let us review the Ribbon Analyzer results, Figure 12.
Figure 12
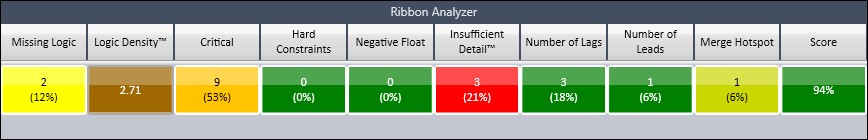
Taking a closer look at the Ribbon Analyzer, we find that the overall score is high at 94%, Figure 13.
Figure 13
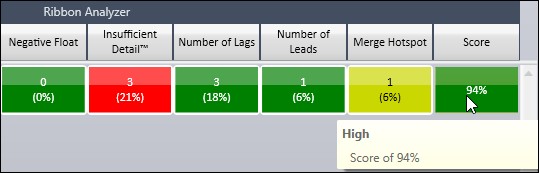
We recall that our scorecard was set to calculate score using ‘Average of Metrics’. When we click on Insufficient Detail field, we have a list of three activities that failed the Insufficient Detail metric, Figure 14.
Figure 14
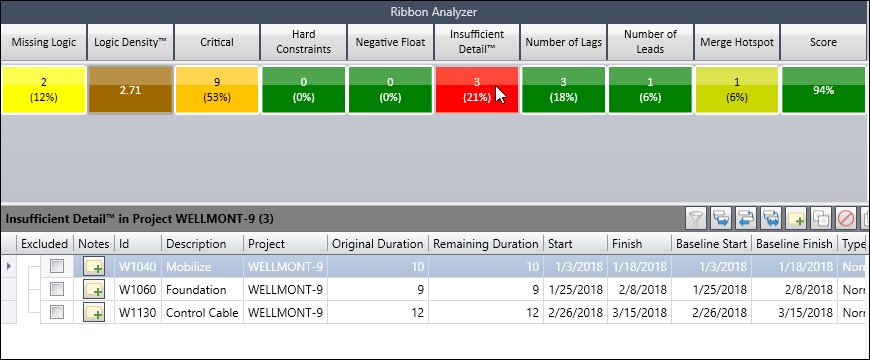
Since we are using ‘Average of Metrics’ the overall score for each of these activities is an average. Because these activities or records did better in other metrics, they do not fail the criteria.
We then proceed and set the Calculate Scoring Using to ‘Record fails if one record fails’, Figure 15.
Figure 15
We again run the Fuse Schedule Quality analysis, Figure 16.
Figure 16
We have the Ribbon Analyzer results in Figure 17.
Figure 17
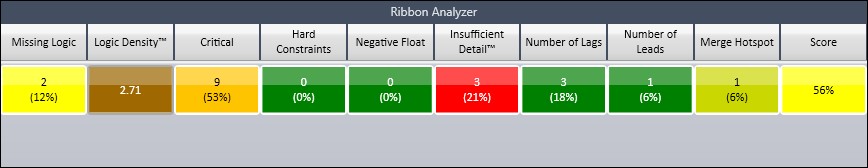
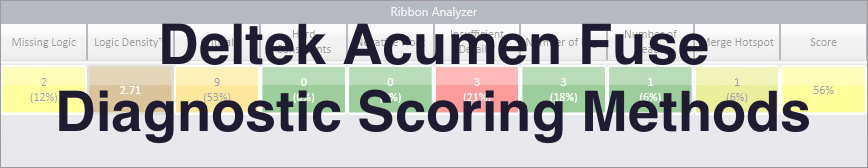
Again, taking a closer look at the Ribbon Analyzer, we find that the overall score is medium at 56%, Figure 18.
Figure 18
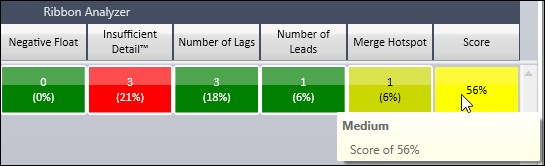
We observe that ‘Record fails if 1 Metric fails’ is a stricter criterion than ‘Average of Metrics’. Now the three Insufficient Detail activities are all counted as failed activities or records. And, therefore, they weigh more heavily on the overall score which is now down to medium at 56%.
Thus, we know that our schedule quality needs improvement. And the first metric to examine in more detail is the Insufficient Detail metric. We may want to consider breaking these activities up into smaller activities to provide more details about the efforts.
Summary
When considering which diagnostic scoring methods in Acumen Fuse, the ‘Record fails if 1 Metric fails’ is a more vigorous criterion. It provides an early warning that something in the schedule is amiss. This makes it more conservative. The ‘Record fails if 1 Metric fails’ is the default criterion and more suitable for examining the quality of a schedule in most situations.
The ‘Average of Metrics’ option is best used to investigate the effect of incremental changes to an activity. The record may fail one metric, but still capture improvements to the score from other metrics. These improvements to the task would not be seen if the calculate score using is set to ‘Record fails if 1 Metric fails’.