 Is it better for your schedule’s data date timestamp in P6, i.e. status date, to fall at the default midnight or match the exact start time of the next reporting period’s work? It depends, so let’s take a look at this in more detail.
Some students in my P6 Professional Fundamentals class have asked why there is a work gap in the progressed schedule’s Gantt chart. This separation falls from the data date and the beginning of the next reporting period’s work. The status date and work continuation may be on the same date, but a divide separates the two.
It is caused by the difference between the data date’s timestamp and the next reporting period’s activity effort. The default for the timestamp is 12 a.m., so if work commences at 7 a.m., the Gantt chart displays a 7-hour discontinuity between the completed work and the beginning of the next period’s work.
Schedulers can adjust the data date timestamp in P6 and have the status date fall directly at 7 a.m. to match. This removes the separation. But there are situations where you might be better served to leave the data date at midnight and let a slight gap remain.
This article demonstrates differences and issues when progressing the schedule using a data date timestamp in P6 of 12 a.m. versus a timestamp to match the start of the next interval’s workload.
Figure 1 displays the Gantt chart of a schedule with a weekly interval for reporting schedule progress.
 Figure 1
The black diamonds are the current schedule milestones. The yellow bars and diamonds represent the baseline, a static ruler to measure progress against. The blue is completed work; the green or red bars are work that remains. The data date (or status date) in Figure 1 is the line of separation between completed and remaining work.
Tasks left of the data date should be completed work, and those on the right are what remains to be done. The green remaining work bars are tasks with a positive total float value and, therefore, can delay a proportionate amount (as per the total float value) without delaying the project’s end date. The red bars have zero total float and cannot be delayed without postponing the project’s current end date.
The data date and start and finish dates of tasks are defined by the day and timestamp, i.e., the time of day.
Demonstration – Time Gap Causes
Figure 2 shows a sample schedule status after the first week’s progress.
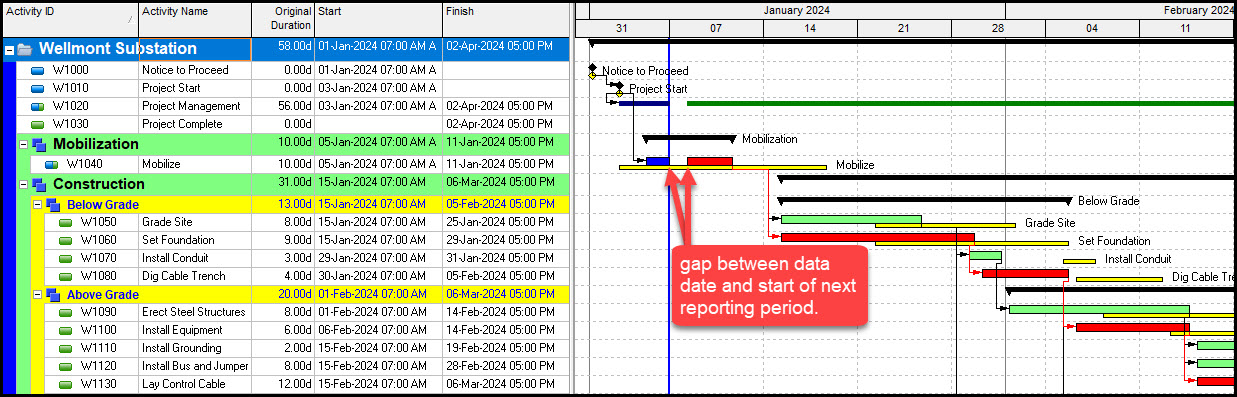 Figure 2
Note the gap in the mobilize task between the data date and the remaining mobilize effort. What is the cause of this divide?
Let us take a closer look. We proceed and choose View | Time Scale. In Figure 3, we change the data interval of the Gantt chart timescale to Week/Day 1.
 Figure 3
In Figure 4, we have a closeup of the separation.
 Figure 4
The divide is caused partially by the status date falling on Sunday instead of Monday. In the next demonstration, we will set the status date to Monday, but a slight slit will remain between the data date and the start of the remaining work.
This divide is caused by the difference in the hour setting for the data date and the beginning of the remaining work. Let us continue with our demonstrations.
Demonstration – Elimination of Time Gap
In Figure 5, we set the data date to Monday, January 8, 2024, and leave the timestamp at midnight.
 Figure 5
We then recalculate the schedule with a January 8, 2024, date and 12 a.m. timestamp, Figure 6.
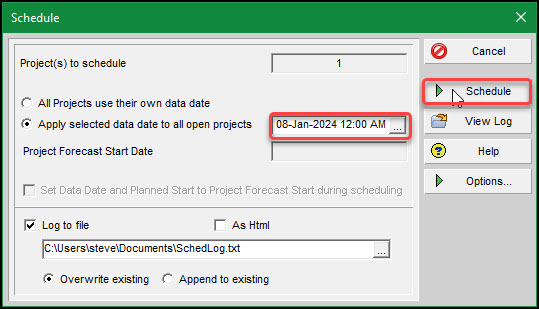 Figure 6
Figure 7 is the Gantt chart after scheduling; a small interlude remains though the data date and remaining work are on the same date, January 8th.
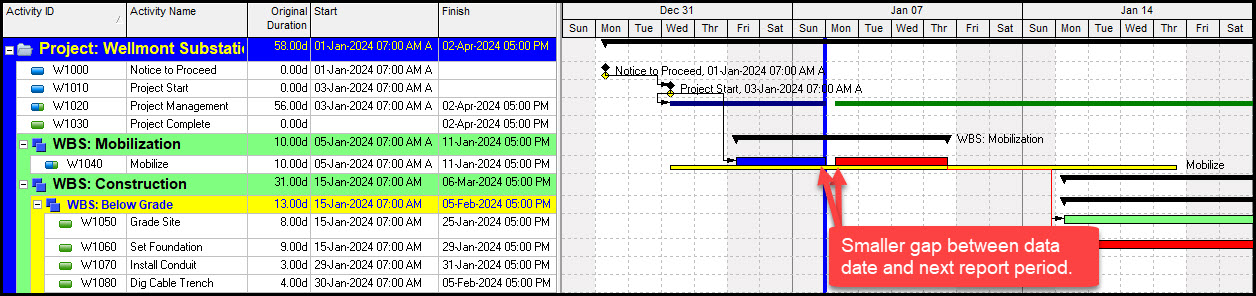 Figure 7
To eliminate this small slit, we change the status date timestamp to coincide with the 7 a.m. start time of the remaining Mobilize work, Figure 8.
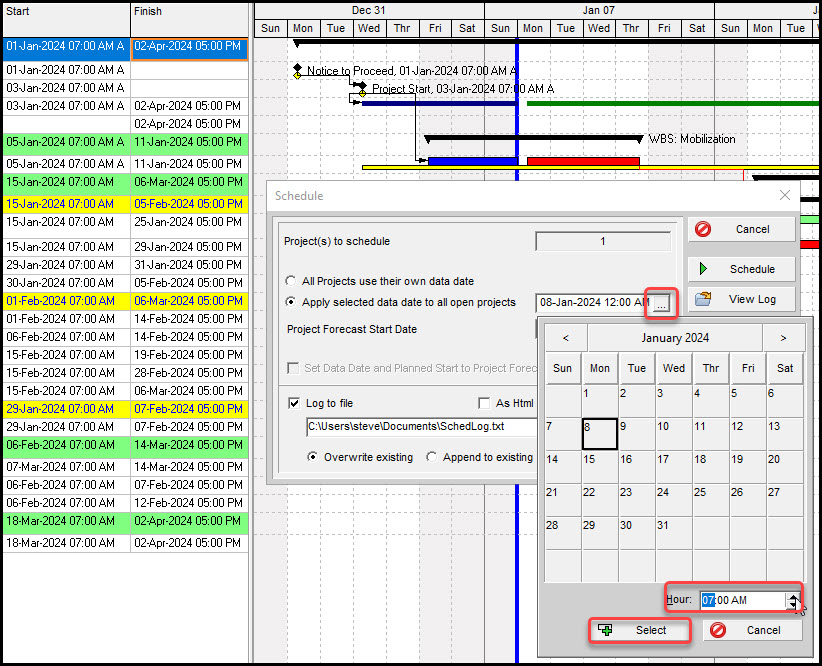 Figure 8
We then recalculate the schedule. The resulting schedule appears in Figure 9; there is no gap between the actual and remaining Mobilize work.
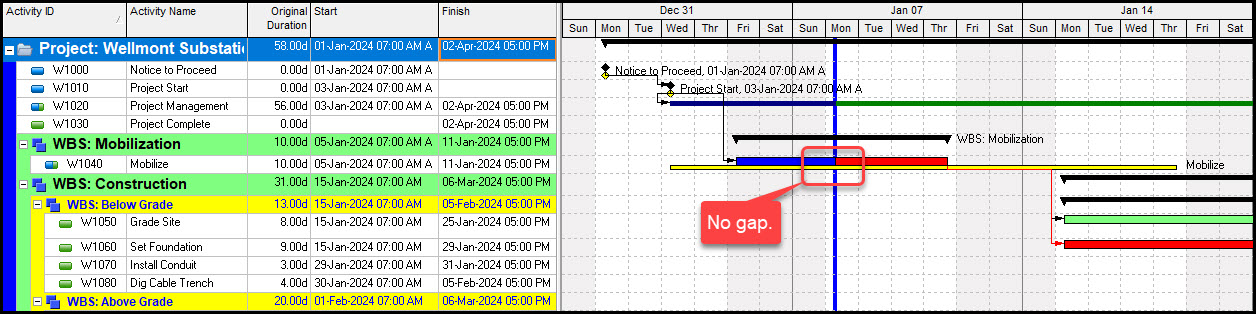 Figure 9
The data date becomes exactly centered between the two report periods, Figure 9. So, we have eliminated the divide between completed and remaining work. However, sometimes, a work interruption may help the schedule update process. Let us demonstrate to explain.
Demonstration – Spotlight and Time Gap
The spotlight is a useful tool to highlight in yellow all the tasks that fall in the current reporting period and may have progress, Figure 10.
 Figure 10
The spotlighted Gantt chart, Figure 10, displays vertical yellow shading for the current reporting period. All the tasks in this interval have horizontal yellow shading in the activity table, Figure 10.
Our data date is set to Sunday at 12 a.m. in Figure 10. We click the Progress Spotlight, Figure 10, and observe that the Project Management and Mobilize efforts are included in the current reporting cycle. The Project Management task is Level of Effort (LOE), so P6 Professional automatically provides the progress for this activity; it requires no update on our part. We do need to input progress for the Mobilize effort.
Next, we eliminate the separation by setting the data date to Monday at 7 a.m. The resulting schedule is displayed in Figure 11.
 Figure 11
This time, when we activated the Progress Spotlight, Figure 11, the tasks highlighted for updates include W1050 – Grade Site and W1060 Set Foundation. However, observe in the activity table and Gantt chart that these tasks commence on Monday, January 15, 2024, at 7 a.m., so they don’t begin during the current reporting period. Their start time is adjacent to the current reporting period, which may be why they are included.
So, if you use the Progress Spotlight to identify tasks requiring updates, it may better serve your highlighting effort to leave the data date timestamp at 12 a.m. Otherwise, the Progress Spotlight confuses which tasks truly are in the current reporting period. And this convolutes your schedule progression process.
Summary
For better aesthetics, set the data date timestamp in P6, or conclusion of the current reporting period, to be exactly adjacent to the start of the following period. Your gap between the data date and the current period’s remaining work may be slight, but I have found that students often question this; your stakeholders, including the sponsor, may also note this discrepancy. It is best to eliminate the discontinuity for reporting.
However, when using the Spotlight Feature, a small divide in work activity ensures that tasks beginning at the start of the following reporting period are not mistakenly highlighted for updates. The lesson is to be aware of the date’s timestamp.
Another example of the importance of timestamp awareness: if your reporting period ends on Wednesday, January 31, 2024, ensure the reporting period concludes at the end of the day. In our case, that would be 5 p.m. Otherwise, your progress update will miss an entire day of progress, affecting the accuracy of your Earned Value Management (EVM) metrics like the Schedule Performance Index, Earned Value divided by Planned Value.