 Primavera P6 Visualizer program provides another way to print the schedule Gantt chart. You can also create graphs showing the Longest Path in Visualizer.
Primavera P6 Professional has the option to define critical activities two different ways the first is by Total Float and the second is by Longest Path. Visualizer takes the schedule created in P6 Professional and creates an activity table and Gantt chart printout.
Visualizer defaults to display critical activities defined by Total Float, regardless of the setting specified in P6 Professional. If you want to display only Longest Path activities as critical on your Visualizer graph output, you must inform Visualizer, accordingly.
This article demonstrates how to display only Longest Path activities as critical on the Visualizer Gantt chart graph.
We have in Figure 1 below, our demonstration project schedule.
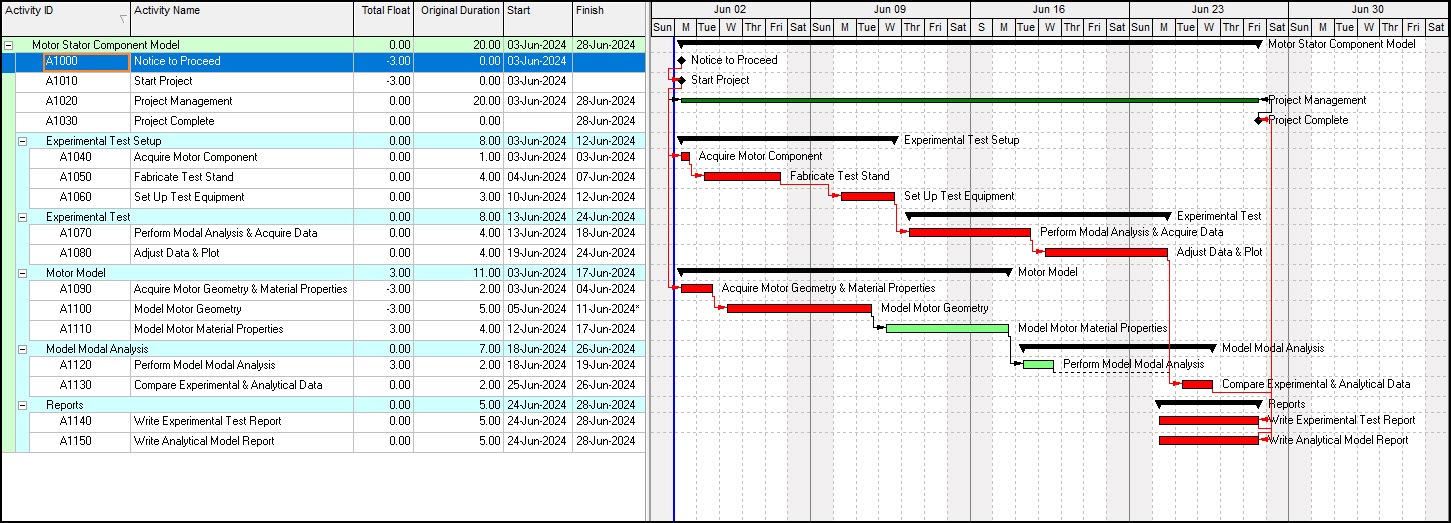 Figure 1
You will observe that there are two critical paths in this schedule. One that is continuous from Notice to Proceed to Project Complete. The other critical path is from activities that are critical in relation to an activity constraint applied to the Model Motor Geometry activity. This activity constraint induced critical path does not extend the project duration.
We want to isolate the critical path that is for the project length. This is the Longest Path. To only view critical activities that are along the Longest Path we set the Schedule Options ‘Define critical activities’ setting to Longest Path, Figure 2.
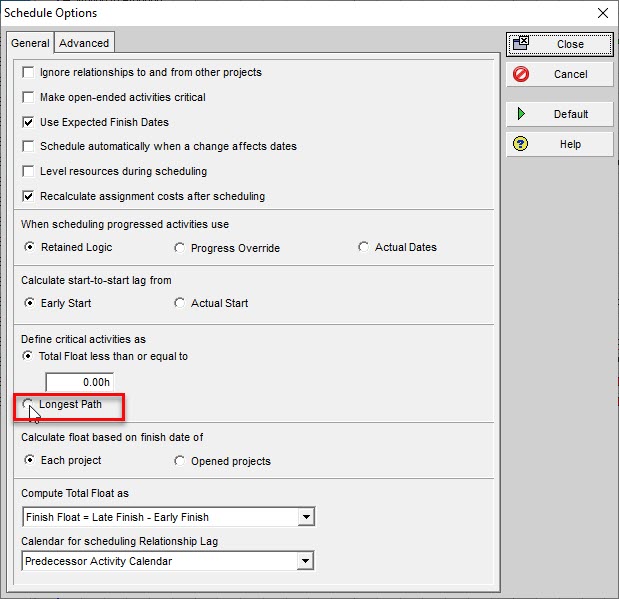 Figure 2
The resulting schedule, including the Longest Path critical activities, are displayed in Figure 3.
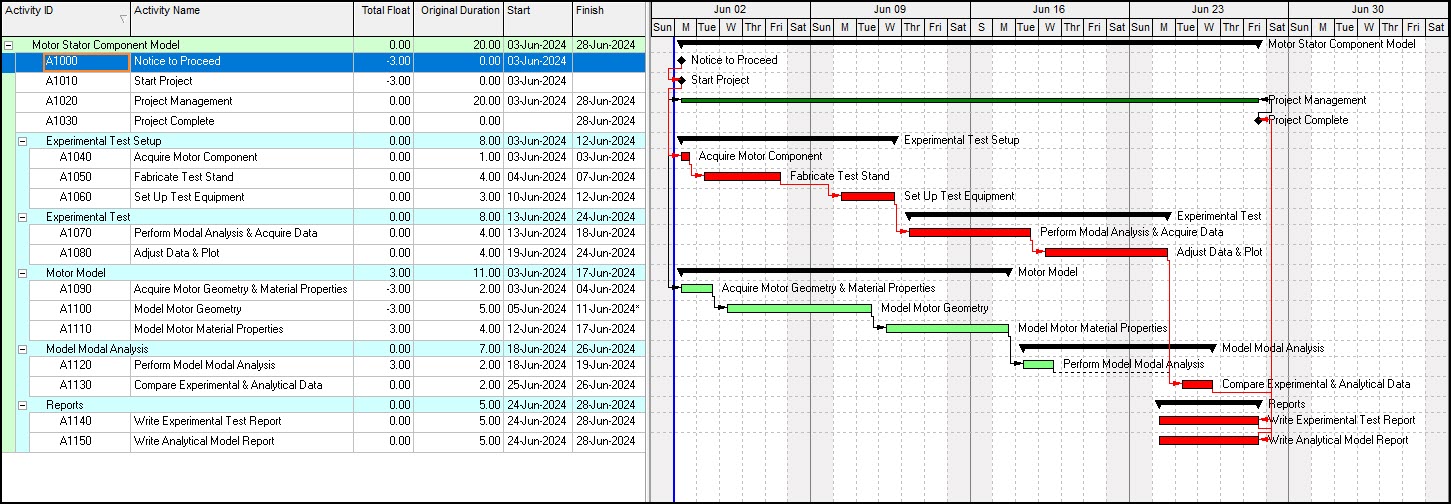 Figure 3
We want to view this same activity table and Gantt chart in P6 Visualizer, as it provides another useful printout of the schedule. We proceed and choose Tools | Visualizer, Figure 4.
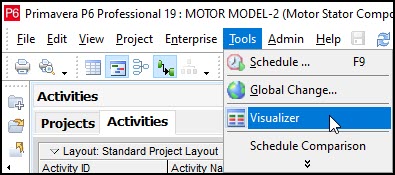 Figure 4
When Visualizer appears click the plus sign (+) and choose Gantt from the drop-down menu, Figure 5.
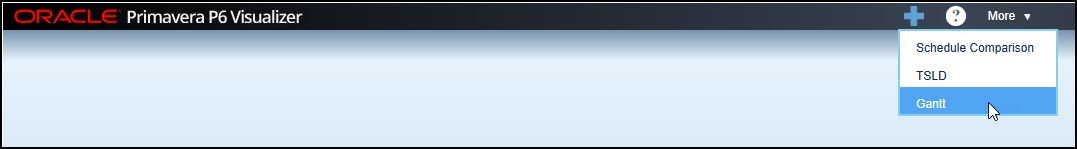 Figure 5
This takes us to the Create or Open Gantt Diagram dialog, Figure 6, where we select the Motor Model-2 project for our Gantt chart graph then click .
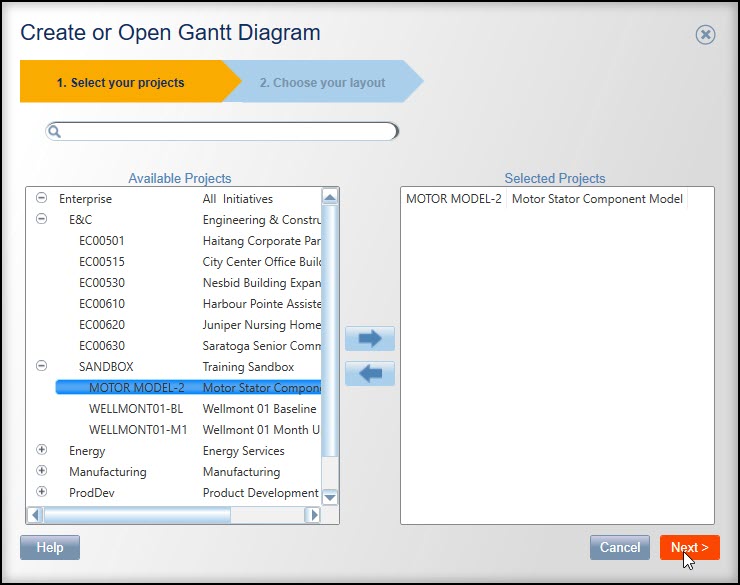 Figure 6
We choose to create a new layout, named Motor Schedules, Figure 7.
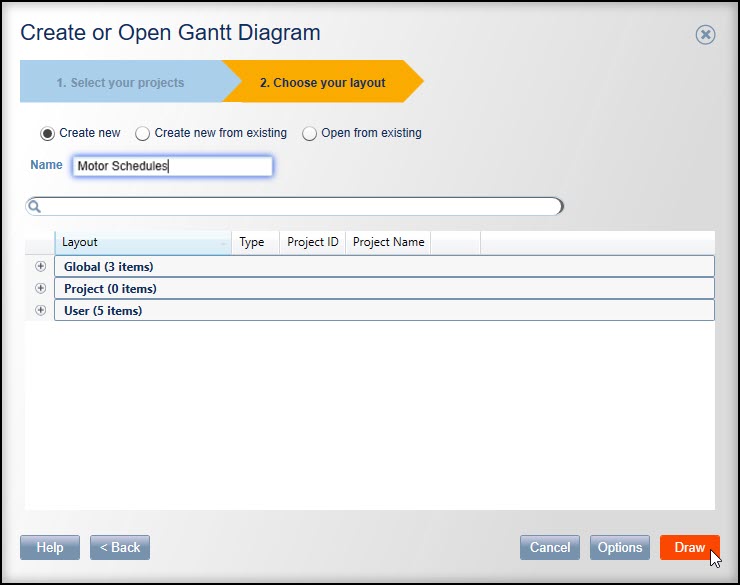 Figure 7
Then we click the button, Figure 7. The resulting activity table and Gantt chart display in Figure 8.
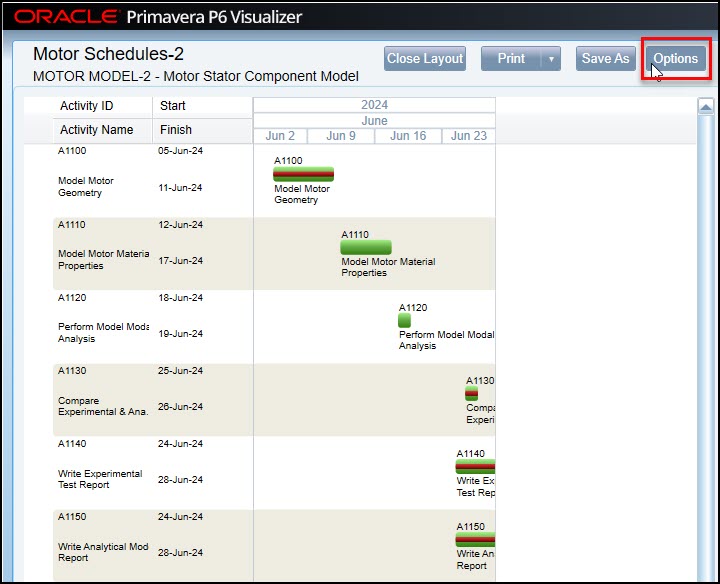 Figure 8
It is good the Gantt chart graph plotted, but the graph requires improvement. We need to adjust the Timescale settings and select to view the activity relationship lines. Choose the options button, Figure 8. Choose the Timescale tab and set the General project start and finish settings as displayed in Figure 9.
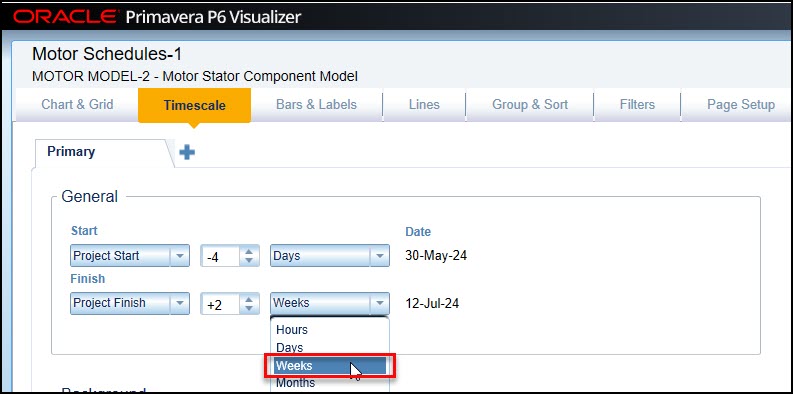 Figure 9
Then choose the Timescale plus (+) tab and set the Zoom Area 1 General project start and finish settings, and adjust Zoom to 300%, which works well for our schedule’s graph, Figure 10.
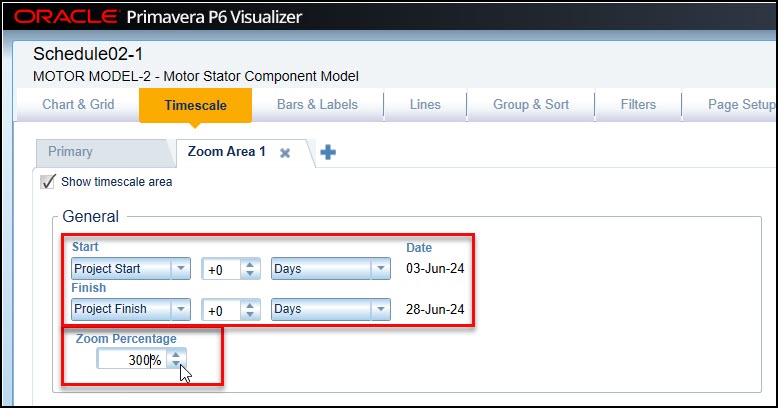 Figure 10
We must zoom in because of the short one-month duration of our schedule. We continue in options and choose the Lines tab and toggle to ‘Show relationship lines’, Figure 11.
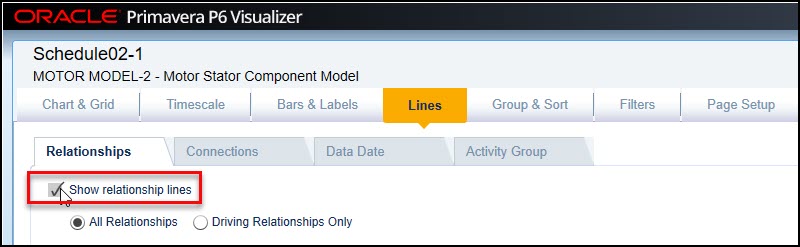 Figure 11
We click the button to generate the Gantt chart graph below, Figure 12.
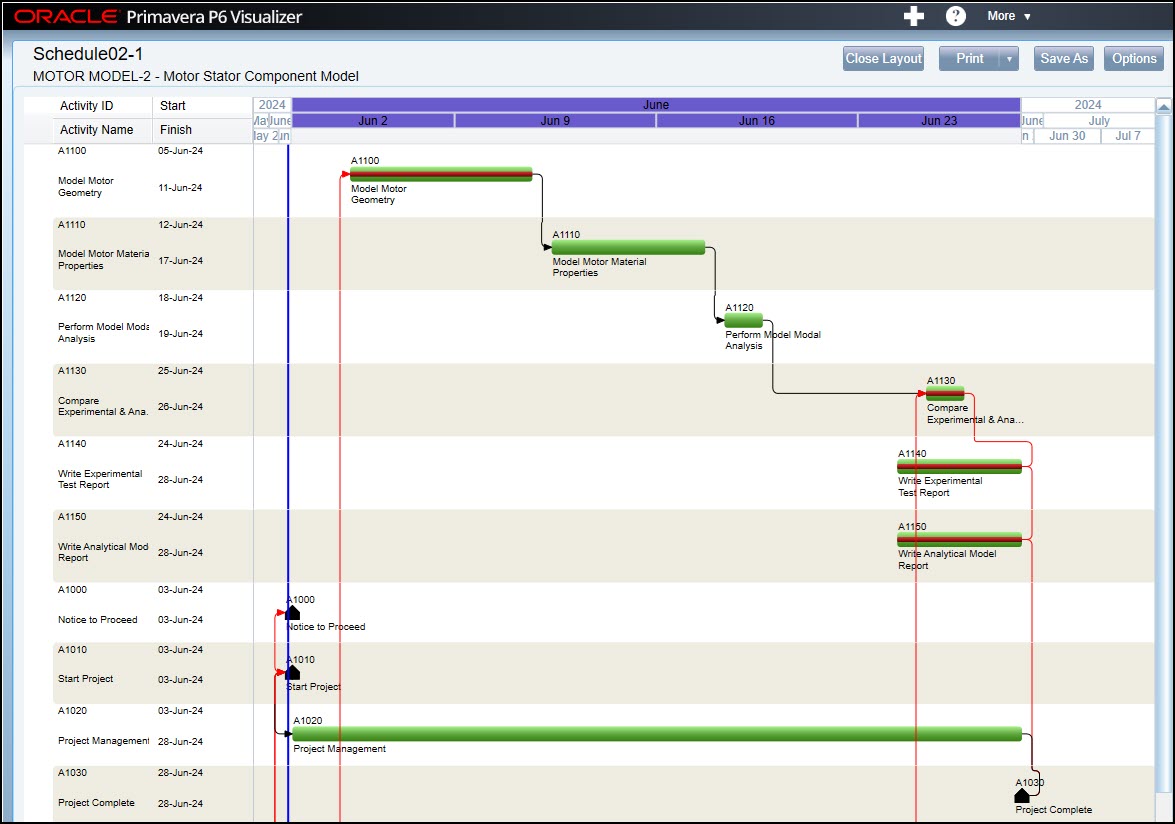 Figure 12
Our graph is making progress, but we need to group by the deliverable, WBS. Again, click Options, Figure 12.
Then choose the Group & Sort tab, Figure 13, and in the Group By section select to group by WBS and indent.
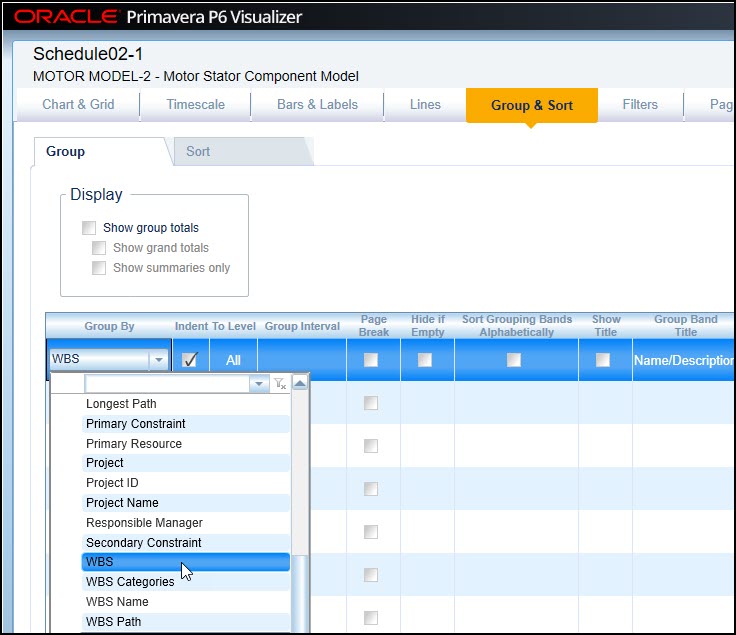 Figure 13
Note that WBS is found in the general category. Click and the resulting schedule Gantt chart plots in Figure 14 with our schedule grouped by deliverable, Figure 14.
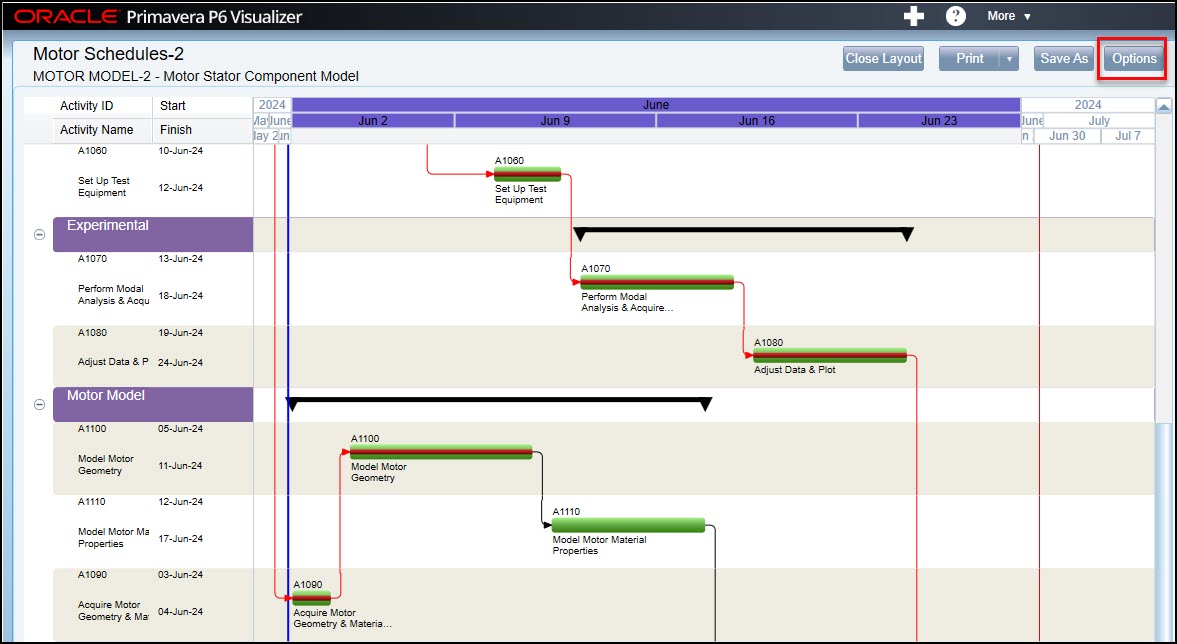 Figure 14
A noted improvement to our graph, but our schedule activity IDs are not in ascending order. Click options and the Group & Sort tab then add the line Activity ID Ascending, Figure 15.
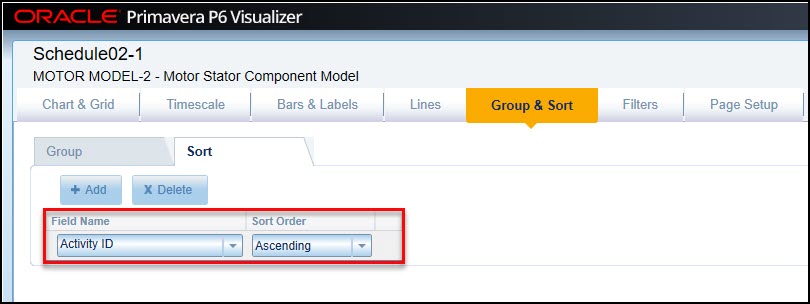 Figure 15
Again, click and the plot appears as in Figure 16.
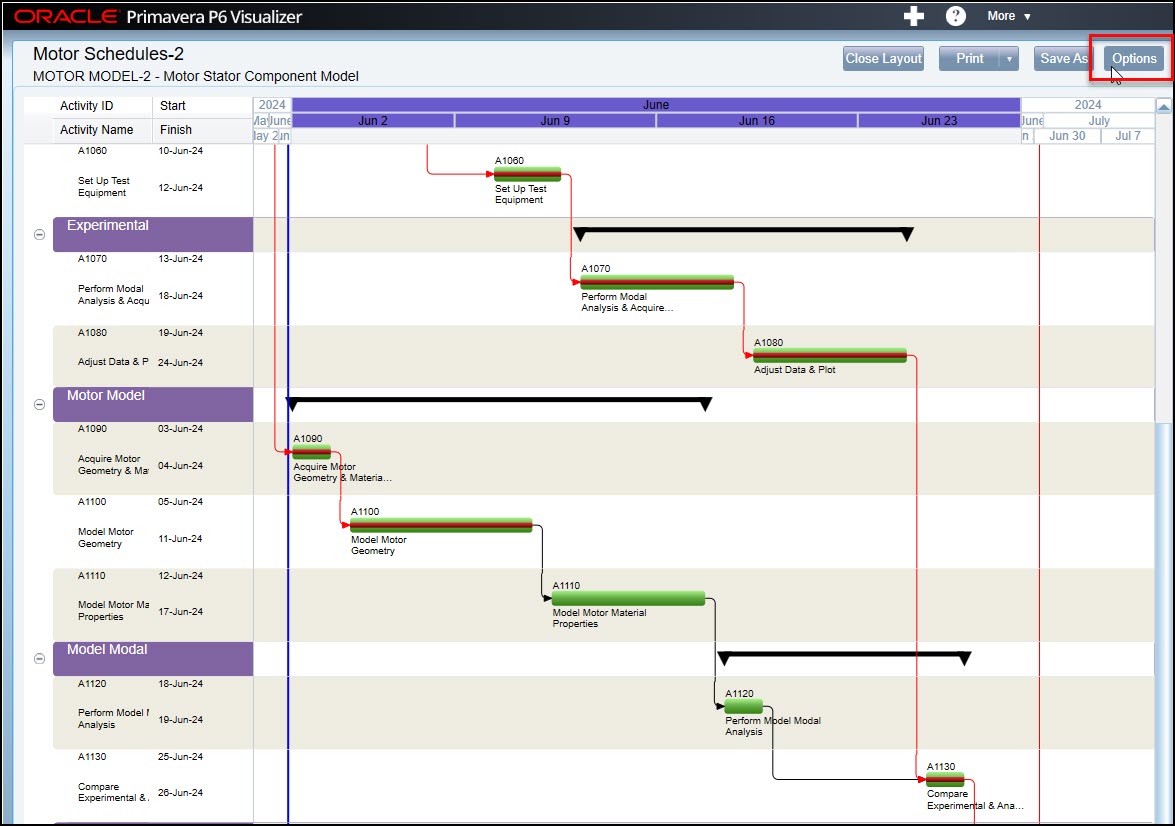 Figure 16
Now our graph is significantly improved, and we are set to address the whole point of our article which is to have the Visualizer Gantt chart only display Longest Path activities as critical. This setting if found in Options | Bars & Labels | Critical Remaining Work > Filters | Standard – Longest Path, Figure 17.
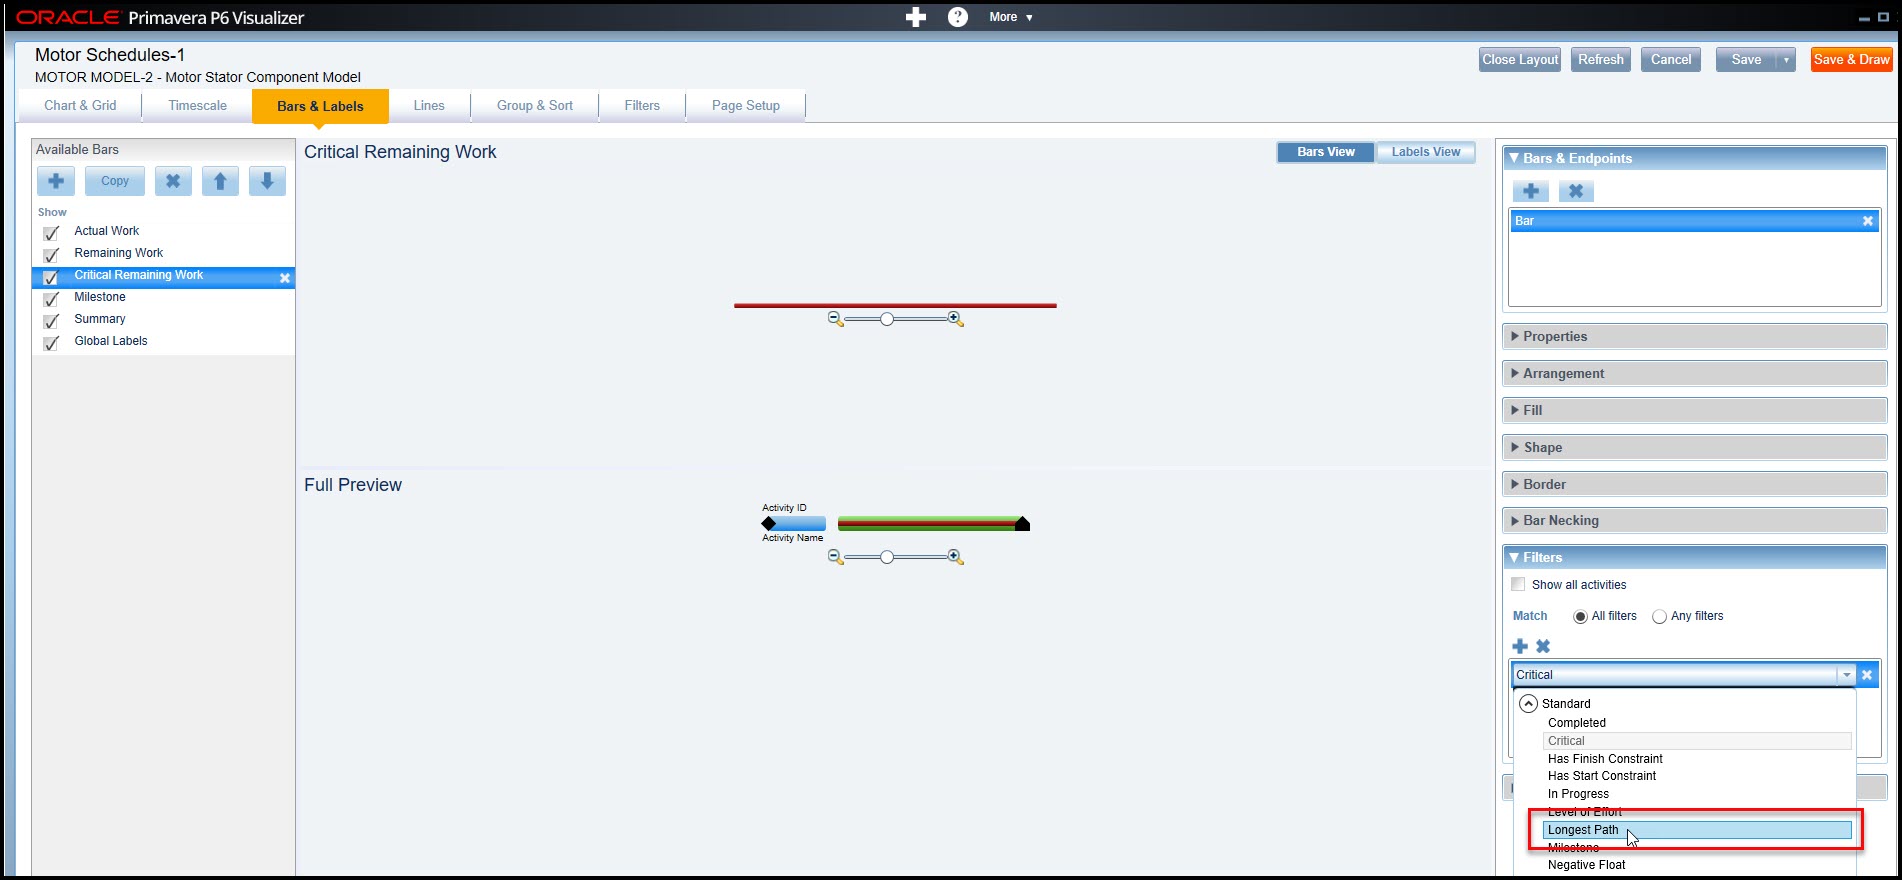 Figure 17
Click one last time, and the final activity table and Longest Path Gantt chart appear in Figure 18.
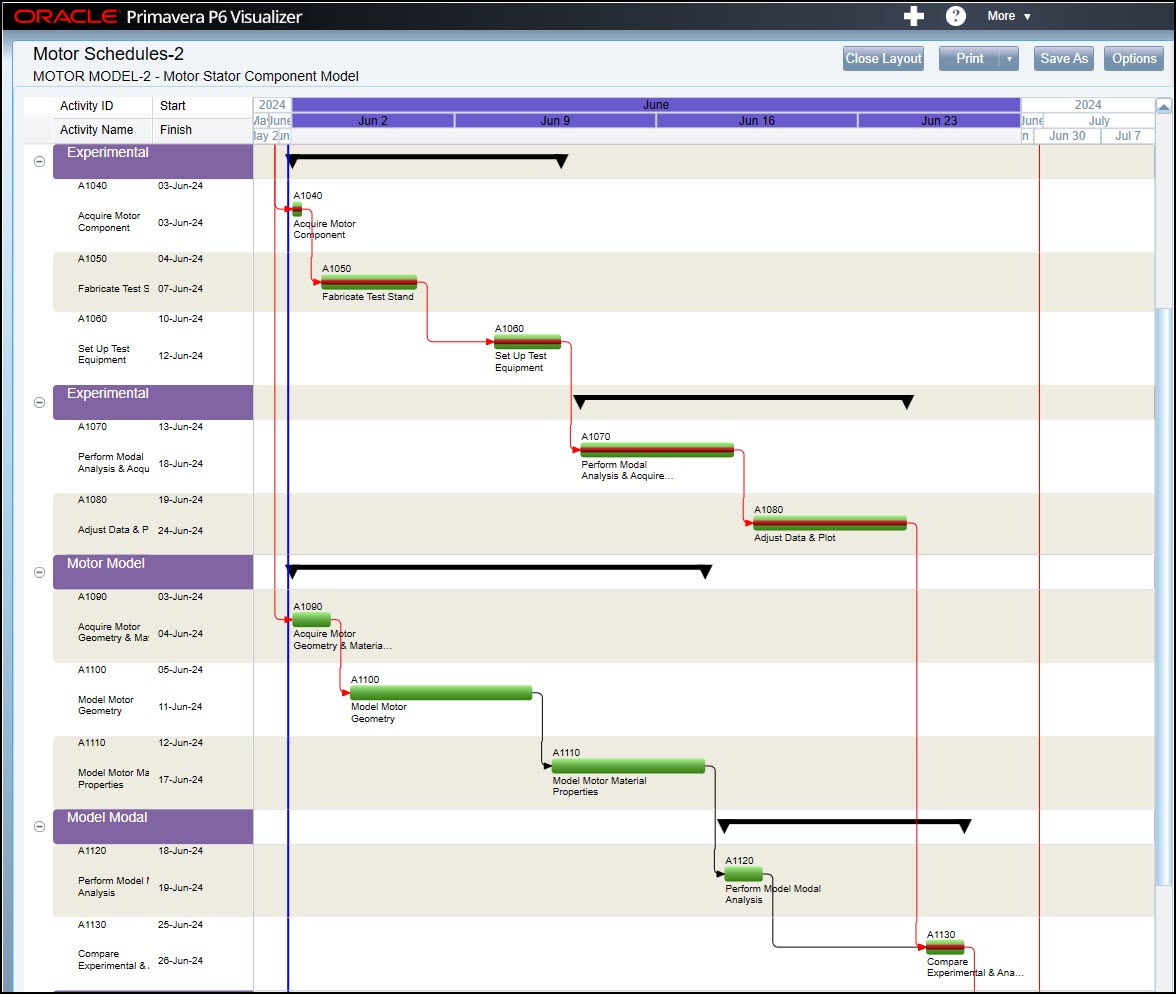 Figure 18
Summary
Visualizer provides additional Gantt chart graphics and features that some may prefer to the Print features directly embedded in Primavera P6 Professional.
The default settings in Visualizer are set for Bars & Labels | Critical Remaining Work to filter for critical activities. This Filters setting captures all activities in the schedule that are critical, including activities that are critical due to an activity constraint.
Visualizer can display and plot a Gantt chart where only Longest Path activities are critical, as we demonstrated. So, Visualizer has graphics features for graphing the schedule Gantt chart, including Longest Path, for presentation of the schedule to team members and other stakeholders.