 Calculate the Worst Case EAC in P6
Primavera P6 Professional’s Earned Value Management (EVM) features can capture an under-performing projects key data values that are needed to forecast the total project expense, including worst case schedule realignment costs. Let’s take a look at this.
Project managers need to keep a close eye on their costs to make sure they have enough funds available to complete the project. EVM provides a way for the assessment of to-date project achievement and forecasts for end-of-project performance. EVM captures four key data values: Planned Value (PV), Earned Value (EV), Actual Cost (AC), and Budget at Completion (BAC). A boatload of EVM metrics derive from these four inputs, which were written about in the blog The Earned Value Management (EVM) Building Blocks.
With them the project manager can predict the end budget of the project to confirm or not that sufficient funds are available to complete the project. This forecast is the estimate at completion (EAC). The fundamental formula for the EAC is as follows:
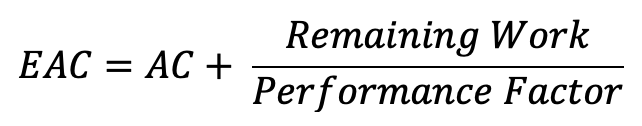
Or
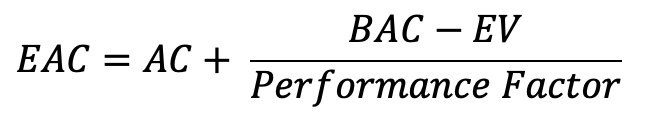
One relevant performance factor in this equation is that required to realign an underperforming schedule (time) in the triple constraint (scope, time, and cost) by relaxing the cost constraint, while maintaining the original scope. Here the performance factor accounts for both the schedule deficiency and funds required to get the schedule back on track to meet the required deadline.
This article demonstrates a P6 Professional EVM study to confirm sufficient dollars available for funding a project’s schedule realignment to meet the project-end-date target.
A Frequent Project Management Situation
It is a common scenario: after falling slightly behind schedule, management wants to know if they have enough funds set aside to cover the cost of additional resource efforts required to complete on time. A typical gut reaction when a schedule falls behind is to have team members work overtime and/or add more team members to the project. Increasing the resource effort may shorten schedule duration, but empirical data shows it always increases end-of-project costs. These extra resource costs will have to come from somewhere.
Management Reserve
Management Reserve are funds set aside to address risk and cost issues that inevitably arise during project execution. The Project Manager has access to these reserve funds to support correcting impediments to project success, without increasing the Project Authorized Budget (PAB). The PAB is the dollar amount agreed by the sponsor and project manager. Once this amount is approved, it is very difficult to have the sponsor agree to a monetary increase. The Budget at Completion (BAC) is the amount of money the project manager expects to spend performing the scheduled work. The difference between the PAB and the BAC is the Management Reserve. Again, these reserve funds allow the project manager to shore up issues impacting the BAC without having to request an increase in the PAB.
Figure 1 displays a Performance Management Baseline, a plot of the cumulative value of all project activities and their budgets or the Planned Value (PV) on the y-axis and time on the x-axis.
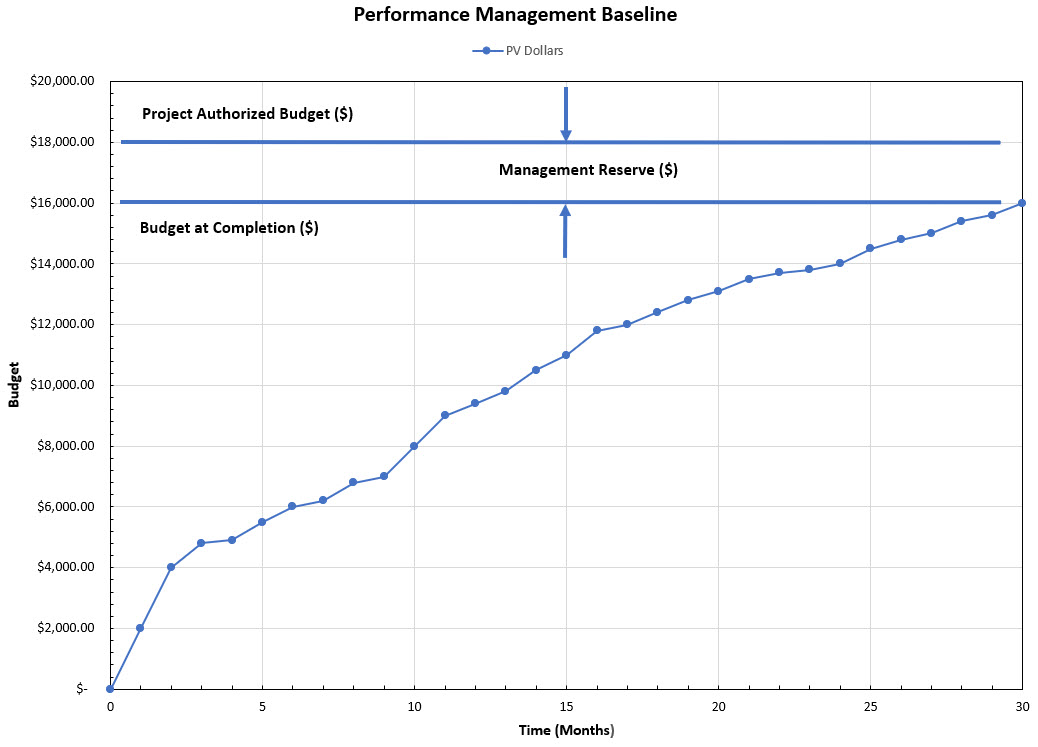 Figure 1
The total cumulative PV for the project is equivalent to the BAC. Figure 1, again, has the PAB, the BAC, and the difference between the two, which is Management Reserve. Using Primavera P6 Professional we can acquire the EVM data values needed to assess performance and forecast the Estimate at Completion (EAC), which includes the cost of schedule realignment. Then can we compare our EAC to the BAC plus Management Reserve, i.e., PAB, to assess the viability of current funding to complete the work.
Performance Metrics
Before proceeding to our demonstration, we introduce two of the best indicators of project health: Schedule Performance Index (SPI) and Cost Performance Index (CPI). These two metrics represent unitless measures of a project’s performance efficiency. For more on these and other basic EVM metrics refer to the following blog Primavera P6 and Earned Value Management.
Schedule Performance Index
The SPI comes in two forms: SPIt (t) and SPI$ ($). The dollarized approach is the traditional EVM form. Its equation is below:
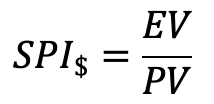
(Note: going forward in this article SPI$ is referred to as SPI.) The SPI metric is unitless, but both EV and PV are dollarized data values (or in economic units). SPI is a measure of schedule performance efficiency. How well the schedule (with respect to time) is going according to plan.
An SPI of 1.0 is represents an on-schedule project. Greater than 1.0 ahead. Less than 1.0 behind, not good. It is important to understand that SPI shows efficiency and not exactly how far ahead or behind the schedule project is in time, e.g., a week, month, or a year.
Cost Performance Index
The cost performance index is as follows:
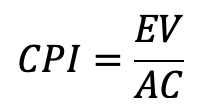
It is a measure of cost performance efficiency. A CPI of 1.0 indicates an on-budget project. Over 1.0 is good; you are underspending. A CPI less than 1.0 is a spendthrift warning indicator.
Cumulative Data Values
There is likely no better indicators of project health than SPI and CPI. Period Earned Value (EV) data is sufficient to monitor current performance, but not future performance. To predict the final performance results, you need the cumulative EV data values to compute the appropriate SPI and CPI metric outputs. And the cumulative CPI is demonstrated to be a stable early indicator of project cost performance.
Further, beyond 20% construction complete the final the cumulative CPI typically does not fully recover back to 1.0 and will not differ by more than 10%. SPI curves at some point level off then make their way back to 1.0 when all the authorized work is complete.
P6 EVM Demonstration
Our P6 EVM demonstration is based on the following situation and resulting task requirement.
Situation:
- After 2 weeks the construction the project is 22.5% complete and the SPI and CPI are below 1.0.
- Management is most concerned about meeting the deadline.
- Management is considering additional resource costs (overtime and adding crewmembers) to complete on time.
- Management wants to know the worst case EAC to confirm they have enough Management Reserve to cover the additional resource costs.
Task:
Calculate the worst case EAC for the project, where the worst case assumes continued erosion of CPI to meet the schedule deadline.
Worst Case EAC
Again, the equation to calculate the EAC is below:

To find the worst case EAC, as per the project manager’s request, the Performance Factor is the cumulative CPI times the cumulative SPI. The EAC equation follows:

The rational to support a forecasting formula that incorporates both cost and schedule efficiency dimensions is that no project team likes falling behind their authorized plan. The compulsion is to get back on schedule, despite having to consume more resources to accomplish the same scope of authorized work.
Project manager’s, therefore, authorize overtime and adding team members to achieve the schedule target, which invariably results in permanent, non-recoverable, damage to the most important efficiency factor, the CPI.
So, schedule realignment is most often achieved by increasing resource effort, and, therefore, cost. The more the schedule is behind or the lower the SPI the more damage to CPI, so adjusting the CPI by multiplying by the SPI, makes sense. The statistical EAC equation combining both cumulative CPI and cumulative SPI has wide professional acceptance for predicting the worst case or high-end EAC scenario. Project managers should use this equation any time the project is driven by a specific completion date, which is our demonstration’s situation.
Progressing the Schedule
Our demonstration schedule, Figure 2, is a simple Pier Piling project at several points on the Granby, Shadow Mountain, and Great Lakes.
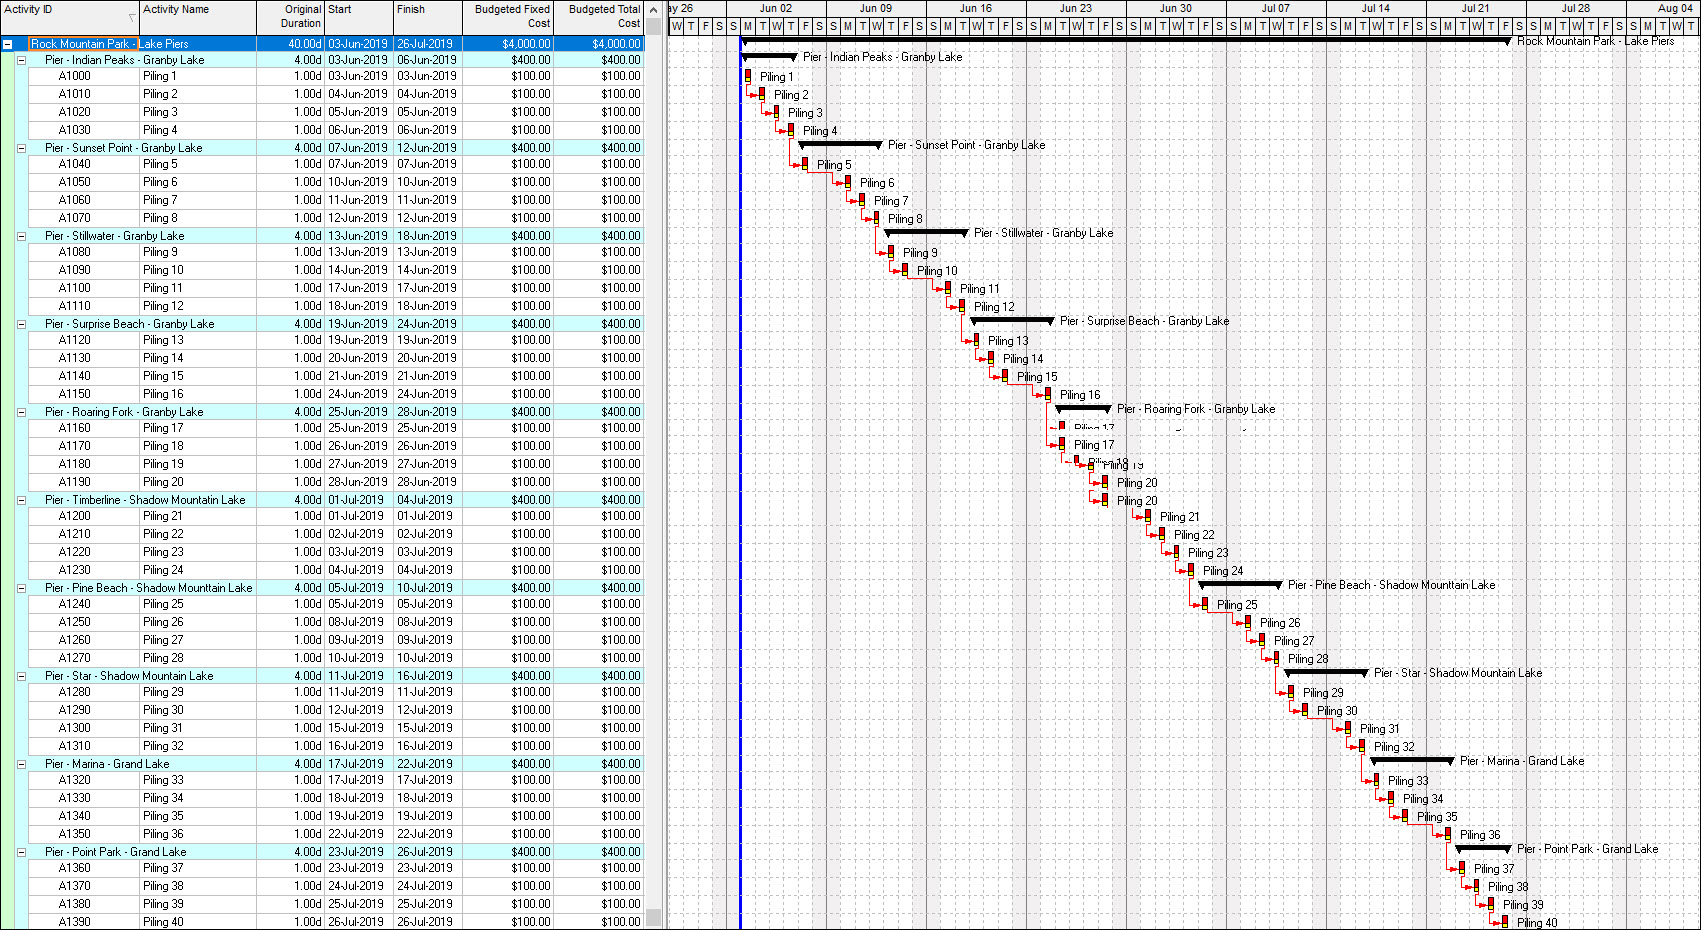 Figure 2
Each piling deliverable has a fixed price cost of $100. The first week’s schedule goes according to plan. We begin and complete the pier pilings for Indian Peaks at Granby Lake. The activity status is entered, and the data date moved forward to June 9th, 2023. The schedule is re-calculated. All is according to plan, except the cost of Pier Piling 4 is $20 overbudget. In Figure 3 we enter the $120 AC of Pier Pilling 4 in the Actual Fixed Cost column, which is the Actual Nonlabor Cost column.
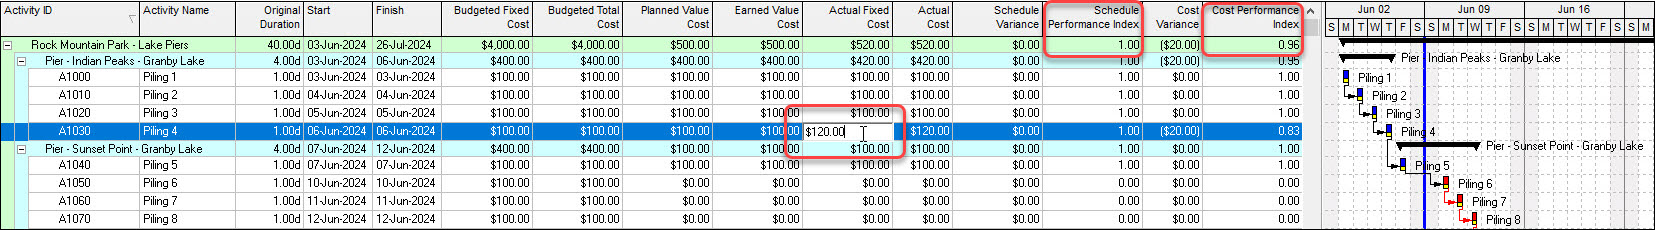 Figure 3
The fixed price budget for each Pier Pilling is stored in the Budgeted Fixed Cost column, which is the Budgeted Nonlabor Cost column. You can store fixed price costs in either the labor cost columns or non-labor cost columns, we chose to locate this data in the non-labor cost columns. To learn more about assigning fixed price costs to activities in P6 consult the blog Assigning Fixed Price Costs to Activities in Primavera P6.
Observe that the SPI is 1.0 and the CPI of 0.96 indicates a slightly under-performing budget.
The schedule the second week is not so fortunate. Pilling 6 through 9 are completed but Piling 10 for Stillwater at Granby Lake has no progress. The activity status is entered, accordingly, and the data date moved forward to the end of the reporting period, June 16th, 2024. The schedule is re-calculated again. The Budget is good except Piling 8 for Sunset Point at Granby Lake is, again, $20 over budget. We enter the $120 AC of Sunset Point in the Actual Fixed Cost column, Figure 4.
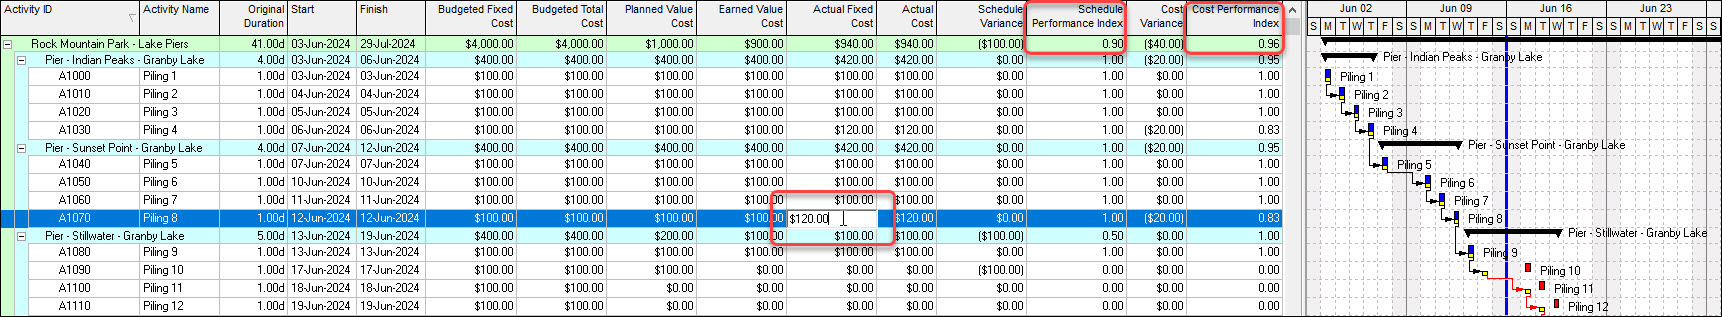 Figure 4
Observe that the Actual Cost column receives its value from the Actual Fixed Cost column. Inspecting the EVM metrics we find a project SPI 0.90 and CPI of 0.98, both below 1.0.
Capturing the Cumulative EVM Data
The periodic metrics SPI and CPI work well for assessing the current performance of the project. However, forecasting the end performance of the project requires the cumulative data values. In the Reports feature we generate a time distributed report to capture the cumulative SPI and cumulative CPI.
In the Reports tab we select a report group, as appropriate, then generate a report as follows:
- Choose Edit | + Add.
- Choose the WBS subject area and toggle on Time Distributed Data, Figure 5.
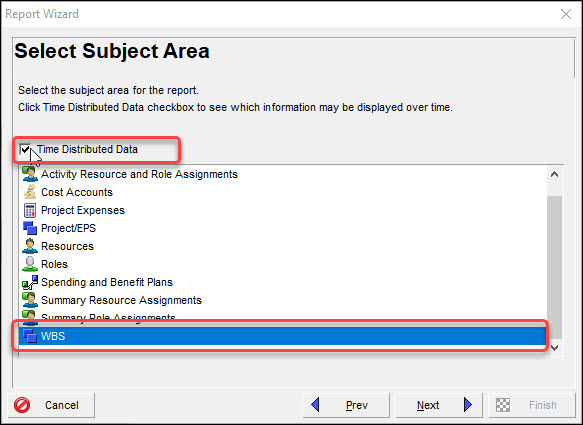 Figure 5
- Click Next.
- Choose Columns button.
- Enter the selected options, Figure 6.
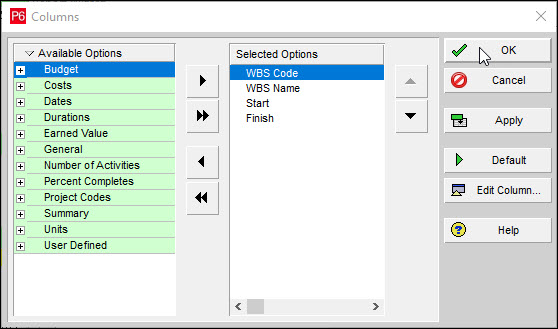 Figure 6
- Click Next. (No need to modify the Group & Sort and Filter buttons.)
- Choose Timescale button, Figure 7.
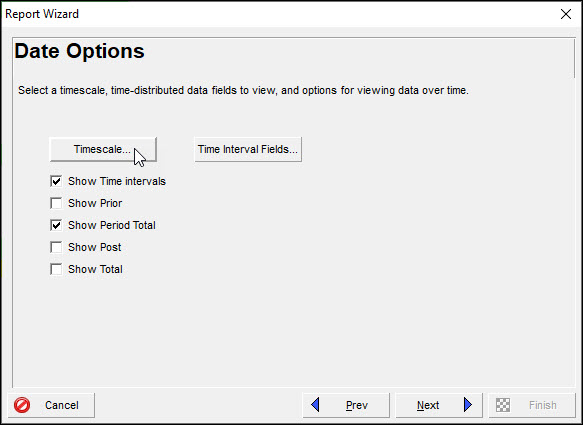 Figure 7
- Set the Date Interval to Week, Figure 8.
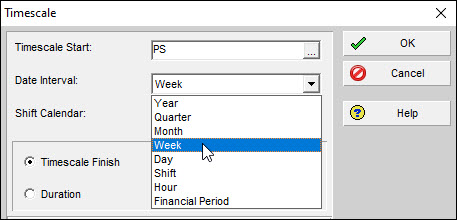 Figure 8
- In the Time Interval Fields choose the Cumulative Earned Value options, Figure 9.
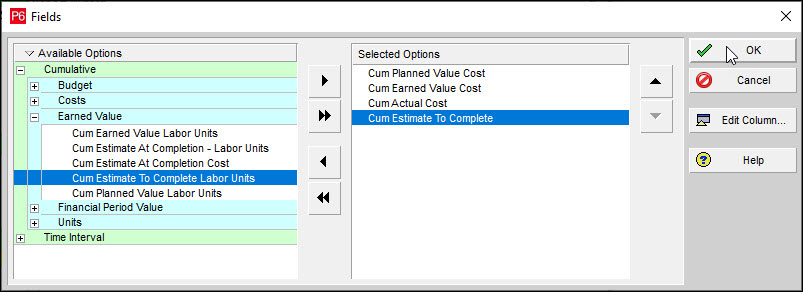 Figure 9
- Click Next.
- Enter a Name, PIER PILING EARNED VALUE REPORT.
- Click Next.
- Un-toggle Format Number.
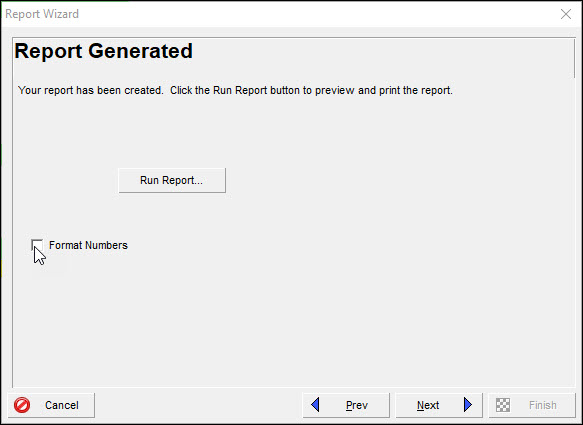 Figure 10
- Click Run Report.
- Choose Delimited Text File option, Figure 11.
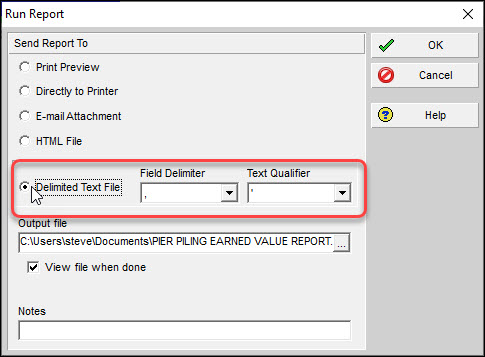 Figure 11
- Click OK.
- The Excel Pier Piling Earned Value Report Spreadsheet appears, Figure 12.
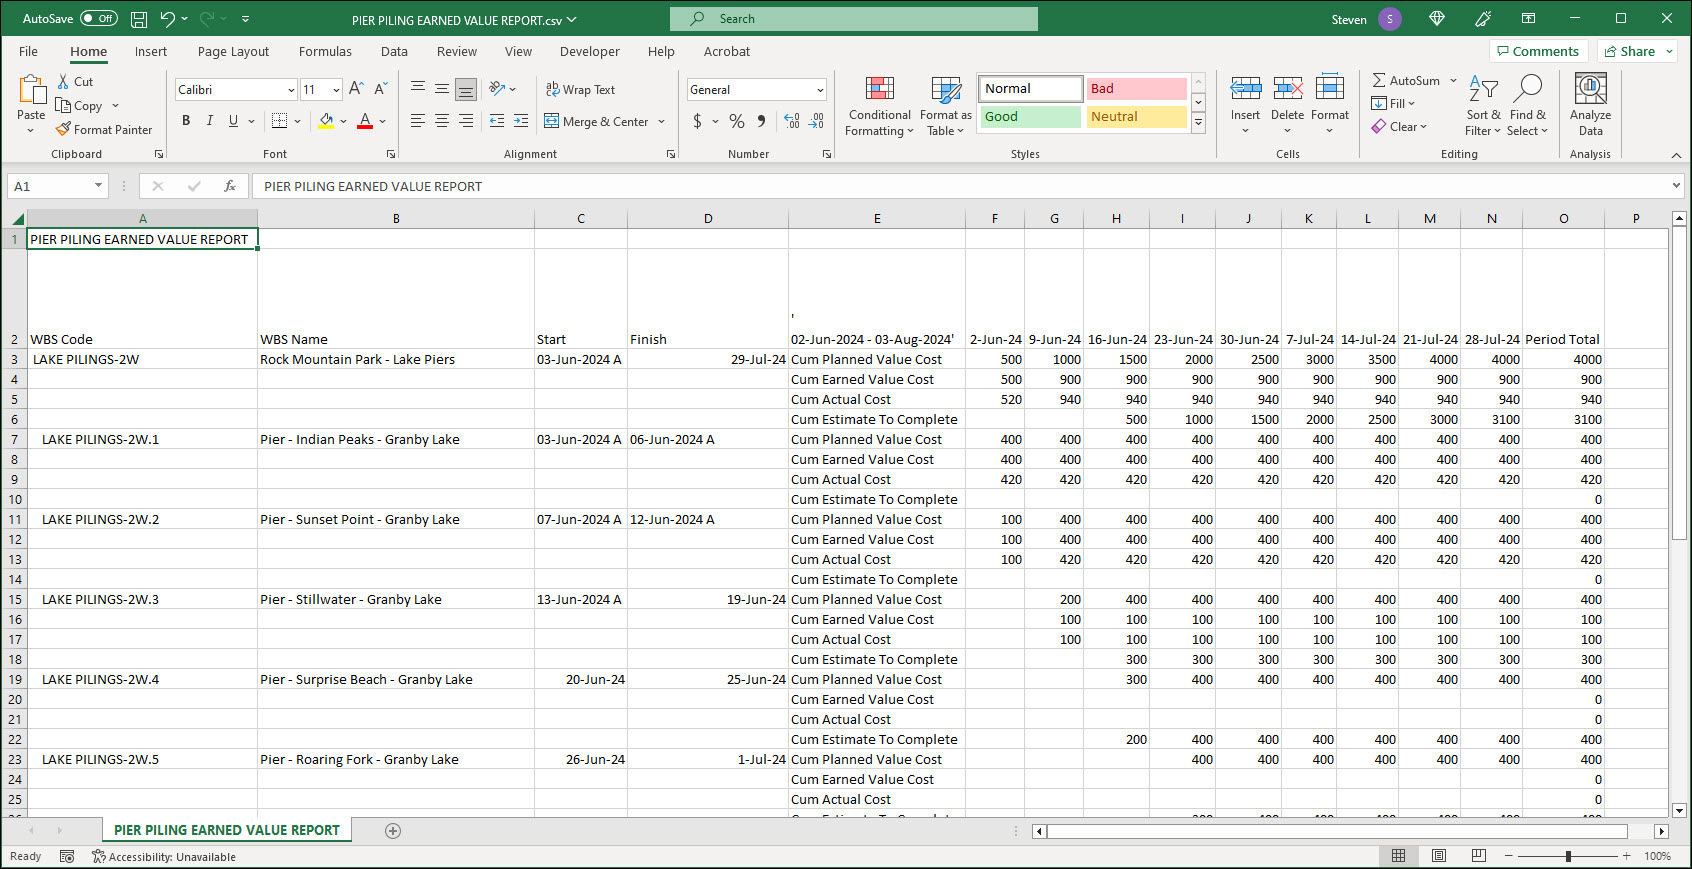 Figure 12
Computing the Worst Case EAC and Available Management Reserve
Using the features in Excel we find the tabulated data values in Figure 13.
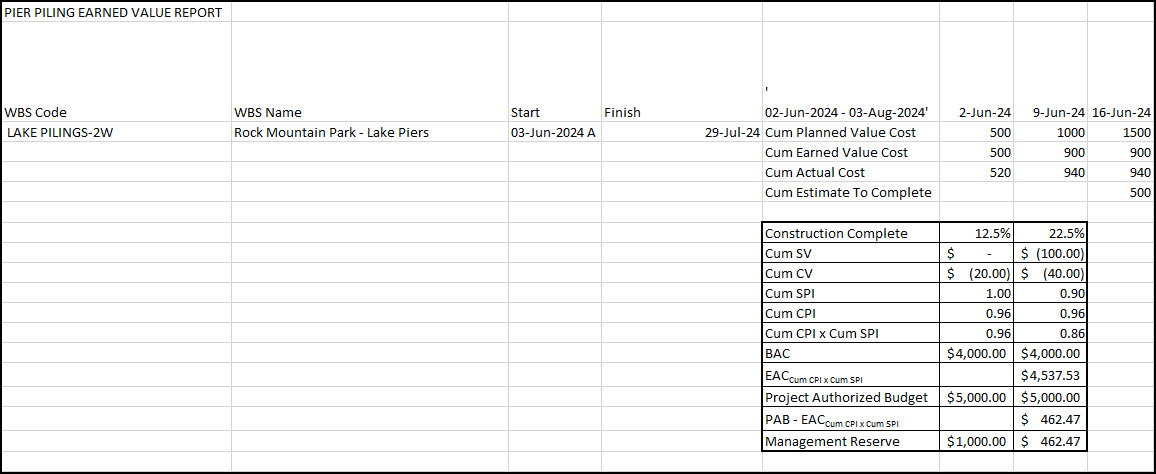 Figure 13
Figure 14 is a table of the pertinent metrics and funding outputs to answer our budget inquiry.
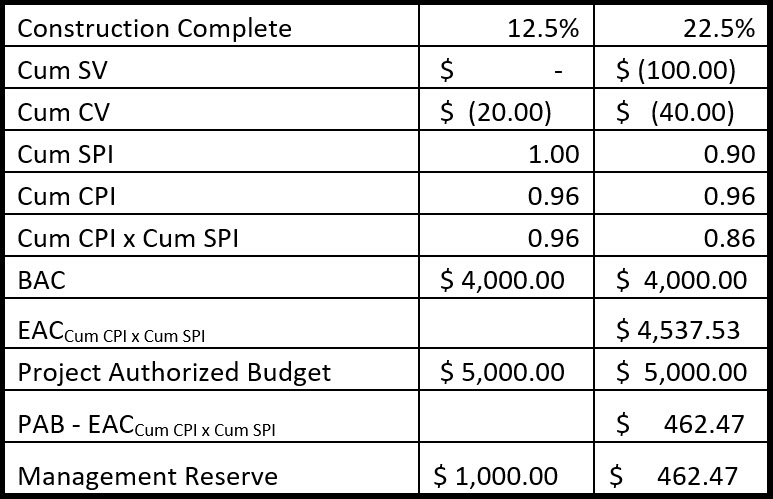 Figure 14
After 22.5% construction the CPI remains stable for the remainder of the project, and the performance factor Cum CPI times Cum SPI equals 0.86. The EACCum CPI x Cum SPI becomes $4,537.53. The predicted remaining management reserve after realigning the schedule to achieve the deadline is $462.47. This confirms that there is sufficient management reserve to fund the schedule realignment and achieve the desired completion date.
Summary
Primavera P6 Professional features can harvest the required data values (cum PV, cum EV, cum AC, and BAC) from a progressing schedule to compute the forecasted EAC. This helps the scheduler answer the project manager’s funding inquiries. A common request is to compute the EAC when the schedule is underperforming, and the project manager is willing to sacrifice cost to achieve schedule for the same scope of work. This is the worst-case scenario for EAC where resource effort, and, therefore, cost increases to achieve the schedule.
The performance factor for this EAC prediction is the cumulative CPI times the cumulative SPI. The logic behind adjusting the CPIcum by multiplying it by the SPIcum is that the continued CPIcum deterioration to realign the schedule is proportionate to the to-date schedule underperformance.
Forecasting requires cumulative data values, which the scheduler can capture using the Primavera P6 Professional reporting tools. P6 Professional exports to Microsoft Excel. Then the scheduler can utilize the tools in Excel to find the remaining management reserve at the conclusion of the schedule realignment.
Further reading recommendations:
- Stratton, Ray W. “The Earned Value Management Maturity Model”, Leesburg, Management Concepts, 2006.
- Flemming Quention W. and Koppleman Joel M. “Earned Value Project Management”, Newtown Square, Project Management Institute, 2010.