 We recently received an email asking how to show on the Primavera P6 Gantt chart, baselines for Level of Effort tasks. This can readily be done in a few ways. Let’s take a closer look at how to do this.
LOE tasks are distinct from Task Dependent tasks in that their work does not directly produce a deliverable. Their duration is also based on its underlying tasks, and their duration will extend and compress in response to changes in these associated tasks. Like Task Dependent activities they consume project resources. As the project schedule is calculated to find the critical path P6 automatically updates the LOE task’s cost loading.
This article demonstrates a quick tip to display baselines for Level of Effort tasks on the Gantt chart.
We have below in Figure 1, our demonstration project schedule that shows three weeks of progress updates.
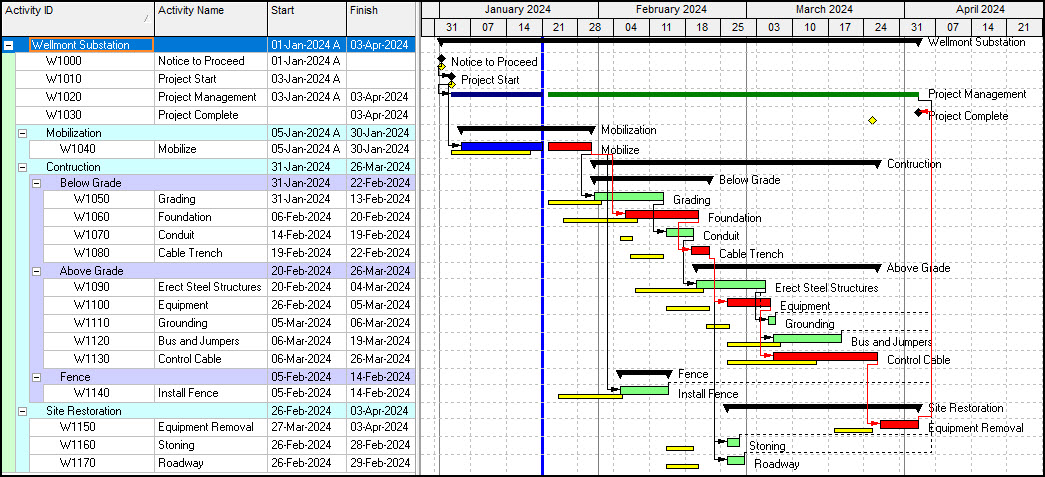 Figure 1
Yellow baseline bars appear for Task Dependent activities and yellow diamonds for milestones, but there is no baseline bar shown for the W1020 project management LOE task. The project management LOE task ties into project start and project complete milestones.
Its performance therefore can be gleaned from the relation between the project complete baseline milestone and the current milestone. A yellow baseline bar on the project management LOE would provide confirmation on the performance of the project management effort.
Let’s now proceed to include a baseline bar for the project management effort. Choose the bars icon in the layout tool group, Figure 2, (or choose View | bars).
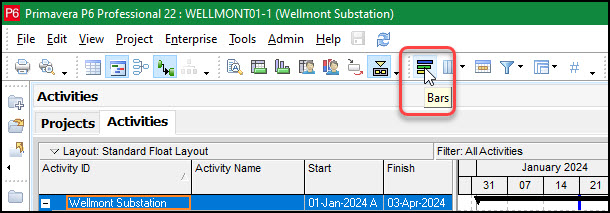 Figure 2
Figure 3 displays the bar definitions for the Gantt chart graphics.
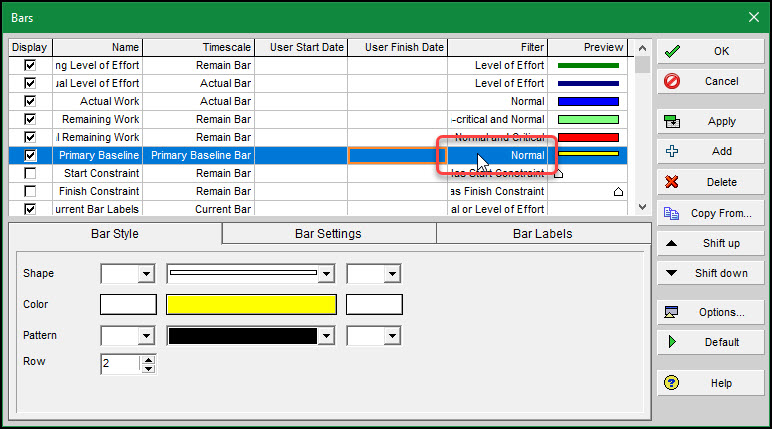 Figure 3
The secret to quickly include a baseline bar for the LOE tasks is to modify the filter for the primary baseline bar definition. In Figure 3 we double click on the filter field for the primary baseline bar definition. Figure 4 displays the filter feature.
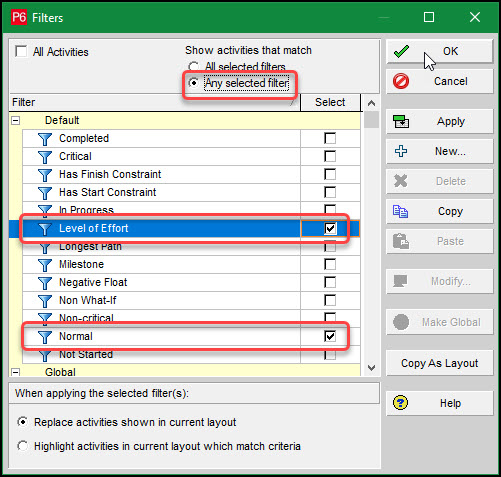 Figure 4
In Figure 4 we select both the Normal and Level of Effort filters. Because we have selected two filters the matching criterion for filters becomes important. When the matching criterion is ‘All selected filters’ it is like putting an ‘And’ conjunction between each selected filter; the respective tasks must meet all the filter criteria for each currently selected filter. If we left the matching criterion as ‘All selected filters’ no yellow baseline bars would appear because a task cannot be both Normal and Level of Effort.
So, we chose the ‘Any selected filter’ criterion. This is like placing an ‘Or’ conjunction between each selected filter. For our primary baseline bar definition this means that a baseline bar displays if the task is either Normal or Level of Effort. This is a less stringent criterion and is what we want. Again, we select the Normal and Level of Effort filters with the ‘Any selected filter’ matching criterion.
The updated primary baseline bar definition is displayed in Figure 5.
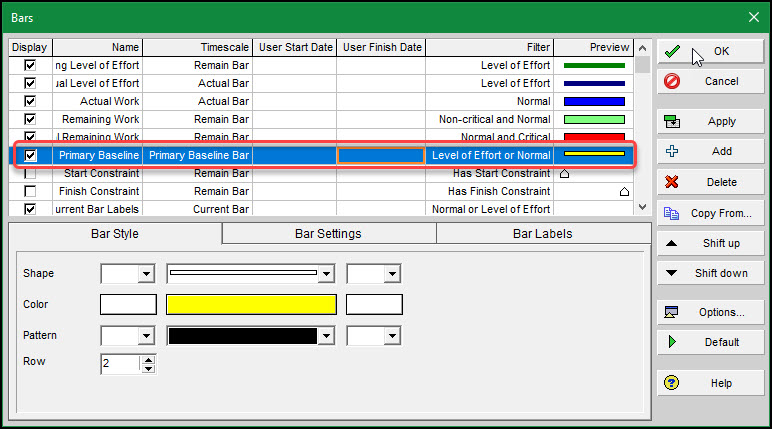 Figure 5
We choose OK, and the schedule with LOE baseline displays in Figure 6.
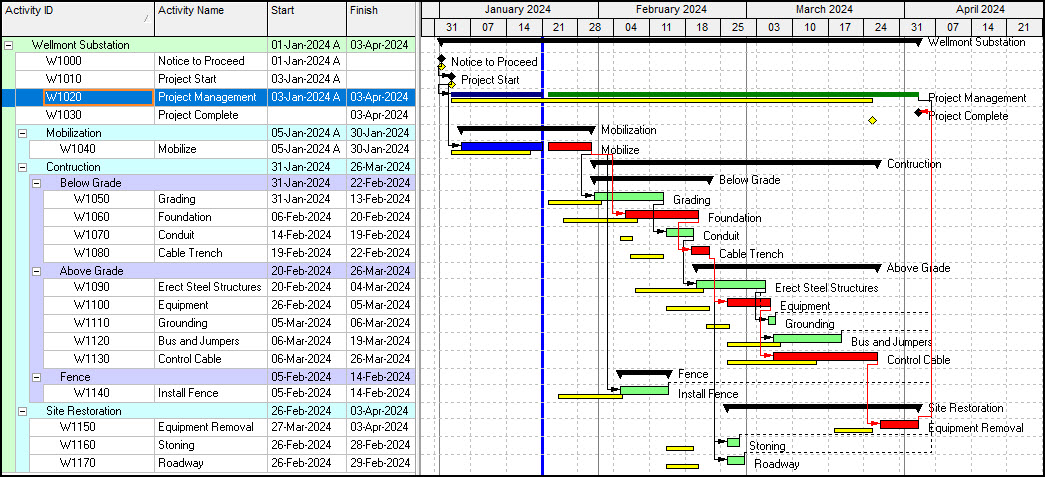 Figure 6
Note the yellow bar below the project management LOE, which aligns with the project complete baseline milestone. This LOE baseline provides affirmation that the project is behind schedule.
Summary
Including baselines for Level of Effort tasks makes sense. It provides confirmation on the progress of the LOE efforts underlying tasks.
The simple trick to include LOE tasks in the primary baseline is to select both the Normal and Level of Effort filters for that bar definition. Then it is of utmost importance to change the matching criterion for the selected filters from ‘All selected filters’ to ‘Any selected filters. The former makes no sense and will never capture any tasks. The latter works for capturing a task if it is either a Normal task or LOE task.
Another way to display a LOE baseline in Primavera P6, is to create a whole new and separate bar definition solely for LOE tasks. This bar definition would just have one filter to capture LOE tasks for the respective yellow baseline bar.