Primavera P6 has a rather useful feature that allows you to suspend work on an activity and display that suspension on the Gantt chart. Here is an example scenario. You have an excavation project to dig a trench. During the excavation process your construction crew encounters large boulders that will require a bigger backhoe to dislodge and remove from the trench. Of course, this will necessitate a weeks’ time to acquire the bigger backhoe and get it on site for the excavation work. How do you account for this suspension of work and week’s time of non-activity on your construction project?
This article describes how Primavera P6 can display both non-work weekend time and non-work activity intervals on the Gantt chart.
Calendar and Activity Non-Work Interval Settings
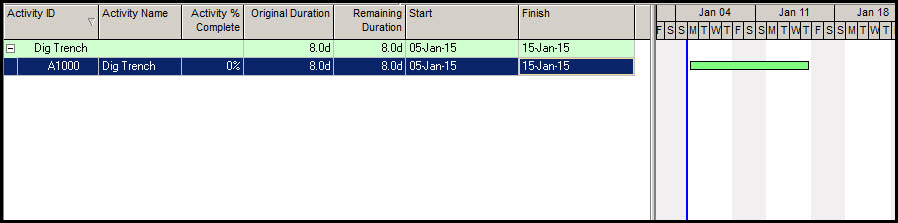
To start your schedule you have your Dig Trench activity. This is scheduled to take 8-days duration, as displayed in Figure 1.

Figure 1
Your workweek schedule is 10 hours per day for four days (40 hours). Primavera P6 enables you to show the three-day weekends of non-activity as a narrow neck on the Gantt chart. To do this, select the Bars icon in the Layout tool group at the top of the screen. You may also select View | Bars from the drop down menu at the top of the screen. Highlight the Non-Critical Work Bar, and make sure its Timescale is set to Remain Bar. Also, for the Bar Necking Settings in the Bar Settings tab at the bottom of the screen select both Calendar non-work time and Activity non-work intervals. Do the same for the Critical Work bar and Actual Work Bar, Figure 2.
Figure 2
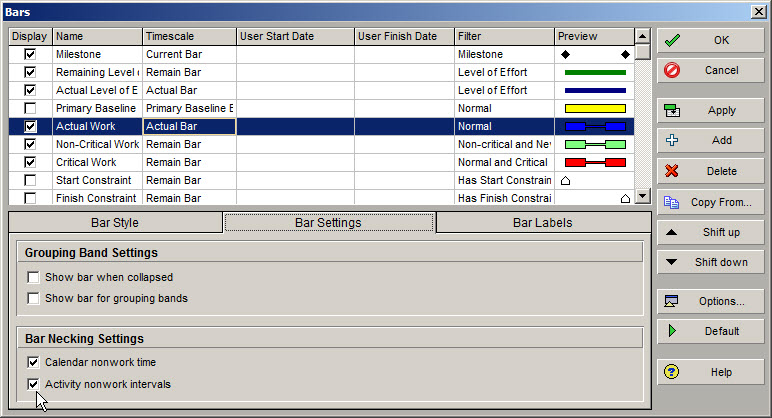
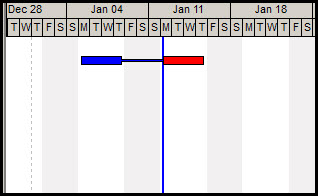
Note though that the timescale for the Actual Work Bar should be set to Actual Bar. The Calendar non-work time option displays weekend non-work times as a narrow Gantt chart Bar. The Activity non-work intervals option shows non-work intervals due to schedule activity delays also as a narrow Gantt chart bar. Select Apply and the weekend non-work times will be displayed on your Gantt chart as a narrow neck, Figure 3.
Figure 3

Updating Project Work
Work initially progresses according to schedule. After one week’s work the trench is halfway complete. To describe this progress, select the Status tab in the bottom details, and check the Started toggle underneath Status and enter the Duration % of 50 percent, Figure 4.
Figure 4
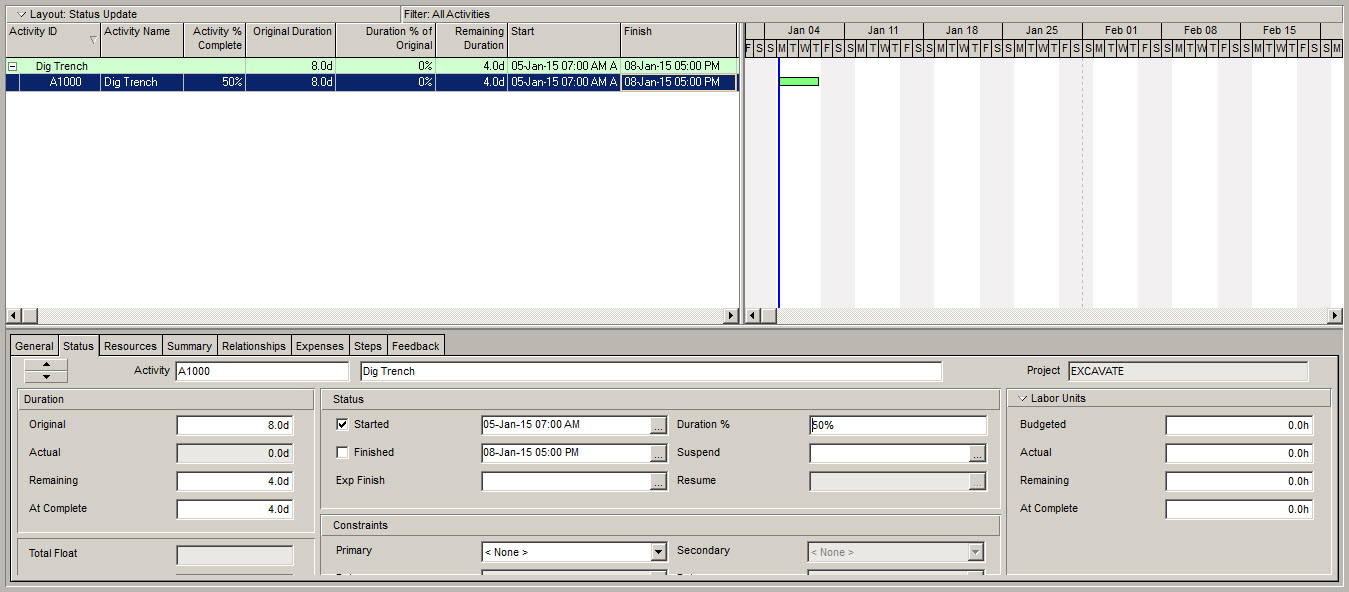
Notice the Gantt chart Dig Trench task is only showing one week’s work from the start date, but we haven’t yet advanced the data date. To advance the data date select the Schedule icon in the tools group at the top of the screen or select Tools | Schedule from the main drop down menu at the top of the screen. Advance the Data Date one week by selecting January 12th as the Current Data Date, Figure 5.
Figure 5
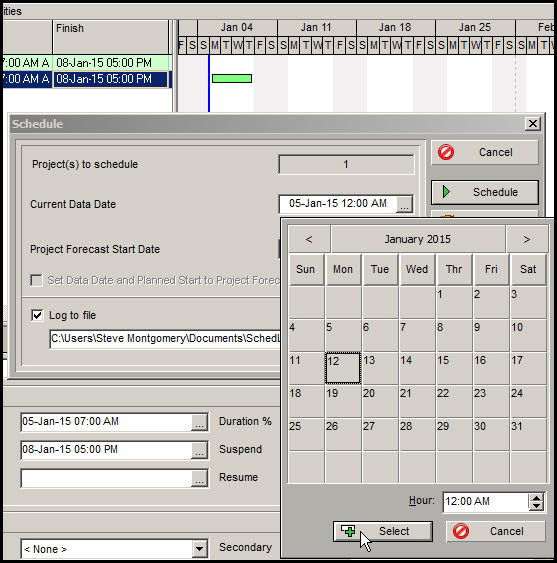
Click schedule and your Gantt chart will be as displayed in Figure 6.
Figure 6
Suspending Activity Work
Before beginning you may want to display the time of day in your Start and Finish columns, and format for dates in the below Status tab. Select Edit | User Preferences Dates tab and the 12 hour toggle underneath time at the bottom of the screen, Figure 7. This way you can make certain that activities start in the morning and end in the evening.
Figure 7

The process of suspending an activity can be done one of two ways. The first is to add a Suspend Activity and Resume Activity columns to your activities view by using the columns tool. The columns tool can be activated by selecting columns from the layout tool group at the top of the screen. You may also open the columns tool by selecting View | Columns from the main drop down menu at the top of the screen. The second way to suspend an activity is to enter a suspend date in the Suspend box in the Status section of the bottom details Status tab.
For our example suspend the Dig Trench activity by selecting Suspend in the Status section of the Status tab for bottom details. Enter a suspend date of January 12th, Figure 8.
Figure 8
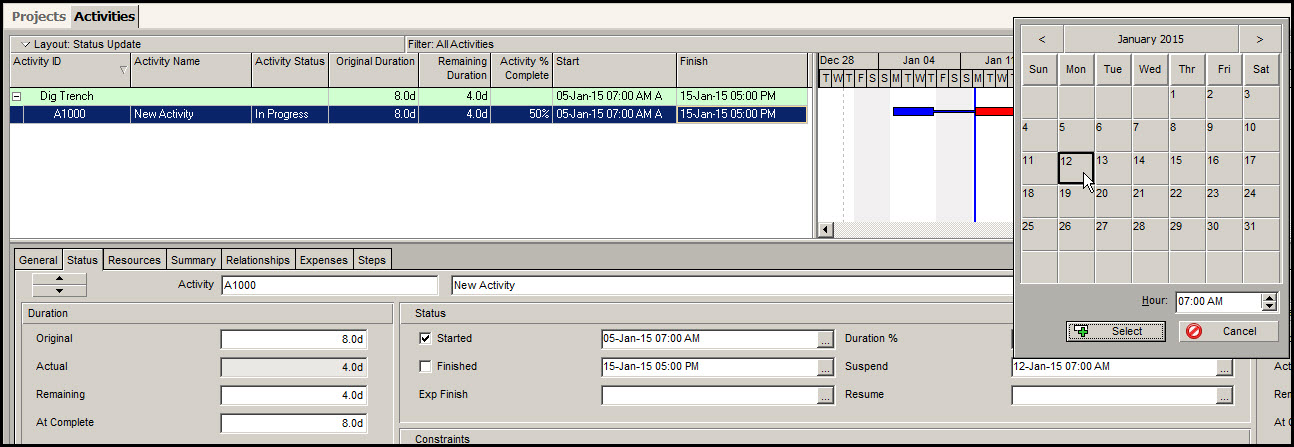
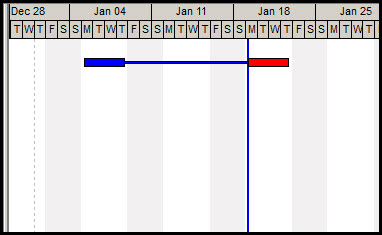
Now update the Current Data Date to January 19th, and your Gantt chart will be as displayed in Figure 9.
Figure 9
Resuming Activity Work
The work resumes on January 19th, so enter January 19th as the resume date in the Resume box, Status section, and bottom details Status tab, Figure 10.
Figure 10
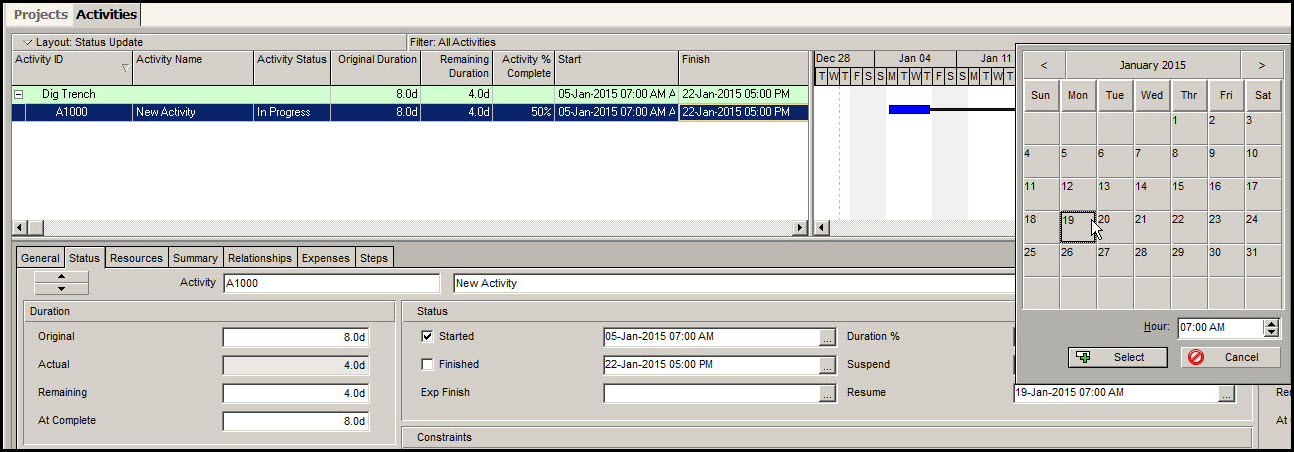
Now set the Duration % complete to 100%. Make certain to set the Finished date to January 22nd at 5pm, Figure 11. Select the Finished toggle. Last, advance the Current Data Date to January 22nd at 5pm.
Figure 11

The Gantt chart, activity view, and bottom details should now be as displayed in Figure 12. Note that your Original Duration for the task is 8-days, but it took 3-weeks to complete because of the one week schedule delay.
Figure 12
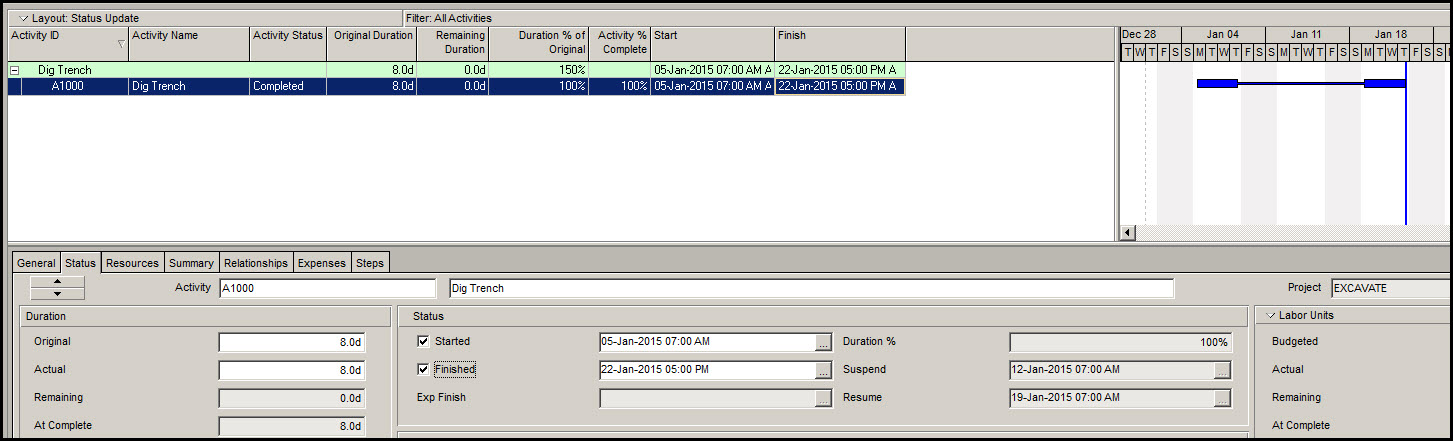
Summary
Primavera P6 provides the ability to suspend work when an issue arises that causes a non-work period delay. This allows for the schedule Duration % of Original to remain the same until work is resumed. A possible exercise is to repeat the Dig Trench activity while displaying Duration % of Original column in the activities view. With the one week delay and one week work suspension the Duration % of Original will be 100%. With the schedule delay, but without the suspension the Duration % of Original will be 150%. The suspension also provides the flexibility to reassign resources to other ongoing tasks during the period of non-activity on the originally assigned task.