 If your activity planned finish date does not coincide with its required completion date you may want to capture both dates in your schedule. Schedulers want to know both the current P6 planned end dates and their due dates.
The due date for a task is the last day it can finish without it delaying the completion date of the project. Often this due date does not match up to the current finish date of the respective activity. In P6 you can tabulate both dates in the activity table and graphically display them on the Gantt chart. In this way schedulers monitor activity projected end dates in relation to their due dates.
This article presents a quick tip to tabulate and graphically display the P6 planned end dates and their respective deadlines.
In Figure 1 we have our demonstration project schedule.
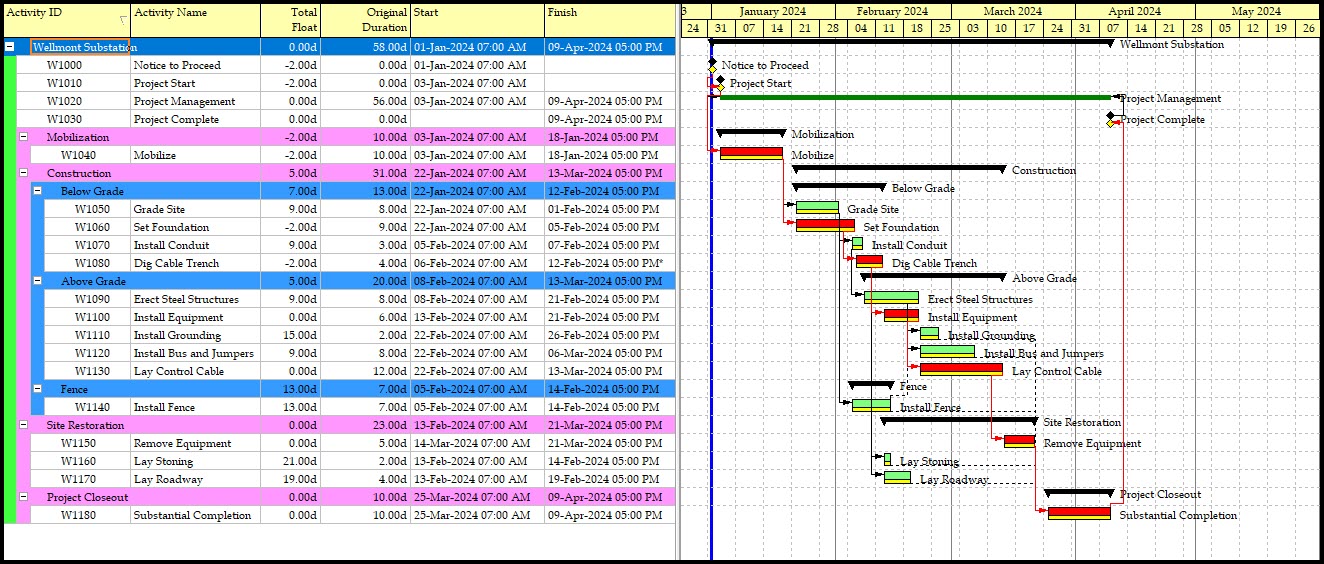 Figure 1
The demonstration schedule’s Gantt chart displays the current schedule and a yellow baseline bar. The activity table includes a Total Float column. Some activities have negative Total Float. The negative Total Float is generated by a ‘Finish On or Before’ activity constraint on ‘Dig Cable Trench’. Other activities have positive Total Float.
To find the due date of each activity sum the activity duration and the Total Float. This sum is the number of workdays from the activity start to the due date. Again, the due date is the latest each activity can conclude before it delays the project end date. We want to include a column in the activity table that lists the due date of each activity. It would also be nice to visually see this due date on the Gantt chart. In P6 we can do both.
Let us first begin by inserting an extra column to list each task’s due date. From the top dropdown menu select View | Columns. Then in the columns dialog, Figure 2, go to the dates category and select the ‘Late Finish’ option.
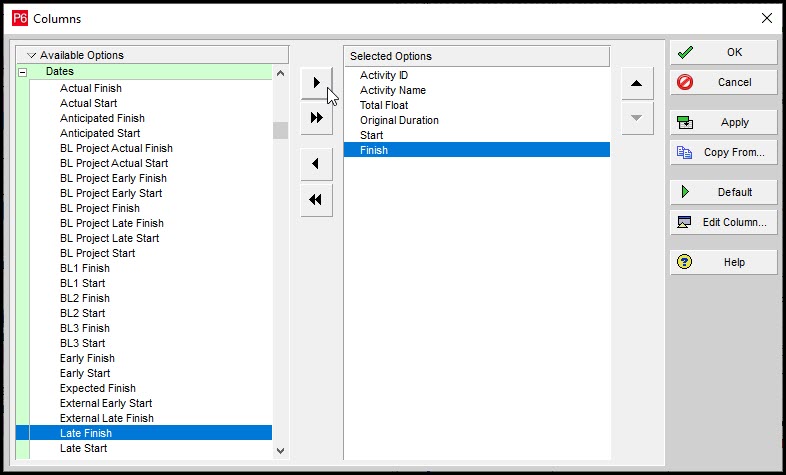 Figure 2
Click the right arrow button to move it over to the selected options, Figure 2. The ‘Late Finish’ column then is listed in the activity table, Figure 3.
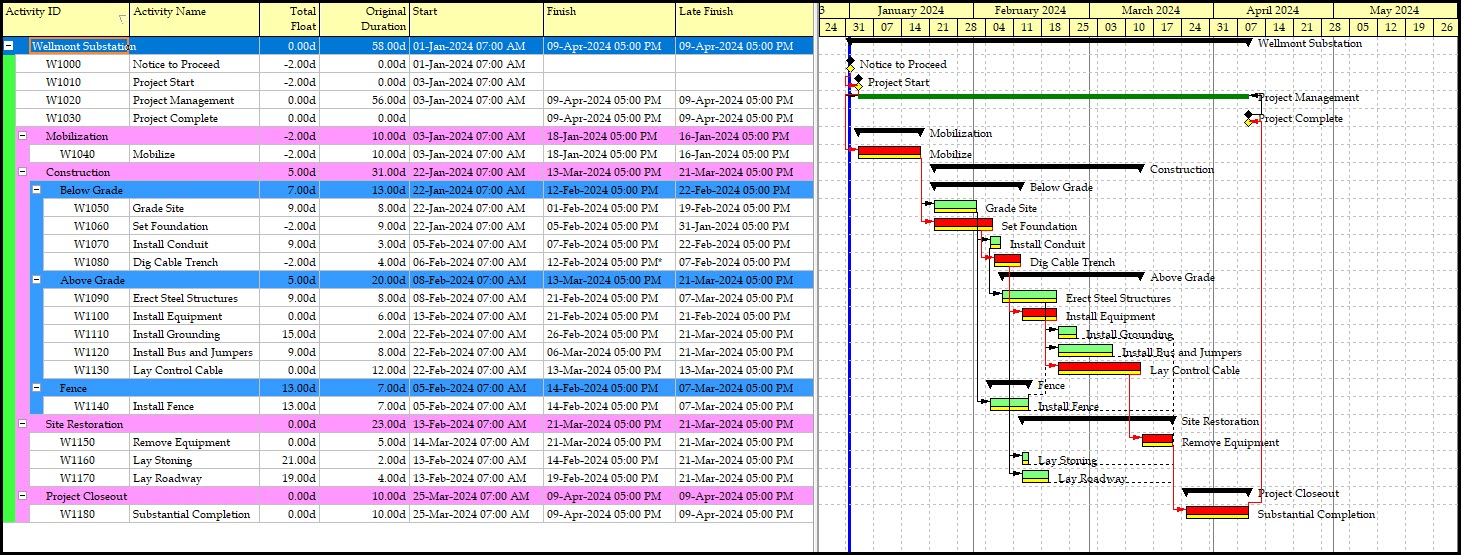 Figure 3
This ‘Late Finish’ date tells the subcontractor the last day to complete the respective activity to avoid it negatively impacting the entire project. Now we want to display this graphically on the Gantt chart. We proceed and from the top drop-down menu choose View | Bars. In the Bars dialog we choose to add another Bar definition, Figure 4.
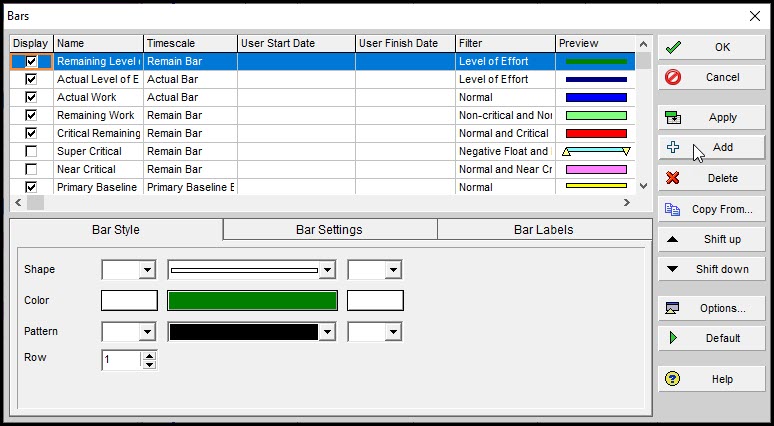 Figure 4
In Figure 5, we add a suitable name, ‘Late Bar’, choose the timescale ‘Late Bar’, filter on normal activities, make the Bar Style shape low and medium thickness and the color periwinkle, and click OK.
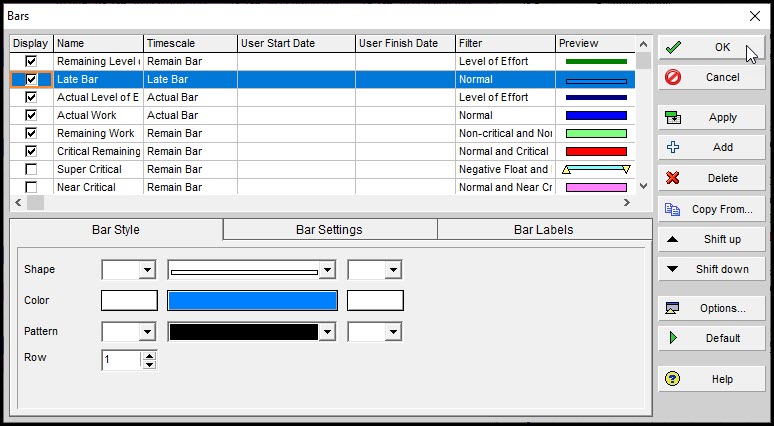 Figure 5
The Gantt chart with ‘Late Bar’ bars then displays in Figure 6.
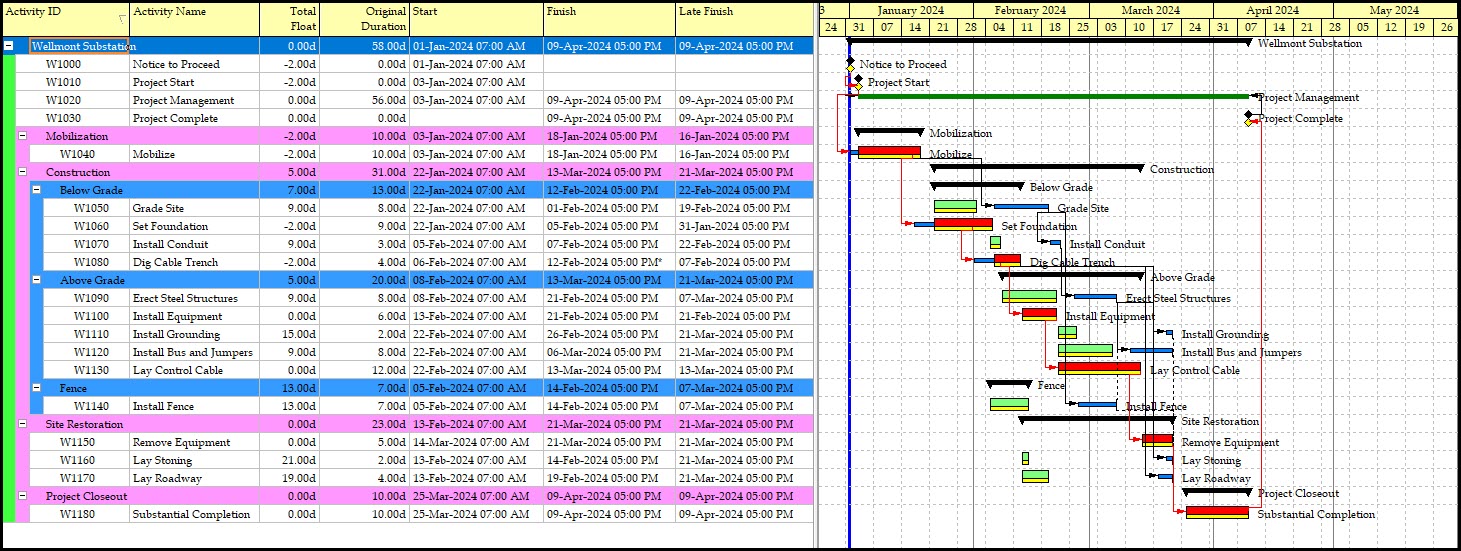 Figure 6
Well, our Gantt chart does not look quite right. What is wrong with the Gantt chart? This is the “Where’s Waldo?” question of the day. See if you can spot the Gantt chart miscue. Okay, the problem is the arrows are connecting to our newly added ‘Late Bar’ bars and not the current bars.
Why? The answer to this mystery is that where your Bar definition is in the Bar dialog list or stack of Bar definitions makes a difference. Let me explain. On the Gantt chart, relationship arrows connect to bars whose Bar definitions in the Bars dialog are higher in the stack. We therefore need to move our Bar definition lower in the stack. We proceed and use the down arrow to put it below the other Bar definitions, Figure 7.
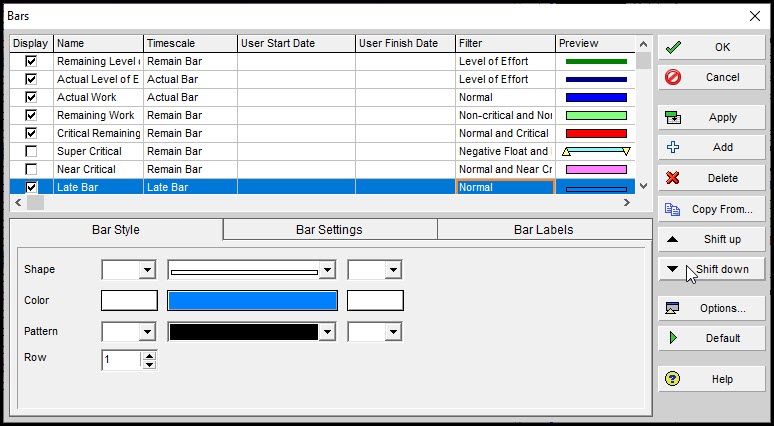 Figure 7
Now our Gantt chart arrow connections look right in Figure 8.
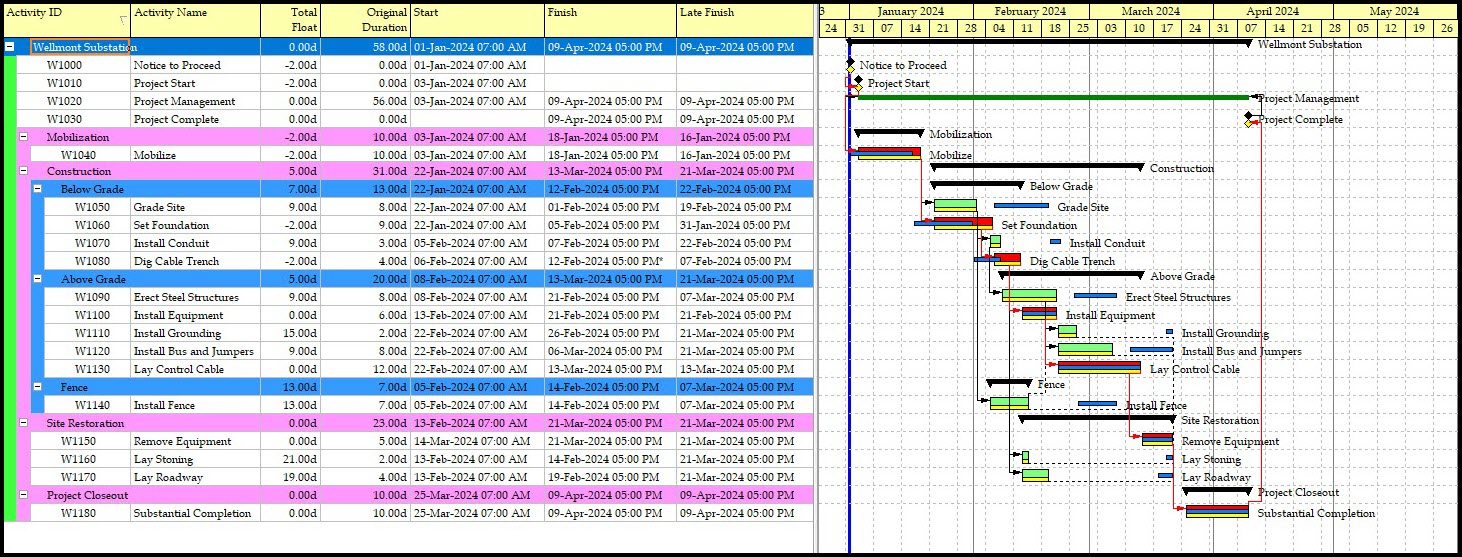 Figure 8
You may have to experiment a little with the location of your Bars definition in the Bars dialog stack to make the Gantt chart look exactly right.
Great! We can now view the task due dates on the Gantt chart and see them listed in the activity table. It would be nice to update the column header for the ‘Late Finish’ column with a more relevant column heading to indicate that it lists the ‘Due Date’ of efforts. We continue and from the top dropdown menu choose View | Columns. In the columns dialogue we select the ‘Late Finish’ option and click the ‘Edit Column’ button, Figure 9.
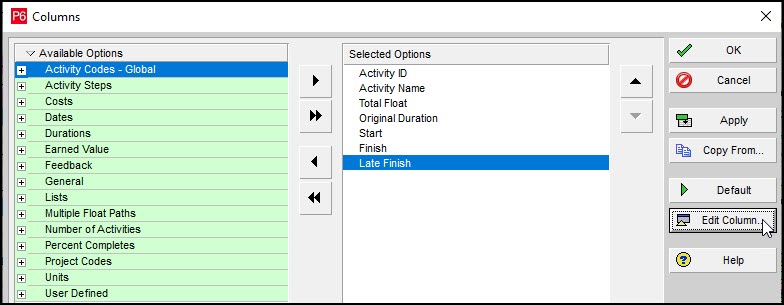 Figure 9
In the ‘Edit Column’ dialog, we enter the more appropriate title for the ‘Late Finish’ column, ‘Due Date’.
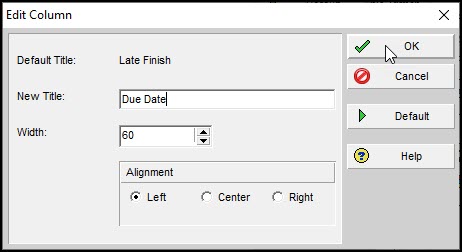 Figure 10
Figure 11 displays the final schedule ready for presenting to team members and other stakeholders.
 Figure 11
Perfect! Now we have a meaningful schedule activity table and Gantt chart. Your subcontractors or team members can see all the relevant data for each of their respective activities. This includes the activities start dates, durations, current P6 planned end dates and due dates. This is information is huge! Your subcontractors now know not only when to start, but also the all-important due dates for completing each of their tasks.
Summary
Schedulers can leverage Primavera P6 to provide team members all the pertinent details about their required efforts. The ‘Late Finish’ date is particularly helpful for team members to keep focused on. Again, this is the last date to complete the respective effort without causing postponement of the entire project.
Primavera P6 tabulates this date in the activity table and displays a ‘Late Bar’ on the Gantt chart providing team members better understanding of the task set before them, and its relationship to other schedule activities.
Schedulers may also personalize the column headings to make them more suitable for their team members understanding. In this way schedulers leverage P6 practically to support communicating efforts to subcontractors and other members of the project team.