Schedulers often love the feature where you can display two baselines in Microsoft Project. In fact, you can display multiple baselines on the Gantt chart. The initial baseline is typically used as a snapshot at the start of the project which shows work, forecasts, duration and cost against what happens as the project progresses.
A second baseline can used by schedulers and project managers to evaluate project performance over time by comparing the initial project baseline (or snapshot) with any variations captured as the project progresses.
Microsoft Project has the capability for schedulers to create multiple baselines and display them in the Gantt chart. Multiple baselines can be used as snapshots to monitor changes to the original project plan whilst the project is in motion.
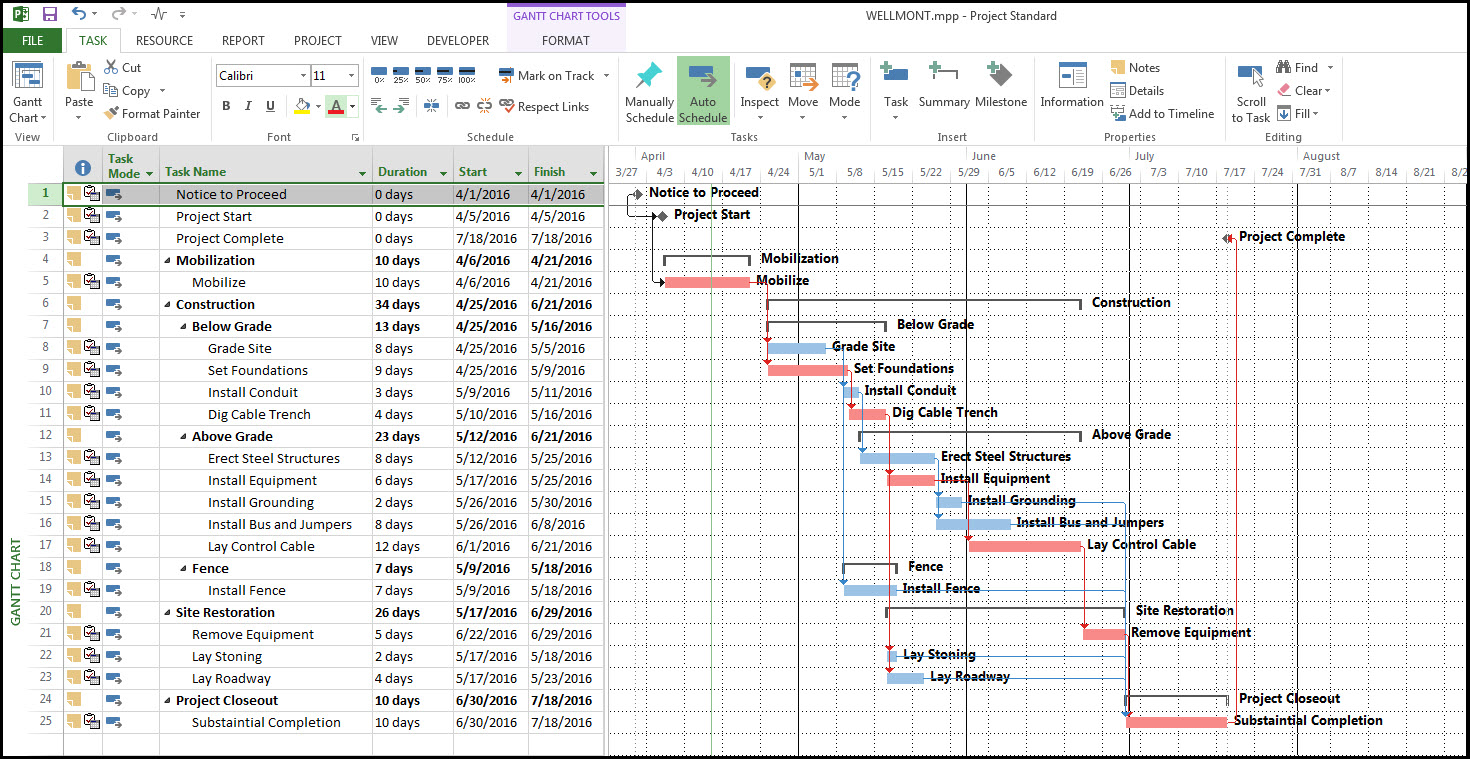
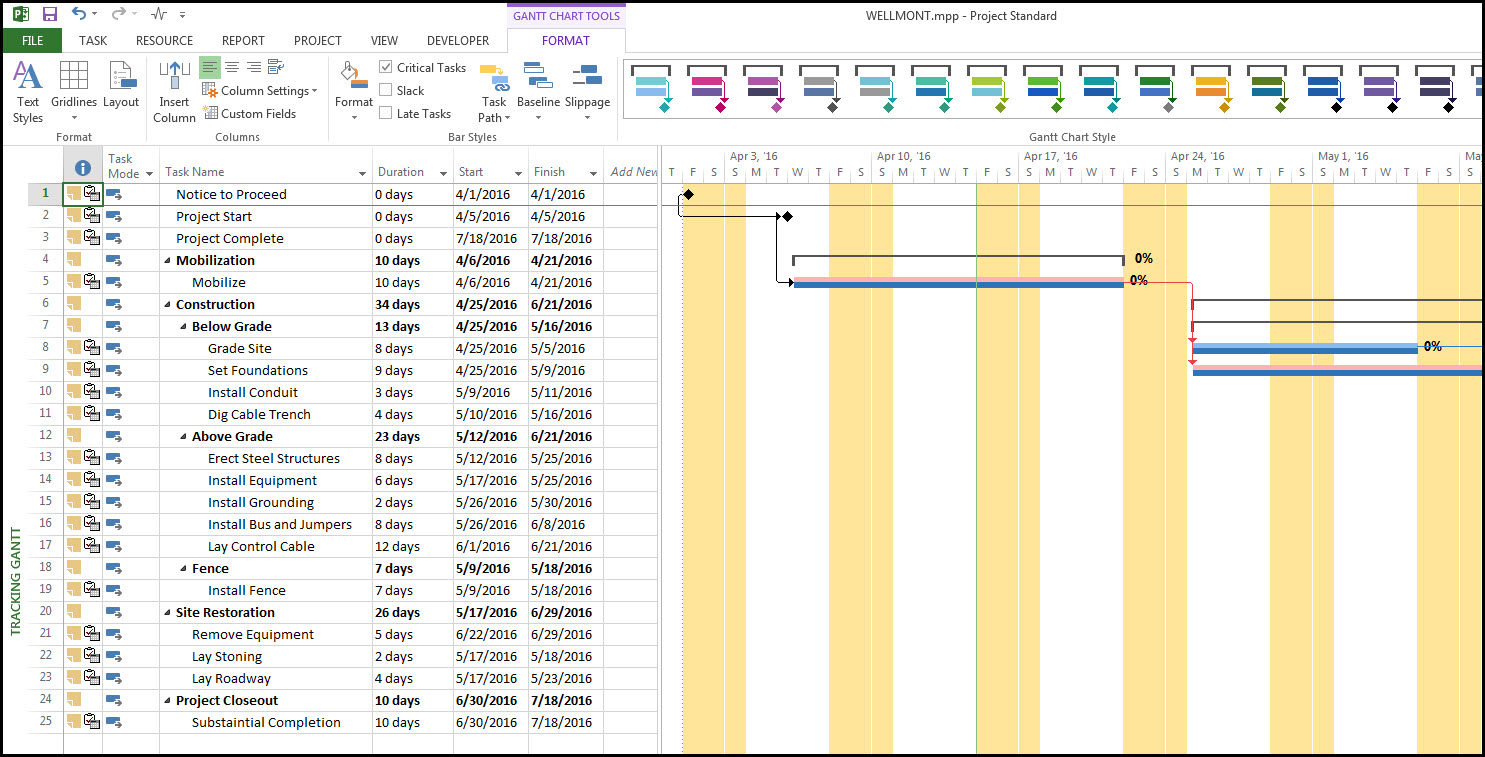
Here we’ll demonstrate how to create two baselines in Microsoft Project and display them on the Gantt chart. In figure 1 below, we have our demonstration project schedule.
 Figure 1
We want to display our initial baseline which will be used as the original forecast for our project plan and then as our project progresses display a second baseline to check that our project is still on track.
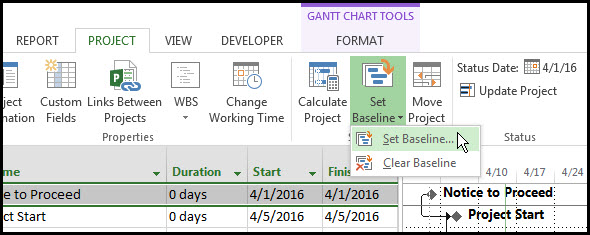
First, we select the project tab from the properties ribbon and click on ‘Set Baseline’ to create our initial baseline as in Figure 2.
Figure 2
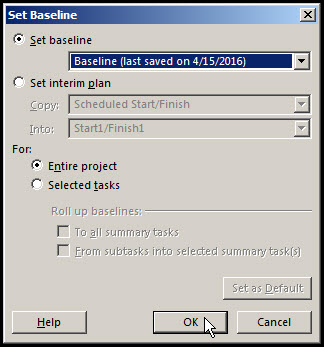
In the ‘Set Baseline’ dialog box we check both the ‘Set baseline’ and the ‘Entire project’ and ‘OK’ it, as in Figure 3.
Figure 3
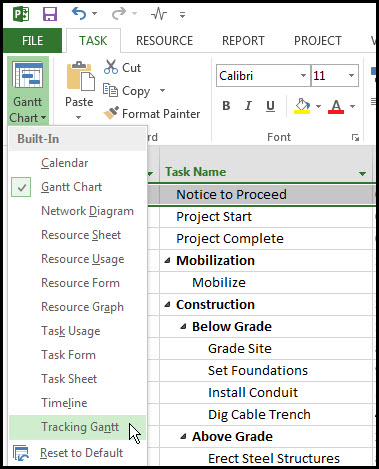
We have now created our initial baseline. To view our baseline on our Gantt chart we select the ‘Gantt Chart’ and scroll down the list to select ‘Tracking Gantt’ as in Figure 4.
Figure 4
And, in Figure 5 we have our schedule with our initial baseline, displayed in blue.
Figure 5
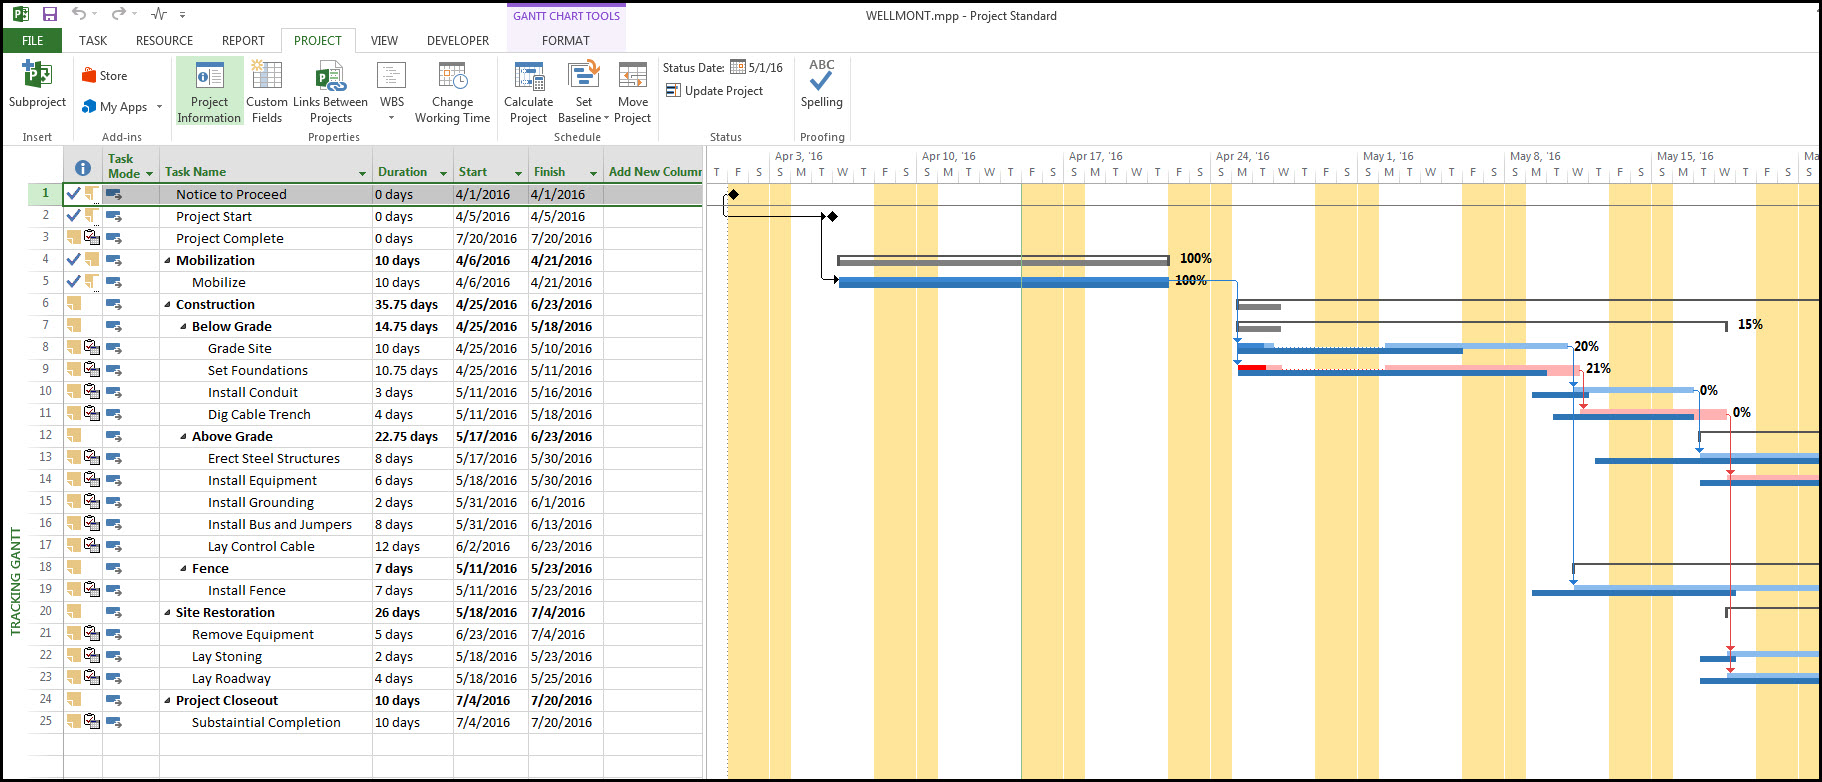
By progressing our schedule along to May 1st, 2016, as in Figure 6. We are ready to add our second baseline.
Figure 6
By following the same process we used to create the initial baseline, as in figure 3 above, we generate our second baseline. We need to differentiate our second baseline from our initial baseline, so we select the format tab and ‘Bar Styles’ as in Figure 7.
Figure 7
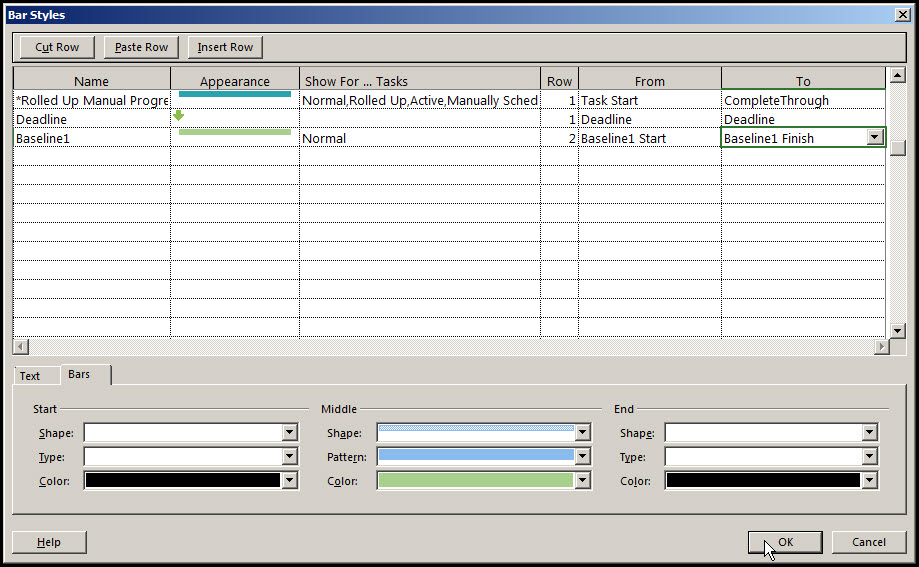
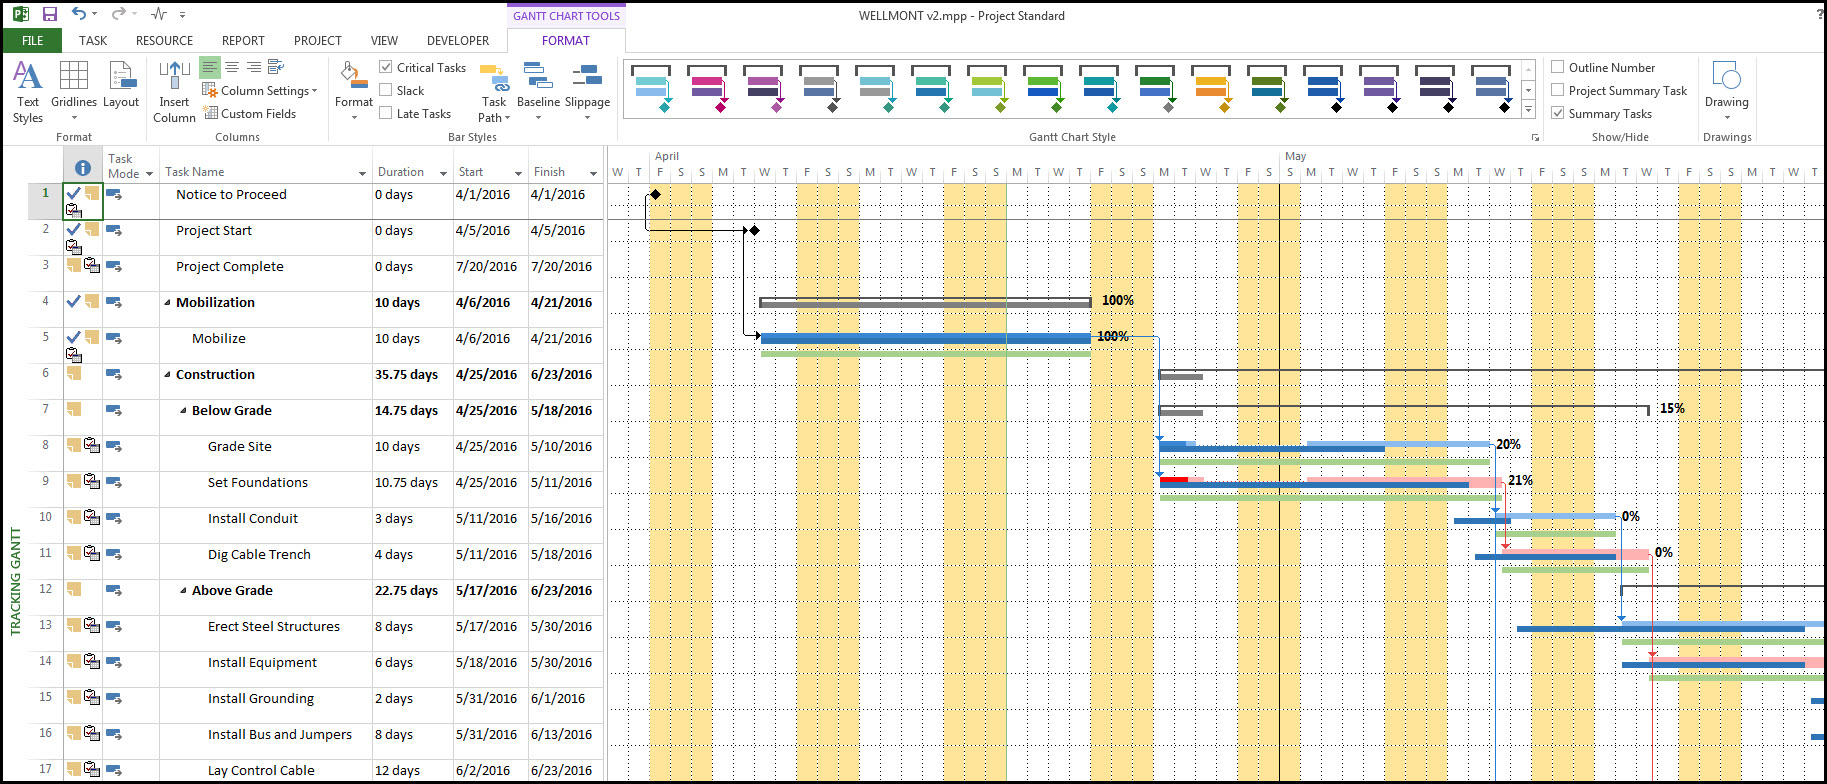
Our Gantt chart bar for our second baseline is called ‘Baseline1’. We select green to define our ‘Baseline1’, in the ‘Row’ we add 2 so that the baselines are not on top of each other in the Gantt chart. We enter ‘Baseline1 Start’ in the ‘From’ column and ‘Baseline1 Finish’ in the ‘To’ column and when we click ‘OK’ our two baselines are displayed in our Gantt chart in Figure 8 below.
Figure 8
Summary
It is important when adding baselines to a schedule to remember to define the column width so that the baselines do not overlay on each other. Defining a new baseline with color will help when it is viewed on the Gantt chart.
Microsoft Project allows schedulers to define up to four rows of baselines on the Gantt chart, which allows them to keep the initial baseline for comparison against other baselines. These snapshots help in capturing changes and variances from the original project scope and schedule.