Let’s say your project has the potential to incur a procurement delay that jeopardizes project completion. How can Deltek Acumen Risk help you consider a mitigation effort to reduce the impact of this procurement delay?
Deltek Acumen Risk provides a Monte Carlo simulation that calculates probability distributions of project completion based on numerous iterations of the project schedule. The Monte Carlo analysis may consider both duration uncertainty and risk events. In this way a duration accuracy sensitive and risk adjusted schedule is possible.
And this provides a more complete picture of the true project situation. But the story may not end here. Efforts to mitigate risk events may also be included in a Monte Carlo analysis. Mitigation may incur additional cost and time, but the reduced impact of a negative risk event may be paramount.
This article demonstrates how to include a mitigation effort using the Deltek Acumen Risk Monte Carlo analysis.
Our demonstration Primavera P6 Professional schedule is displayed in Figure 1.
 Figure 1
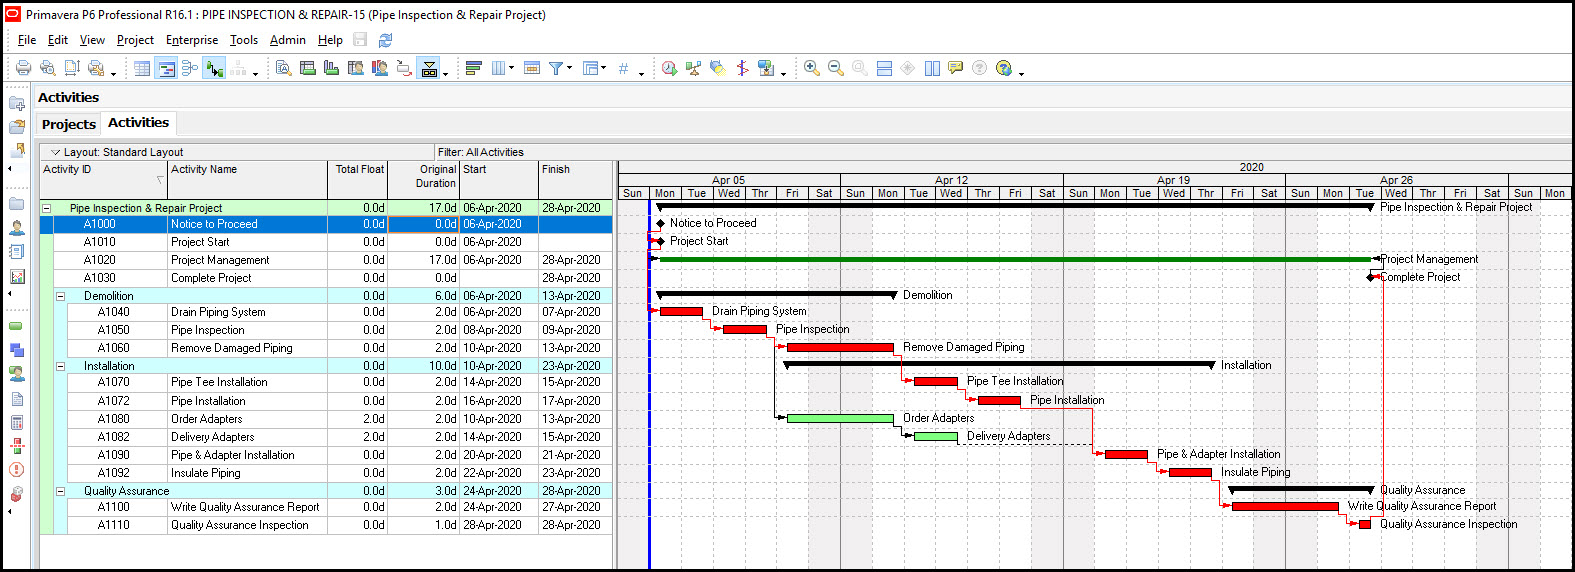
This is a short pipe inspection and repair project. The pipe is first inspected. Then the required adapters are ordered. Finally, the pipe is repaired. The pipe and adapter installation is dependent on arrival of the adapters. Any significant adapter procurement delay has a direct negative impact on schedule completion.
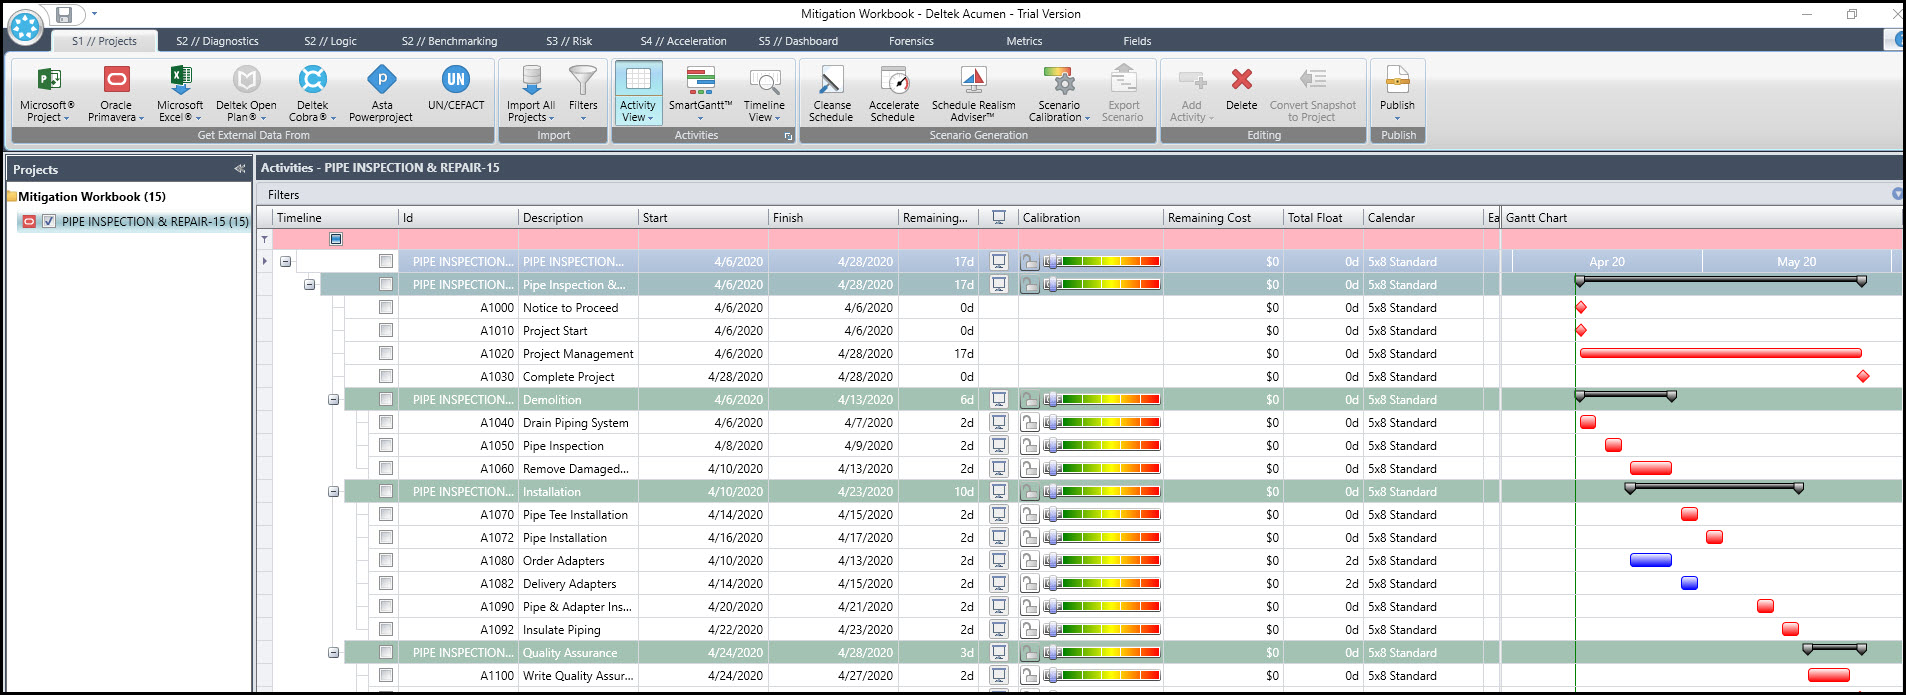
We want to run a Monte Carlo analysis of our schedule so we import the Primavera P6 schedule into Deltek Acumen Risk. Figure 2 shows the imported schedule.
Figure 2
Before we run a Monte Carlo analysis we run a schedule quality analysis on the schedule to confirm it is agreeable for a Monte Carlo analysis. Figure 3 presents a report on the schedule quality.
Figure 3
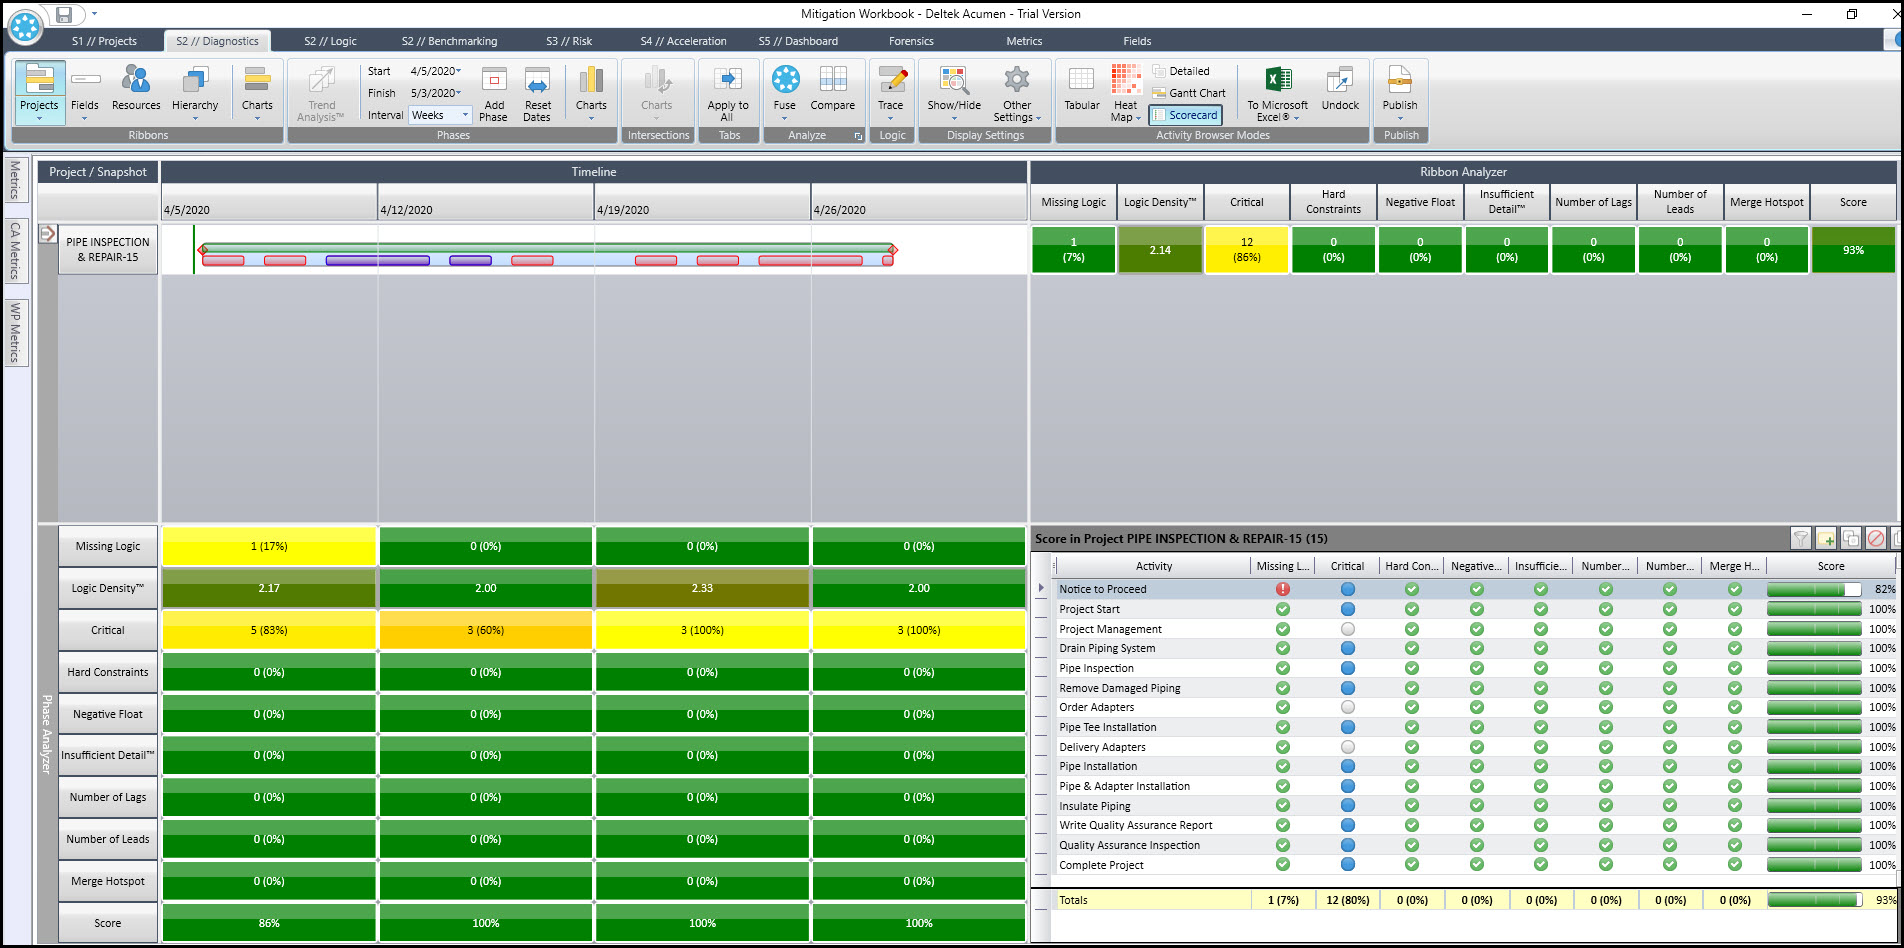
Our pipe inspection and repair project has received an overall schedule quality score of 93%, which is really good. We are ready for a Monte Carlo analysis.
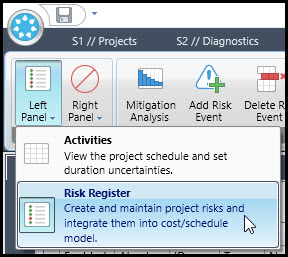
We continue and select the S3 // Risk tab. Once we are in the Risk tab we select right panel | risk register, Figure 4, to replace the Gantt chart on the right with a risk register from the Views area of the risk Ribbon.
Figure 4
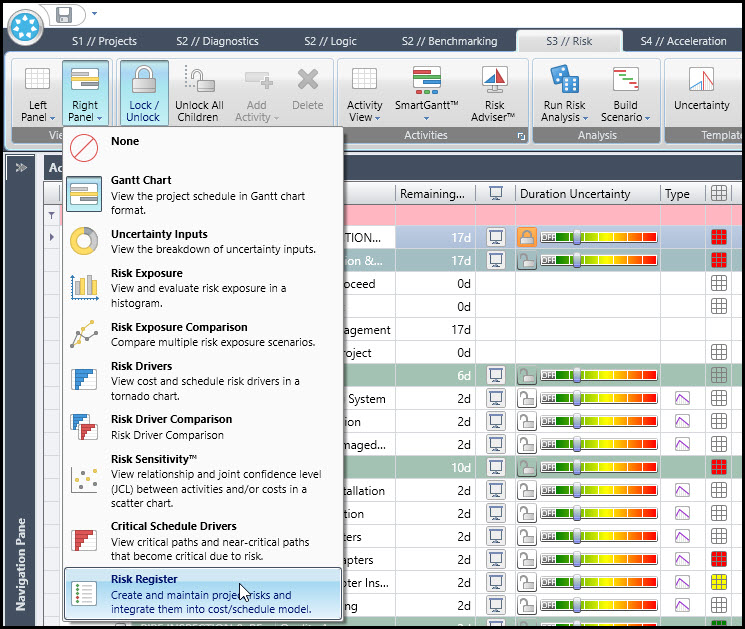
Figure 5 displays the risk register.
Figure 5
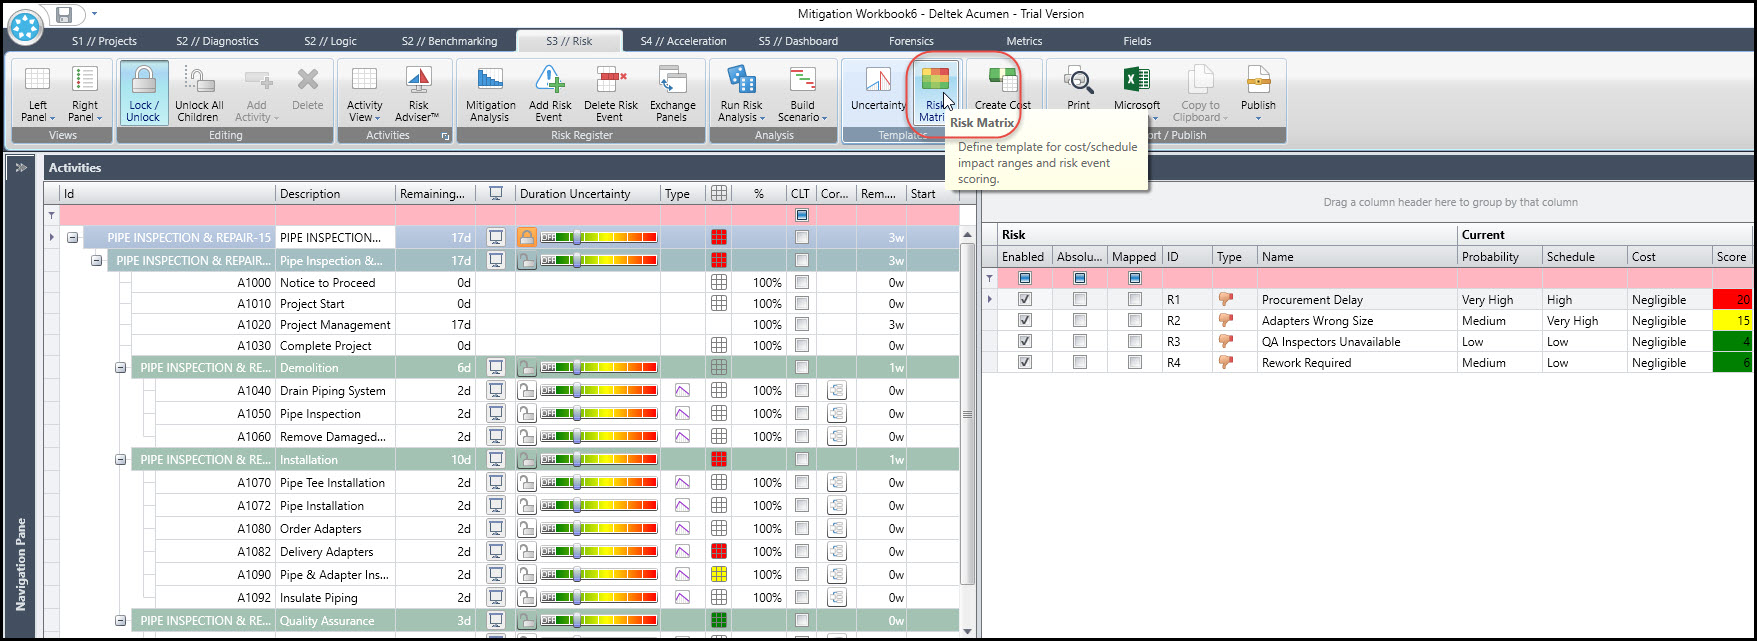
In Figure 5 we select the risk matrix icon to confirm our probability schedule impact range. Figure 6 shows the probability and impact ranges.
Figure 6
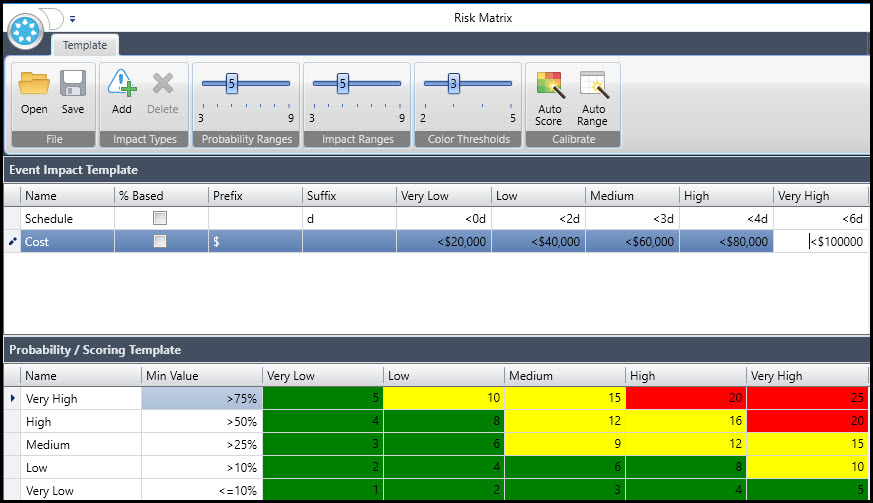
Our probabilities are fine, but the schedule range requires adjustment to the values displayed in Figure 6. This adjusts the range of schedule impact to fall in line with our short schedule. It is beyond the scope of this article to consider cost impact. All cost impacts are set to negligible so these cost values require no adjustment.
After inspecting our risk register we proceed with a Monte Carlo analysis. Note that the duration uncertainty is set to very conservative. In Figure 7 we select to run uncertainty only (no risk events).
Figure 7
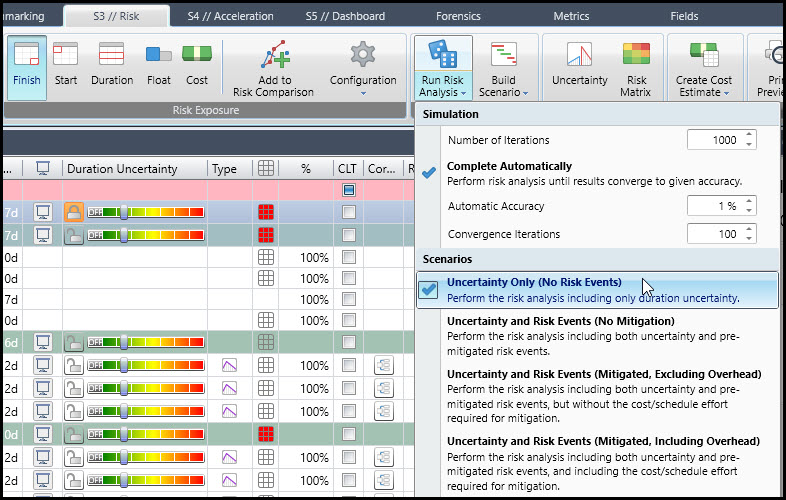
With our very conservative duration uncertainty setting we would expect our schedule to meet or beat duration estimates. We then run the Monte Carlo analysis and receive the report displayed in Figure 8.
Figure 8
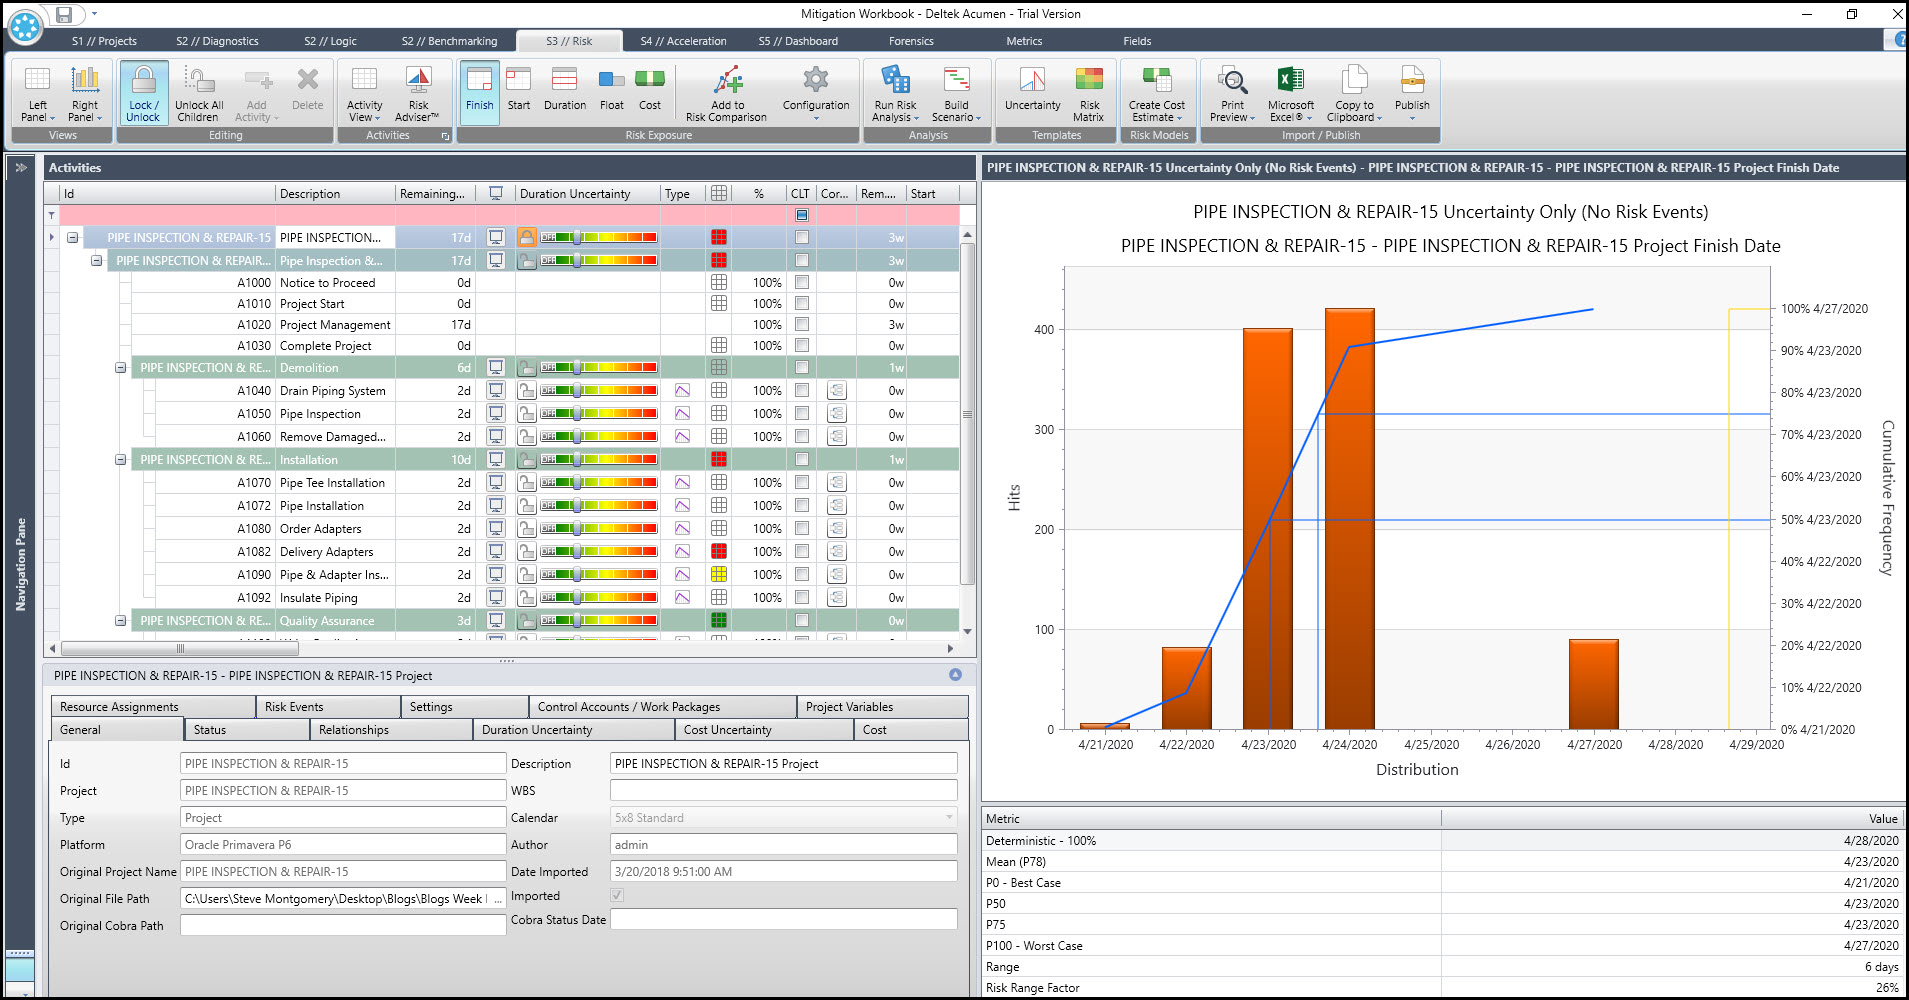
As expected our schedule met the April 28, 2020 deterministic project end date.
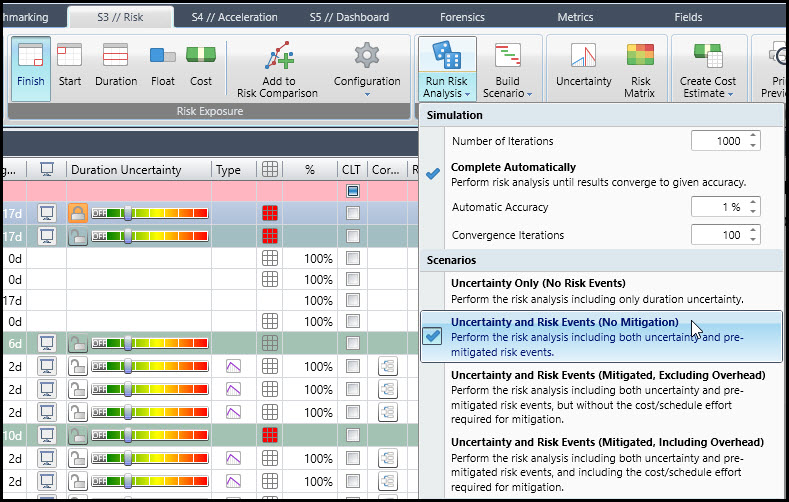
Continuing we run a Monte Carlo analysis, including both uncertainty and risk events, Figure 9.
Figure 9
The results are reported in Figure 10.
Figure 10
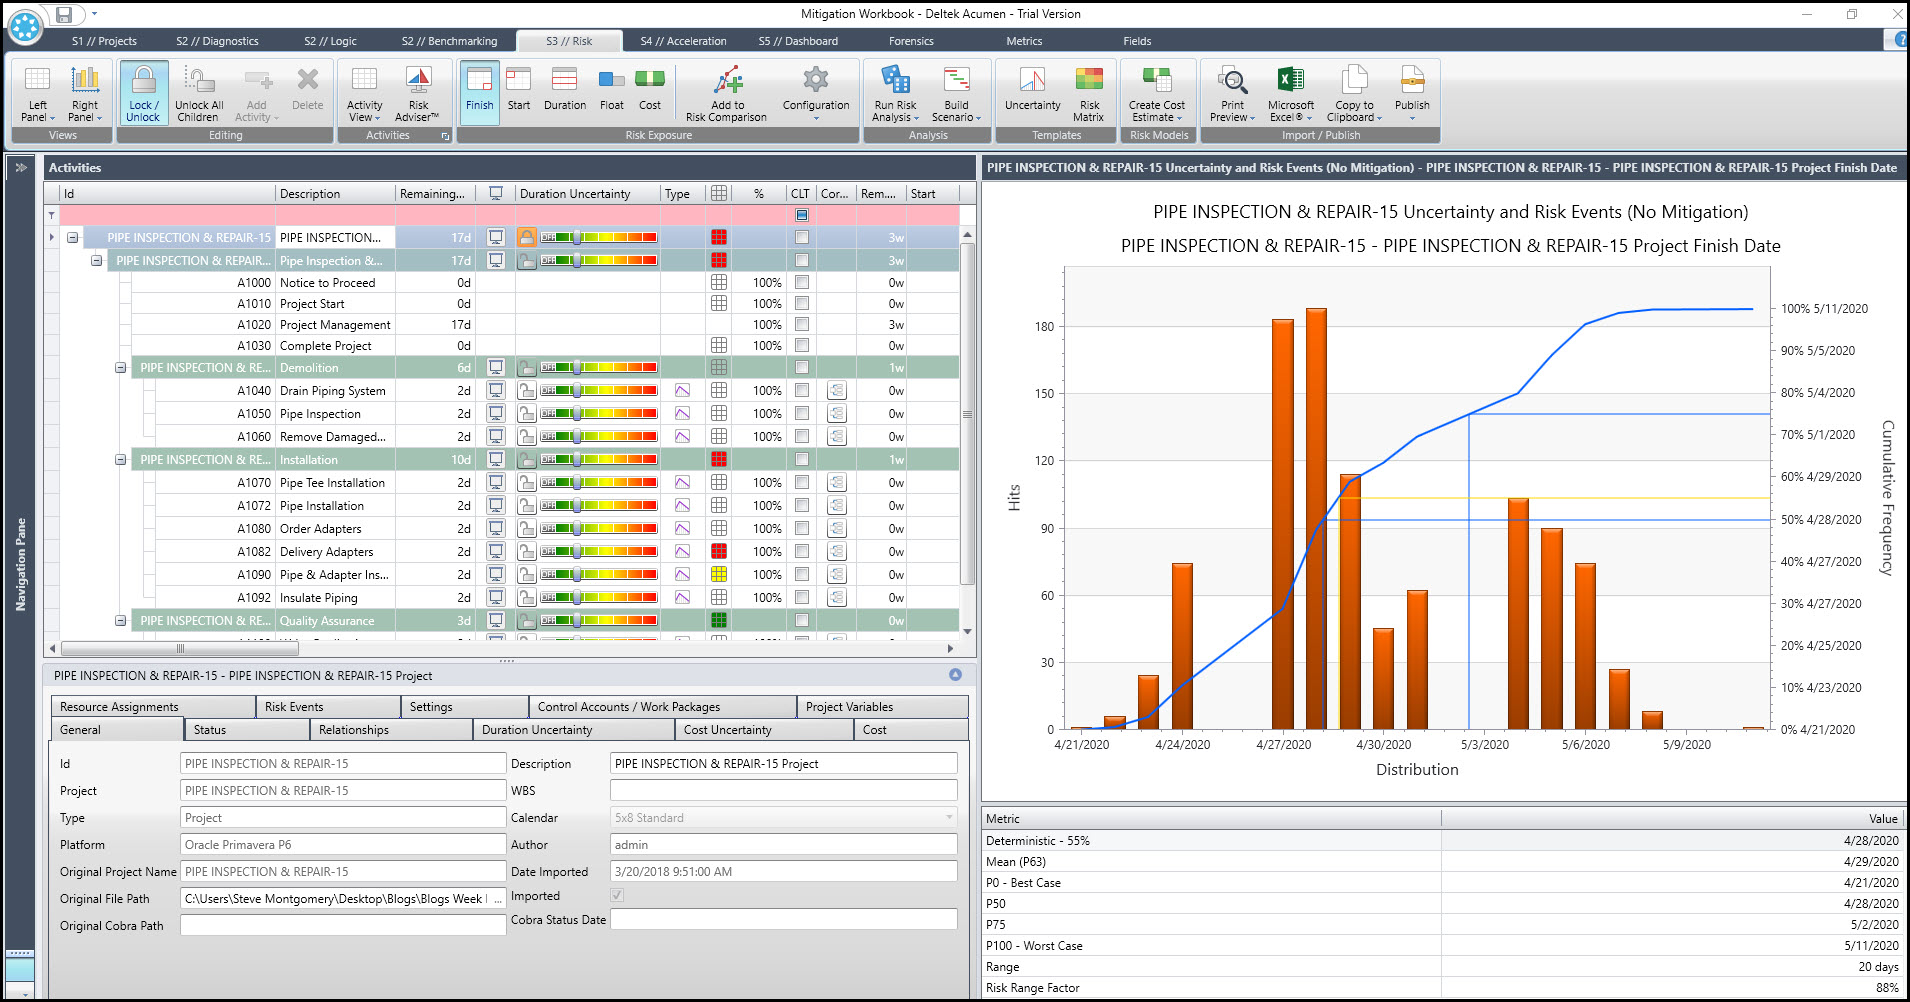
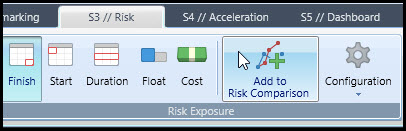
This time the April 28th, 2020 end date was achieved on 55% of the iterations. And the worst case scenario is May 11th, 2020. Risk events are demonstrating a noticeable negative impact on schedule completion. This is not good, but highly probable given our risk events. We save the data for comparison by selecting the ‘add to risk comparison’ icon, Figure 11.
Figure 11
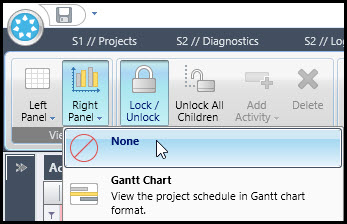
To expand the risk register we first set the right panel to none, Figure 12.
Figure 12
The left panel is set to risk register, Figure 13.
Figure 13
The risk register, including mitigation, is now fully visible, Figure 14.
Figure 14
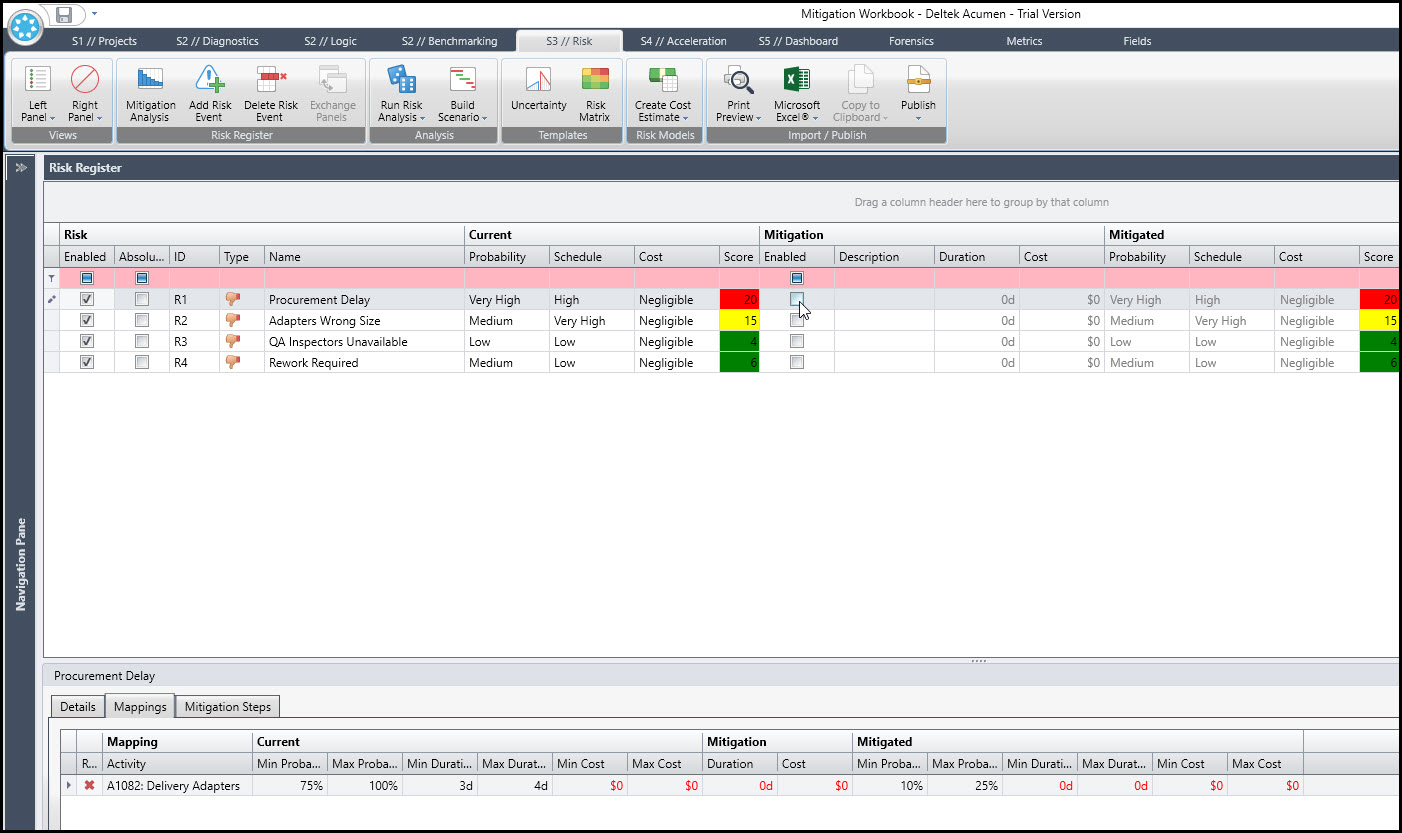
Enable the mitigation of the procurement delay risk event, Figure 14. To mitigate the procurement delay risk event we choose to pay $200 to expedite adapter delivery. Enter $200 for the cost of quick delivery, Figure 15.
Figure 15
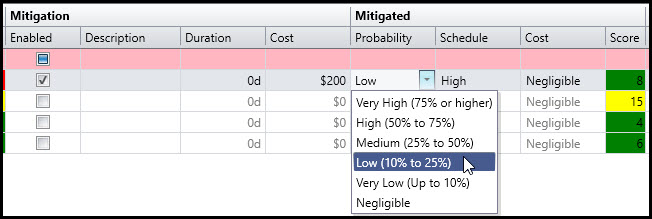
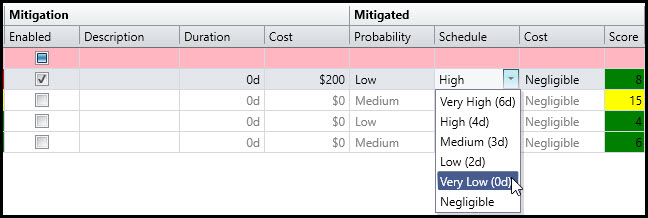
The probability, schedule, and cost mitigation values are those that the risk event values become as a result of the mitigation effort. So it’s not the probability of mitigation occurring, but an adjusted procurement delay risk event probability. The probability reduces from very high to low. The schedule impact reduces from high to very low or zero day’s impact, Figure 16.
Figure 16
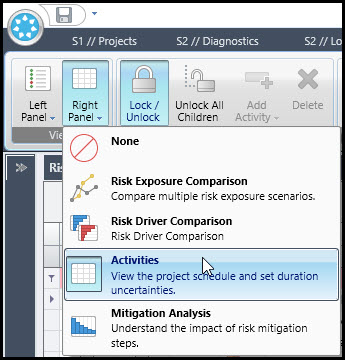
Return to the previous view by selecting right panel | activities, Figure 17.
Figure 17
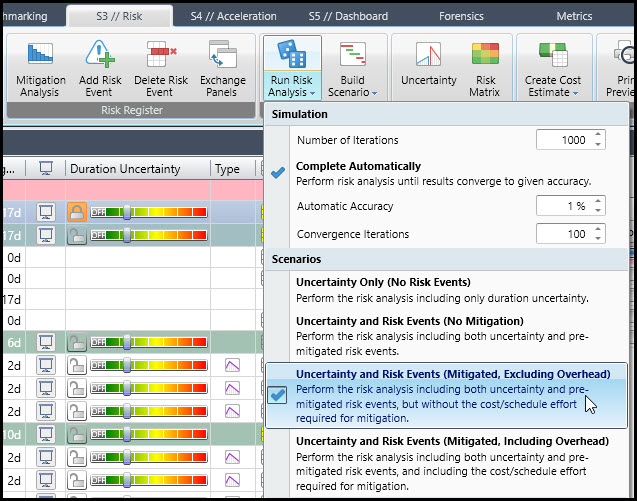
Now we set the Monte Carlo analysis to include uncertainty, risk events, and mitigation, Figure 18.
Figure 18
The analysis report is displayed in Figure 19.
Figure 19
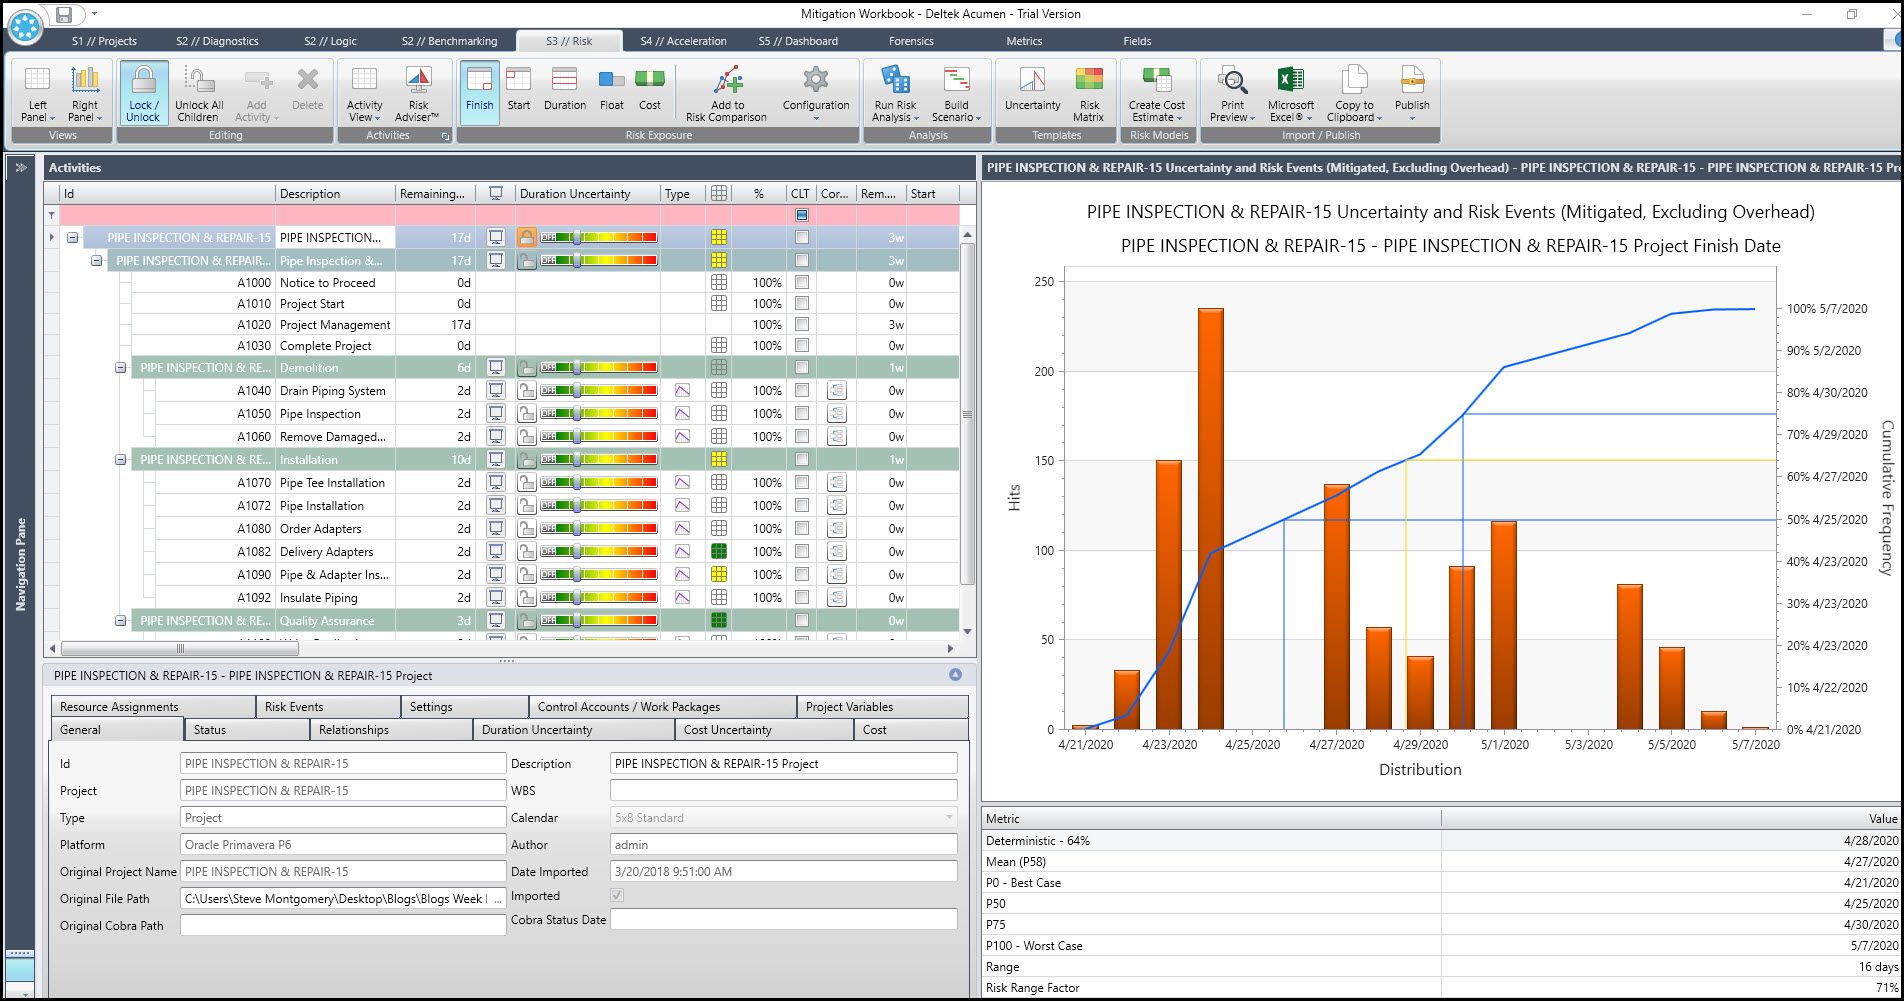
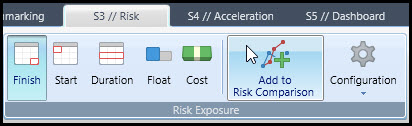
Observe from the metrics that this mitigation had a noticeable positive effect on schedule compression. Select add to risk comparison, Figure 20, to include these results in our risk comparison.
Figure 20
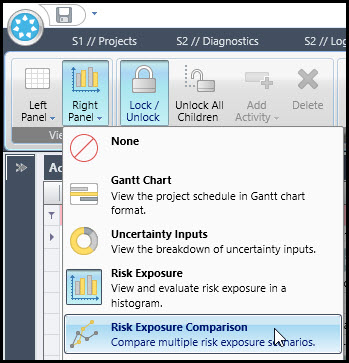
Continue and select right panel | risk exposure comparison, Figure 21.
Figure 21
The final comparison is displayed in Figure 22.
Figure 22
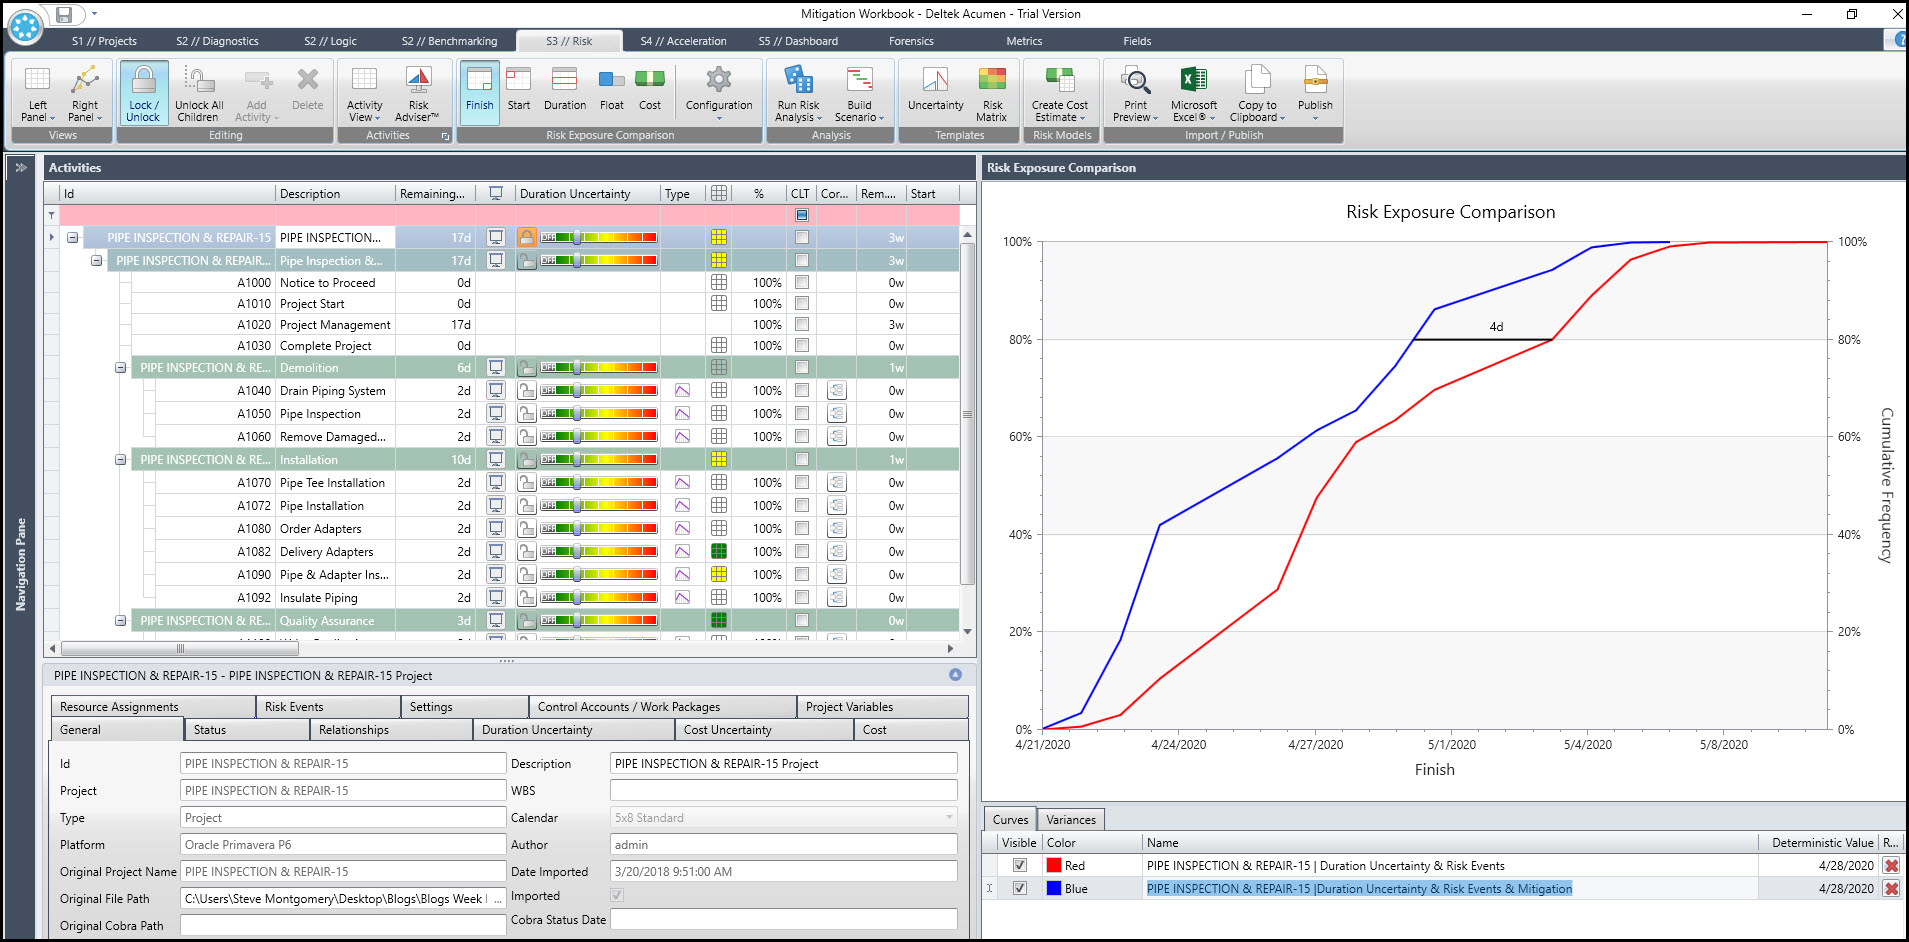
This is a graph of the Monte Carlo results S-plots. Plotted are the duration uncertainty & risk events verses the duration uncertainty, risk events, and mitigation. At 80% confidence the variance between the no mitigation and mitigation adjusted schedules is 4-days, which is significant for our short project. The procurement delay mitigation efforts are well worth the effort.
Summary
Deltek Acumen Risk provides an efficient Monte Carlo analysis feature. After risks have been entered in the register and mapped to specific activities, it is possible to run a Monte Carlo analysis of the risk adjusted schedule. Enter a mitigation effort to reduce the probability of the risk event occurring and also minimize the schedule impact if it does occur.
An analysis including mitigation is then feasible. Compare the risk adjusted and mitigation adjusted schedules in a risk exposure comparison graph. Examine the variance at your desired confidence percentage, most typically, 80%. In this way project managers can investigate the value of risk event mitigation efforts.