Are you worried that delays in your deliverables may impact your scheduled project completion date? Float monitoring is a quick and efficient way to monitor your project float in relation to the project delivery date.
It goes without saying that project managers are always looking for ways to complete the project on schedule and on or below budget. Therefore a quick and reliable way to forecast the projected completion of their deliverables is required. Tracking and comparing project float to delivery dates is possible when the finish date of the project is constrained.
After three or four updates the schedule analyst can find the project float trend. This trend can be extended and compared to the delivery date, and forecast if respective deliverable delays may impact the critical path of the project.
Project float is the number of days the deliverable can delay and still not impact the project completion date. It is therefore wise to monitor this float in relation to the delivery date. By tracking the project float through a few schedule updates we are able to find the trend. This trend can be extended and compared to the deliverable delivery date by plotting in Microsoft Excel. In this way the schedule analyst to can decipher whether the deliverable project float trend extends to an on time delivery or not.
In Figure 1 we have a Microsoft Excel plot of the deliverable project float for four schedule updates.
 Figure 1
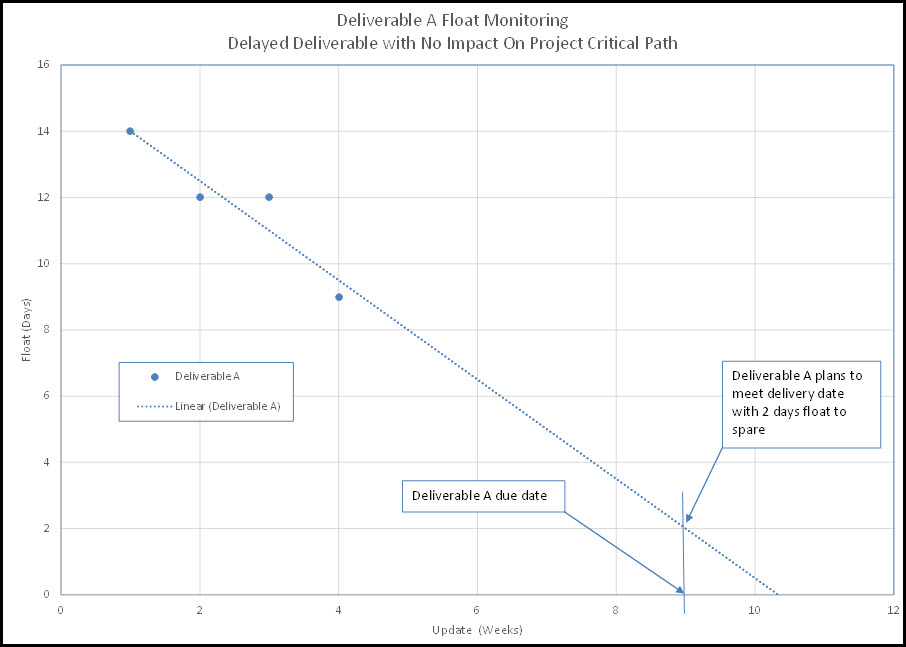
Each update represents one week duration. From these four updates we plot and extend the float trend until the float becomes zero. According to the plot deliverable A is currently planned to deliver in week 9 with 2 days float to spare. Deliverable A delivers before becoming project critical, which is what we want.
We plot four schedule updates again in Figure 2, and extend the trend.
Figure 2
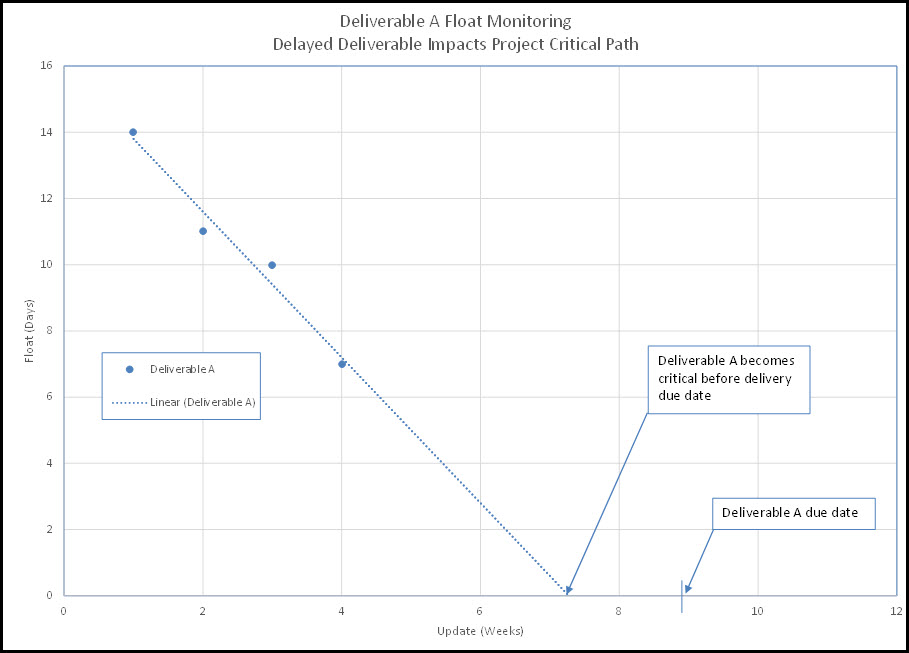
According to this new deliverable project float plot deliverable A delivery becomes critical in week seven before the planned delivery date. Any further delay in deliverable A impacts the completion date of the whole project. The trend of the respective deliverable A delay extrapolates out to a postponed project completion date. The project manager needs to find a way to realign deliverable A completion with the overall project schedule.
Float Monitoring Summary
Tracking deliverable project float and how it evolves from one schedule update to the next will provide a deliverable project float trend after 3 or 4 reporting periods. Extend and compare this trend to the respective deliverable due date to quickly gauge whether or not deliverable delays are in danger of delaying the project.
The project float trend of multiple deliverables can be combined in a high level dashboard. This project deliverable float monitoring technique is extremely insightful. And it provides early warning detection of deliverable progress issues in the respective project.
For more insight on float monitoring and managing projects consider reading “Advanced Scheduling Handbook for Project Managers” by Jeremie Averous.