Primavera P6 EPPM and the Gantt Chart Late Bar
Oracle is in the process of converting Primavera P6 Enterprise Project Portfolio Management (EPPM) to a non-java based coded software. At the time of writing this article they are only part way along this journey. In the meantime they let users switch back and forth between the new HTML5 or “standard” view of P6 EPPM and the “classic” java based view. Not all legacy software features are available in the new standard view. One nice feature that is available in both is the Gantt chart late bar.
The late bar in Primavera P6 EPPM release 16.1 is a Gantt chart bar that displays both positive and negative total float. When activities have positive total float the late start and late finish dates follow the early start and early finish dates. Likewise when activities have negative total float the late start and late finish dates come before the early start and early finish dates.
Activities that have positive total float may delay without postponing the schedule, and activities that have negative total float are already behind schedule. Ideally you want to display both positive and negative total float on the Gantt chart to provide more insight into schedule flexibility. The late bar achieves this by highlighting the late start and late finish of activities.
This article explains how to display an activity late bar on the Gantt chart in Primavera P6 EPPM Release 16.1 or later.
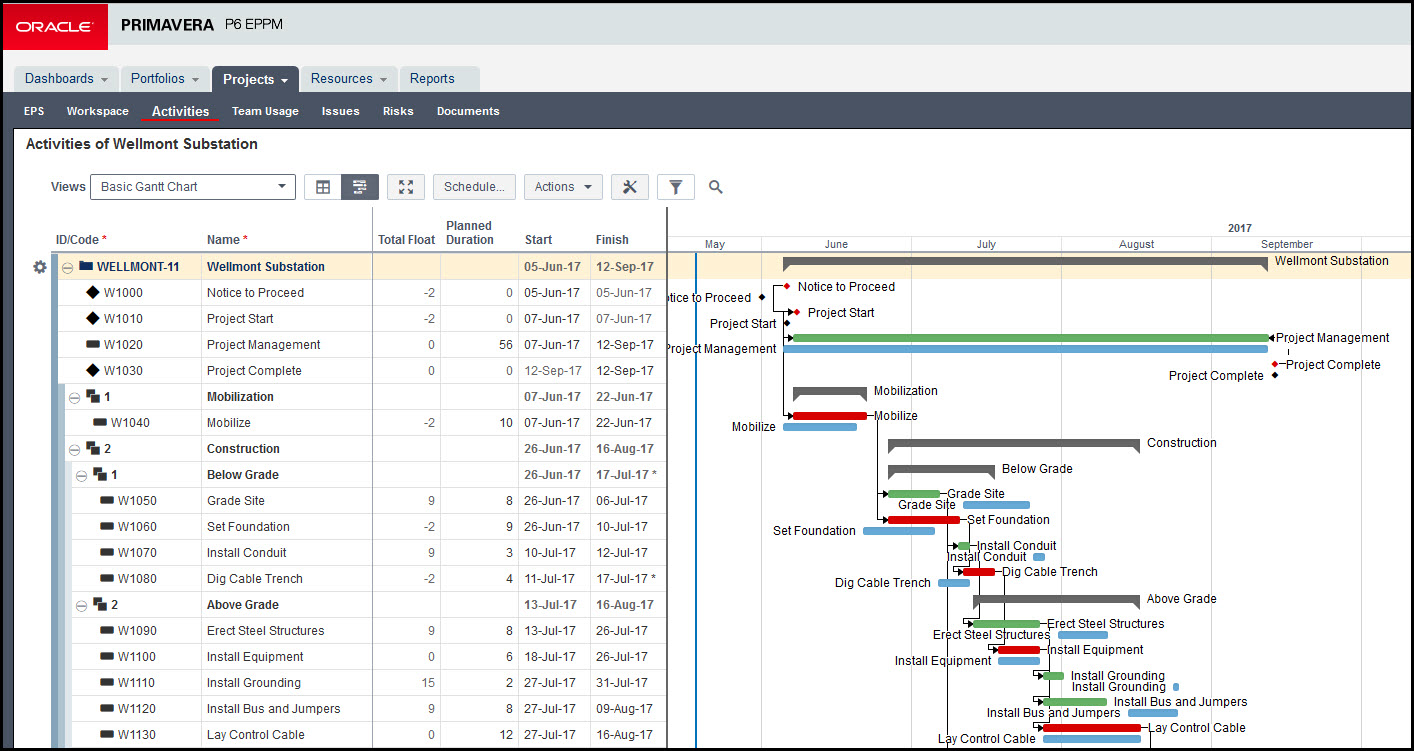
Our demonstration project schedule is displayed in Figure 1.
 Figure 1

Note activity float in the total float column. This schedule has activities that exhibit either positive or negative total float, so it’s a good example for our discussion. Figure 2 shows that the negative total float is generated by a Finish On or Before 13-July-2017 primary constraint on Dig Cable Trench.
Figure 2

We want to better visualize both the negative and positive total float to better understand our schedule flexibility. Again, this is achieved by the Gantt chart late bar.
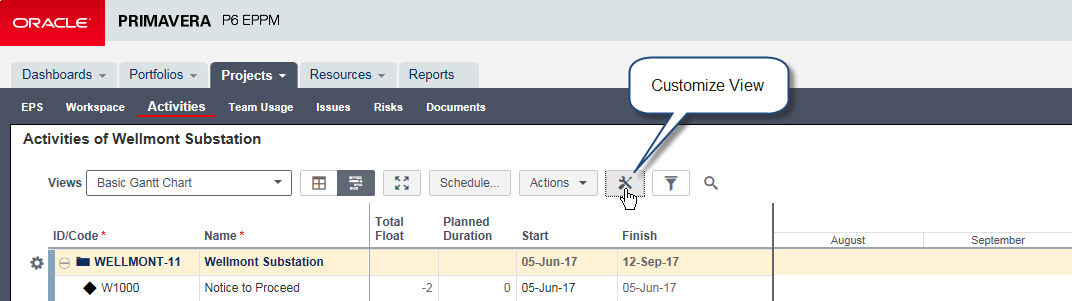
Proceed with a late bar definition by selecting the customize view icon in the interface of P6 EPPM Release 16.1. Figure 3
Figure 3
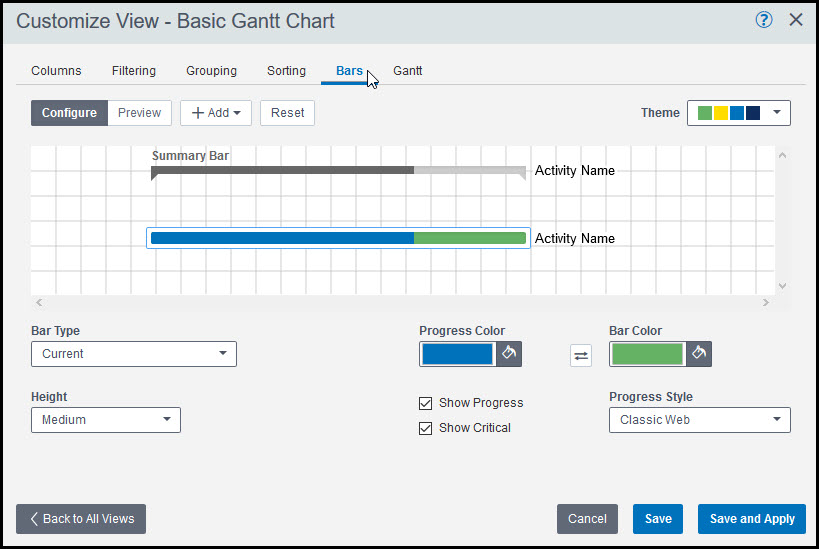
In the Customize View – basic Gantt chart dialog select Bars, Figure 4.
Figure 4
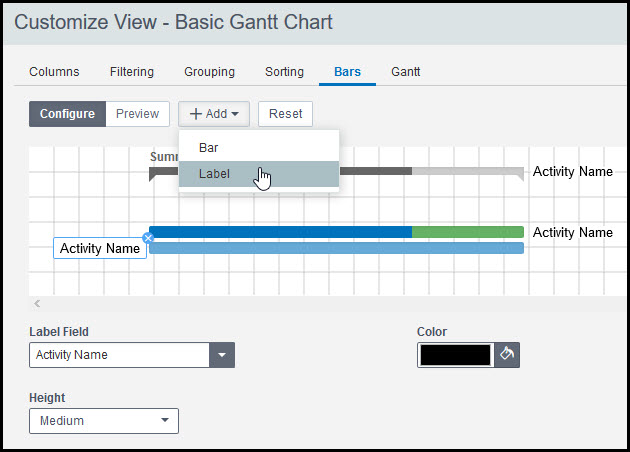
With the Bars option active select + Add and Bar from the drop down menu, Figure 5.
Figure 5

This creates a new bar below the current bar. Select the bar label and activity name from the label field, Figure 6.
Figure 6
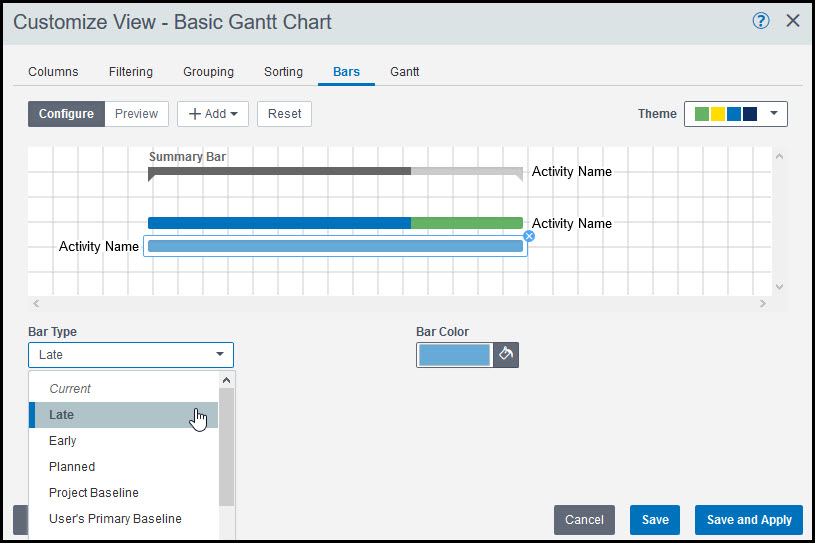
Next click on the new bar and select Late from the bar type drop down menu, Figure 7.
Figure 7
The resulting schedule with late bar below the current is displayed in Figure 8.
Figure 8
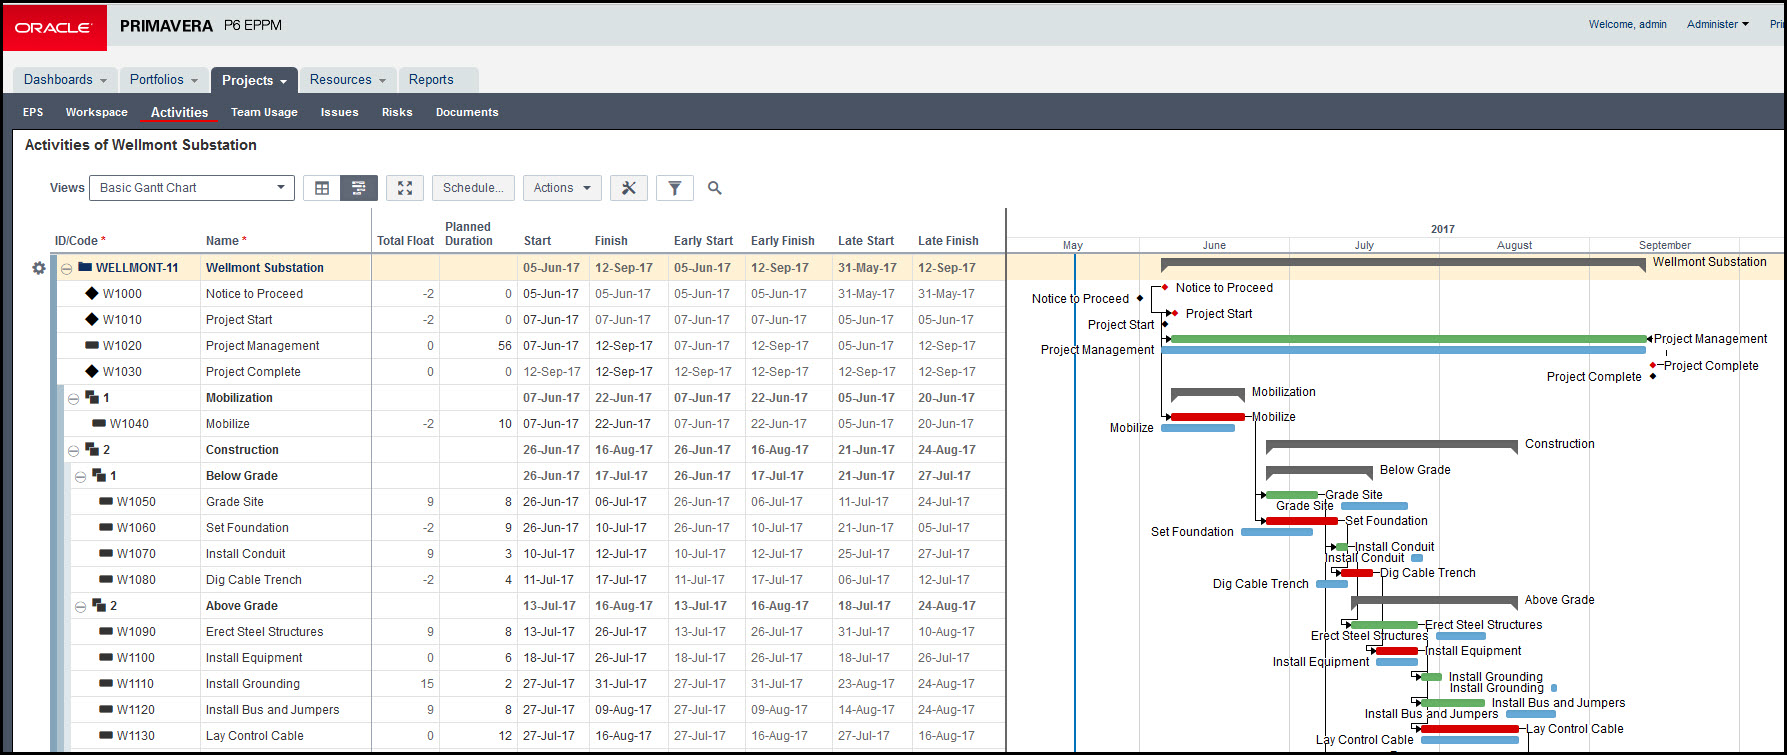
In Figure 9, we list early start, late start, early finish, and late finish to confirm that the late bar is matching the late dates.
Figure 9
Summary
The Primavera P6 EPPM Gantt chart is the heart and center of scheduling software. Although tabulating the late start and late finish dates provides confirming data dates, displaying the late dates on the Gantt chart provides more understanding of the schedule situation. The Primavera P6 EPPM release 16.1 Gantt chart late bar graphically depicts these late dates to better understand the schedule positive and negative total float values.