Setting up variance fields in Deltek Cobra to track, analyze, and report variances is done at the beginning of the project set up. Deltek Cobra will allow you to define the negotiated variance thresholds, identify trends, run format 5 reports and even maintain the prior month’s variance analysis within Cobra for future reporting.
Setting up Variance Thresholds
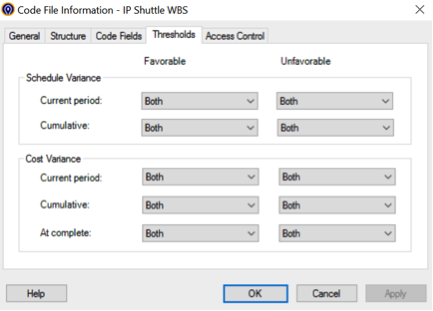
You can set up the variance thresholds at each WBS (Work Breakdown Structure) level. This can be done during the initial set up in the WBS code file or can be added at any point in time after the code file has been completed. First, you will need to define what type of variances you have (Figure 1), which is done in the code file information pane “Thresholds”:
- Percent – Percentage of variance that trips threshold (i.e. 5%)
- Value – Value of variance that trips threshold (i.e. 10K)
- Both – Percentage and value that trips threshold (i.e. 5% and 10K)
 Figure 1 Type of Threshold Selection on Code File information
Once that is done, you can now define what the thresholds are and assign them to a WBS. Thresholds need to be defined at each level of the WBS. This gives you the flexibility of defining differing thresholds for different levels of the WBS. This is particularly beneficial if your reporting thresholds are at different levels of the WBS. Thresholds are assigned in the WBS code file on the thresholds “Tab” for each individual WBS (Figure 2).
Figure 2 Threshold Definition

Once this is completed and you start executing against the program, the thresholds will be visible in the program Integrated Program Management Reports (IPMR) formats 1 & 5. Format 1 is the earned value report by WBS and Format 5 is the variance analysis report. These thresholds are visible by highlighting the elements that have tripped the various thresholds. Below is an example of IPMR format 1.
Figure 3 IPMR Format 1

As you can see there are numerous elements that have tripped thresholds, however there are two sets of color combinations. These determine which thresholds have been tripped and ultimately which require a variance explanation. Based on Figure 1, you can see the option for both % and Value was selected and, in Figure 2, you can see what levels were selected. Here are how the following colors map:
- Yellow box fill with red lettering – Both thresholds have been tripped thus requiring a variance analysis (i.e. 1.1.1 “Exterior” exceeded the current period SV and CV value of 5k and have variance percents of 30% and 47% respectively).
- Orange fill with bold red lettering – Only one of the variances (% or Value) has been tripped.
The primary reasoning behind the double color scheme was to identify which elements require a variance analysis and also show those that are at risk of tripping both thresholds at some future point. This will allow the Project Manager or Control Account Manager (CAM) to start mitigating against that risk and manage by exception.
Below is an example of an IPMR format 5.
Figure 4 IPMR Format 5
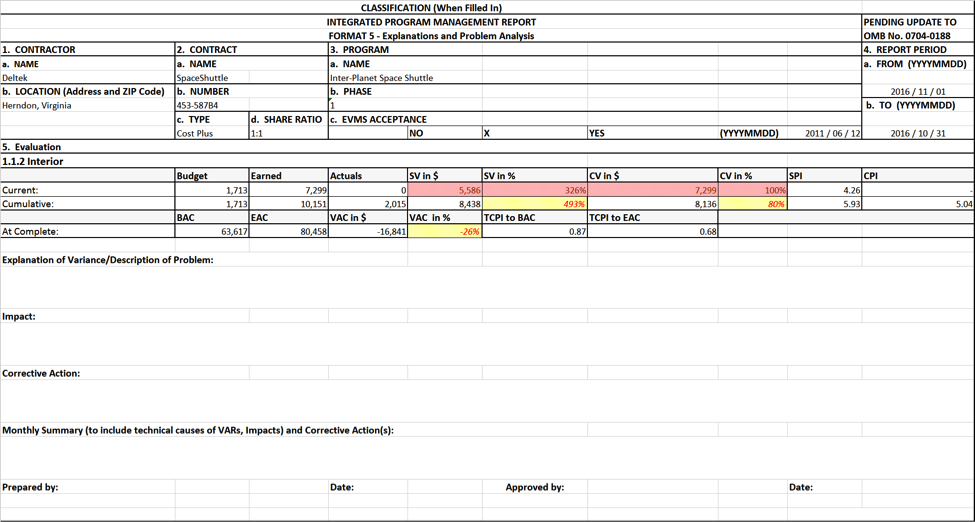
As you can see here the color coding scheme is slightly different:
- Red Fill – Tripped both thresholds, both the SV value and SV % for example are filled in red.
- Yellow Fill – Tripped only one threshold (value or percentage), in this case only the percentage was tripped, you see above only that box was filled in.
There is also another feature that can be used to help in identifying and writing variance analyses, the Project Analyze function. This can be found in Deltek Cobra 8 on the reporting ribbon when in the project pane. For Deltek Cobra 5, it can be found on the project drop down menu.
Figure 5 Cobra 8 Reporting Ribbon
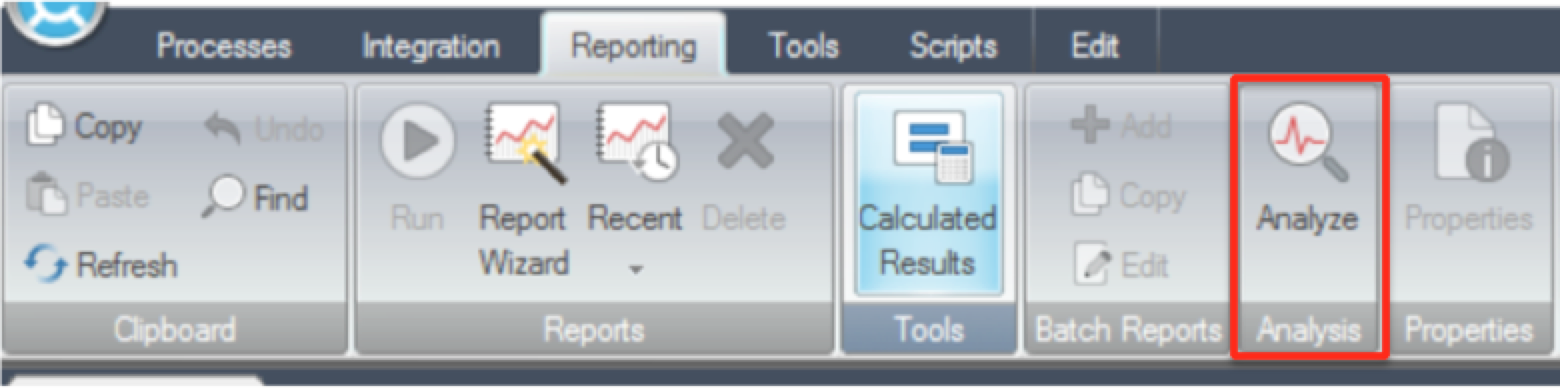
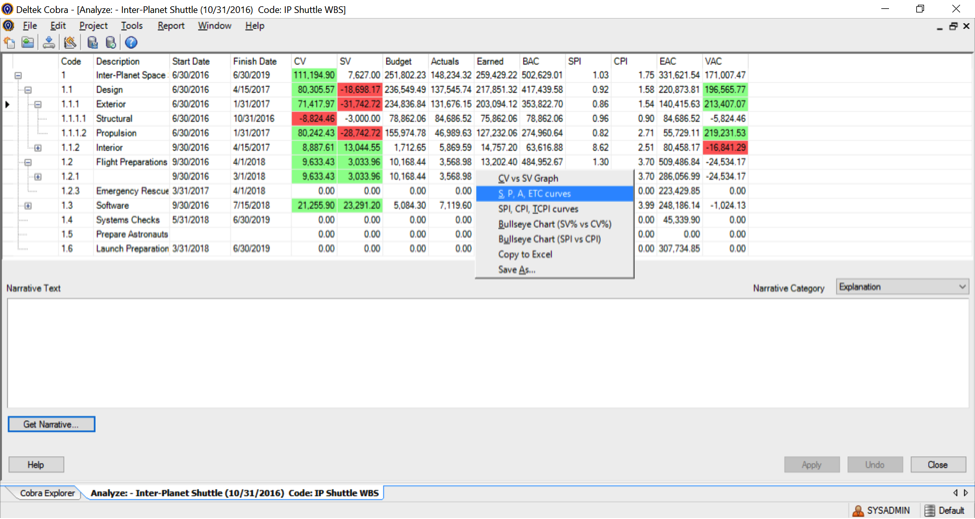
Once you open up the analyze feature, you will find an interactive report that has the same fields as the IPMR format 1 for cumulative data.
Figure 6 Project Analyze Feature
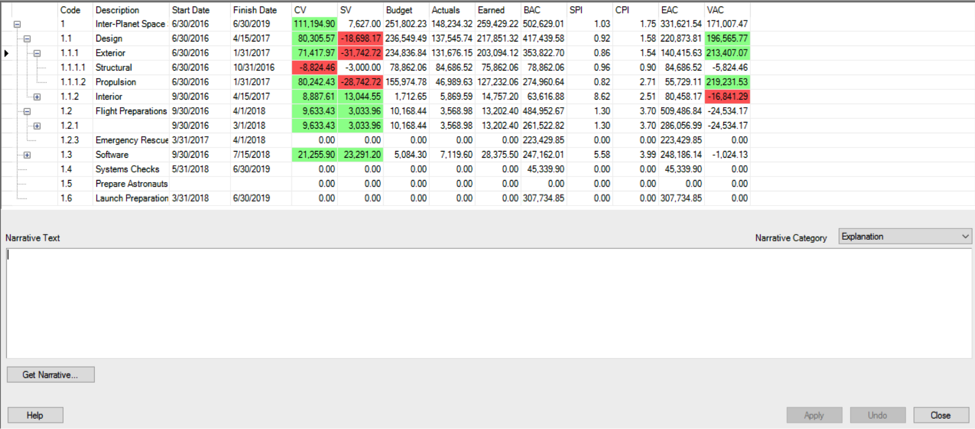
As you can see there is yet another coding feature to this report.
- Green for positive variance
- Red for negative variance
Within this report, you can copy or type the variance analysis from CAMs directly into the appropriate fields (Explanation, Impact, Corrective action, Monthly Summary) in the “Narrative Text” section and save it to be used again in future periods. Navigate the “Narrative Category” drop down menu to shift between the categories listed above.
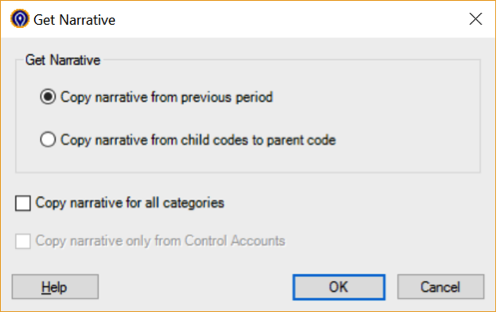
As well you can pull prior period narratives by using the “Get Narrative” feature.
Figure 7 Get Narrative Feature
Lastly, you can copy this report to Excel, or run some chart graphics by simply right-clicking in the details and selecting from list of options.
Figure 8 Analyze Reporting Options
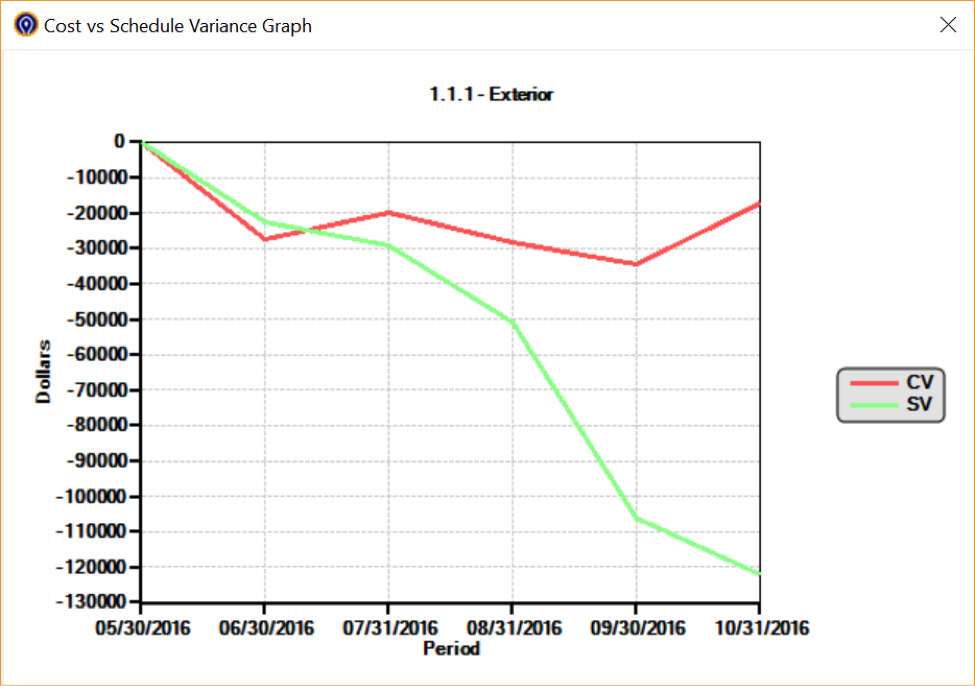
And here is a sample report.
Figure 9 Analyze Chart Sample
By using Deltek Cobra’s threshold function and all the available reports and other analytical functions, you can provide in depth analysis of the programs variances and make identifying and writing variances much easier.