Microsoft Project’s timescale feature has the functionality to display ordinal dates on the Gantt chart. Although a little involved, it’s possible to display ordinal day columns in the task table. Let’s explore.
The impetus behind wanting to display ordinal dates is that your project at its early stage of development does not yet have an agreed upon start and finish date. In this situation it makes sense not to display a schedule with a calendar start and finish date, as this may confuse your stakeholders. Instead you will want to display your dates in an ordinal series: 1, 2, 3, …
As mentioned above, it is possible to display ordinal dates on the Gantt chart using the functionality within the timescale feature. You may also want to display ordinal day columns in the task table. This takes more effort, but still possible.
This article describes how to employ features within Microsoft Project to display task calendar start and finish ordinal day columns. It is beyond the scope of this article to display ordinal week or month columns in the task table.
We proceed with our demonstration project, Figure 1.
 Figure 1
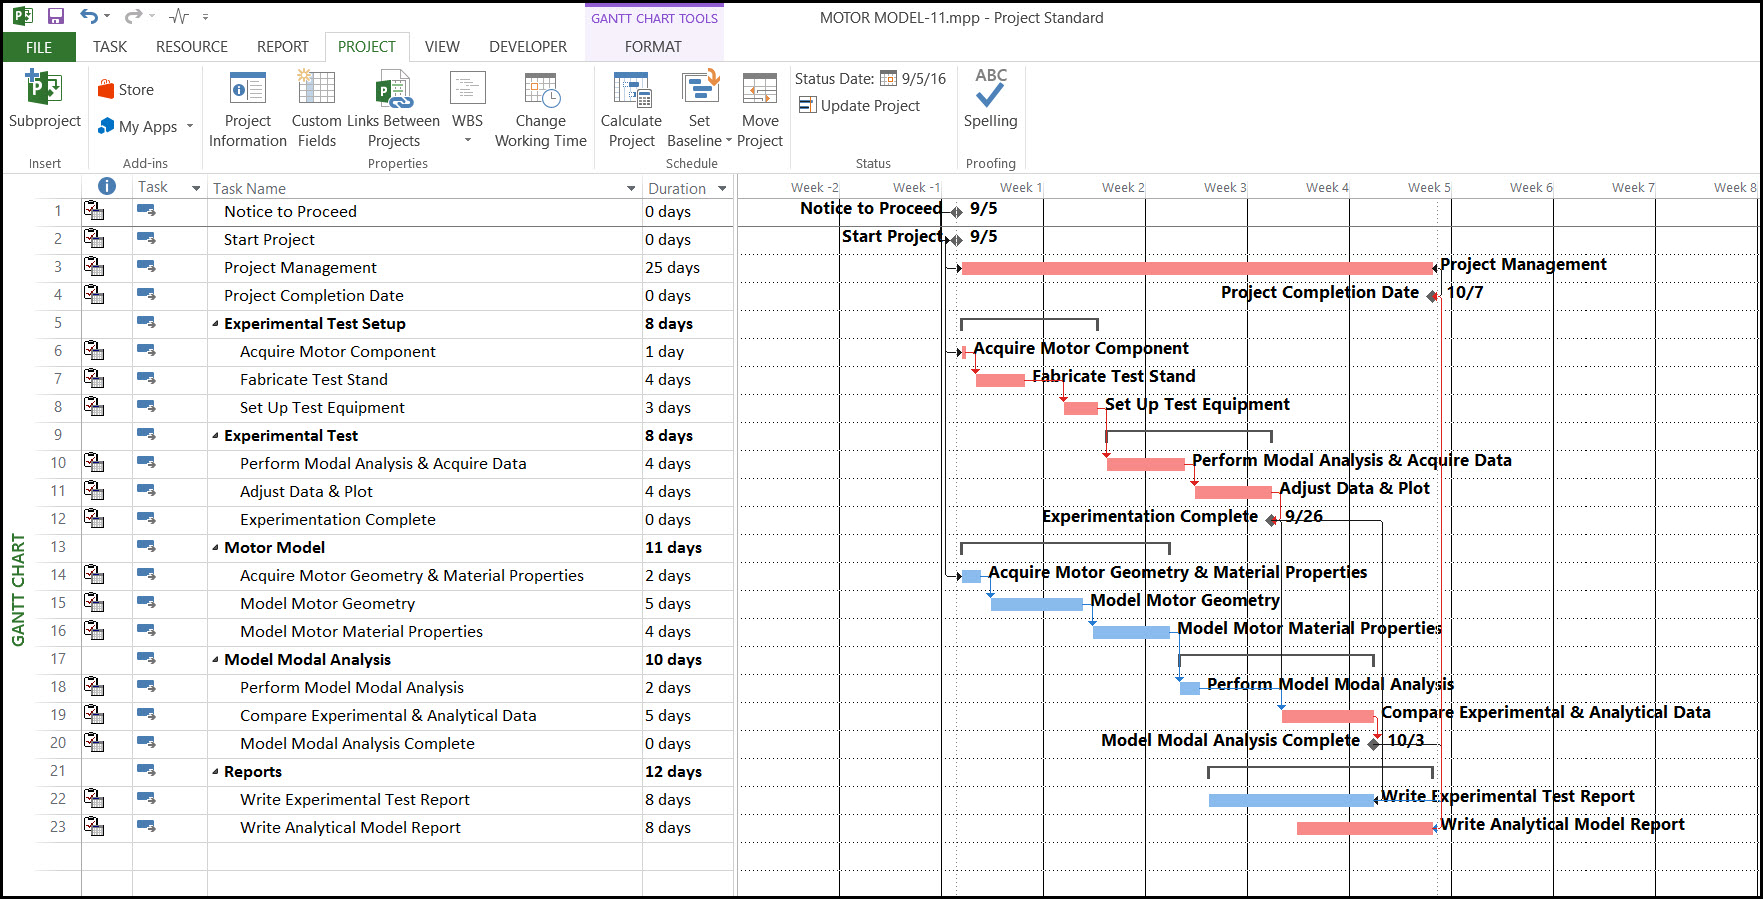
Here we have our Gantt chart displaying calendar ordinal weeks. Using the functionality within the timescale feature we change the Gantt chart to display calendar ordinal days, Figure 2.
Figure 2
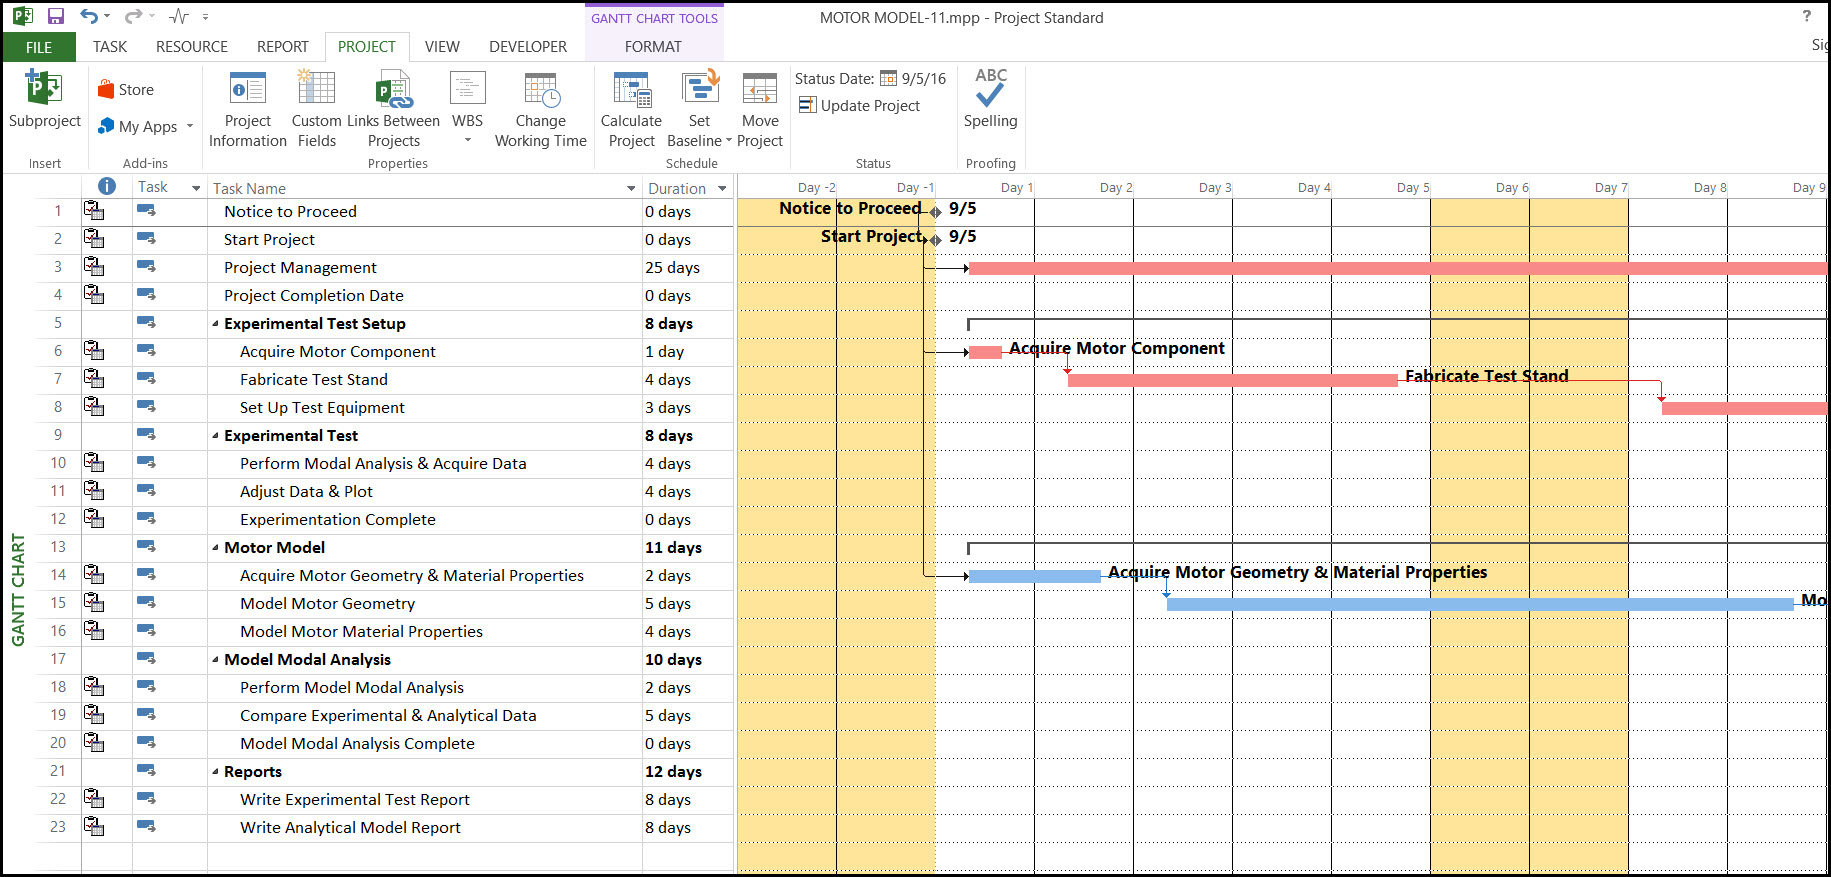
Now the entire schedule is not viewable on the Gantt chart. We will address this issue later. For now we focus on displaying calendar start and finish ordinal day columns in the task table. Let’s continue by displaying the number columns we will populate with our calendar ordinal schedule day values, Figure 3.
Figure 3
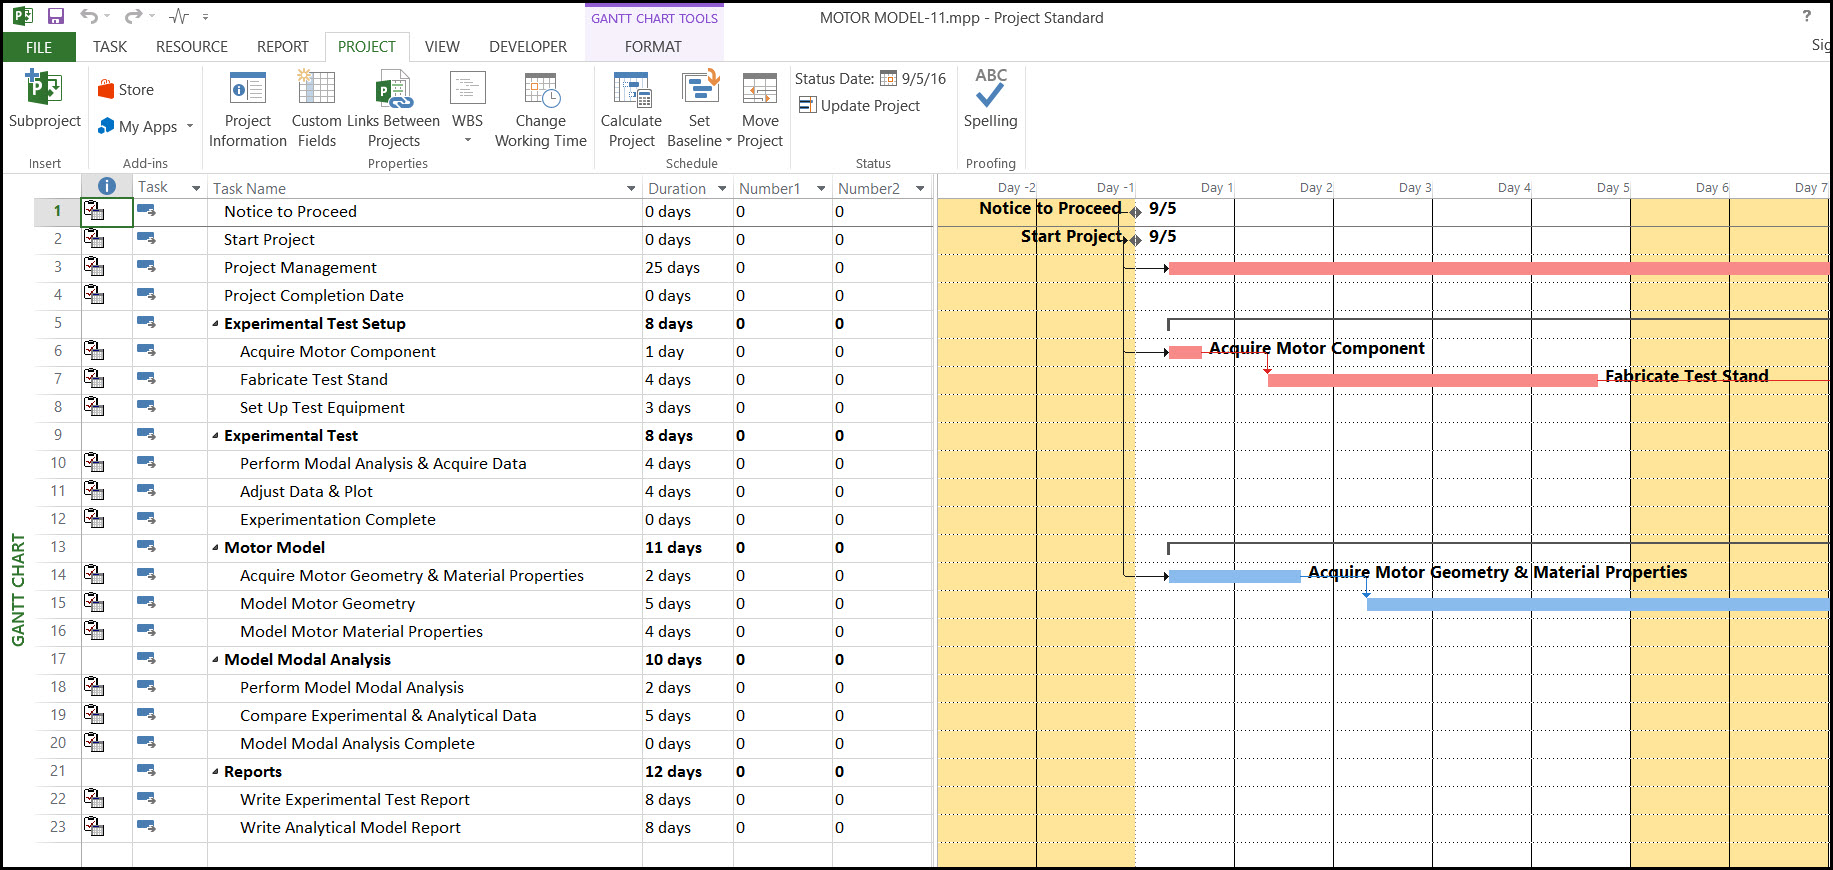
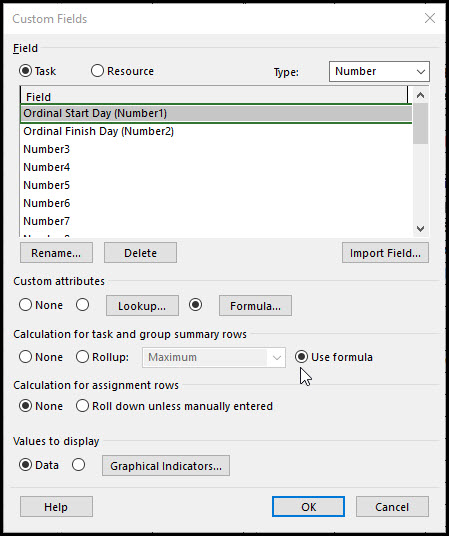
As shown in Figure 3, display a Number 1 column and a Number2 column. Select the project tab, properties ribbon group, and custom fields feature. This brings up the custom fields dialog, Figure 4.
Figure 4

In this dialog we will adjust the field name, custom attributes, and calculation for summary rows. Continue by renaming Number1 field ‘ordinal start day’, Figure 5.
Figure 5

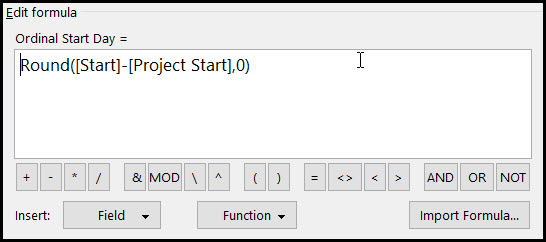
Next rename Number 2 ‘ordinal finish day’. In the custom attributes section select ‘use formula’ and enter the ordinal start day formula as displayed in Figure 6.
Figure 6
Toggle formula, Figure 7, for the ‘calculation for task and group summary rows’.
Figure 7
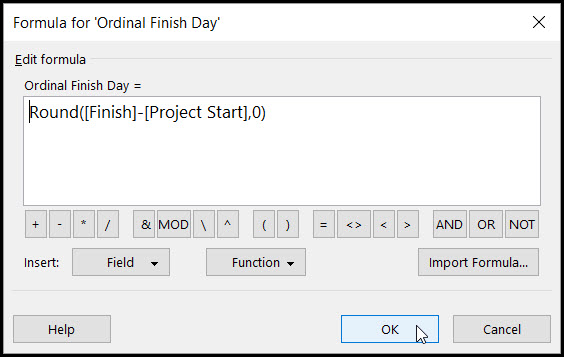
Repeat this process for the ‘ordinal finish day’, except use the formula as displayed in Figure 8.
Figure 8
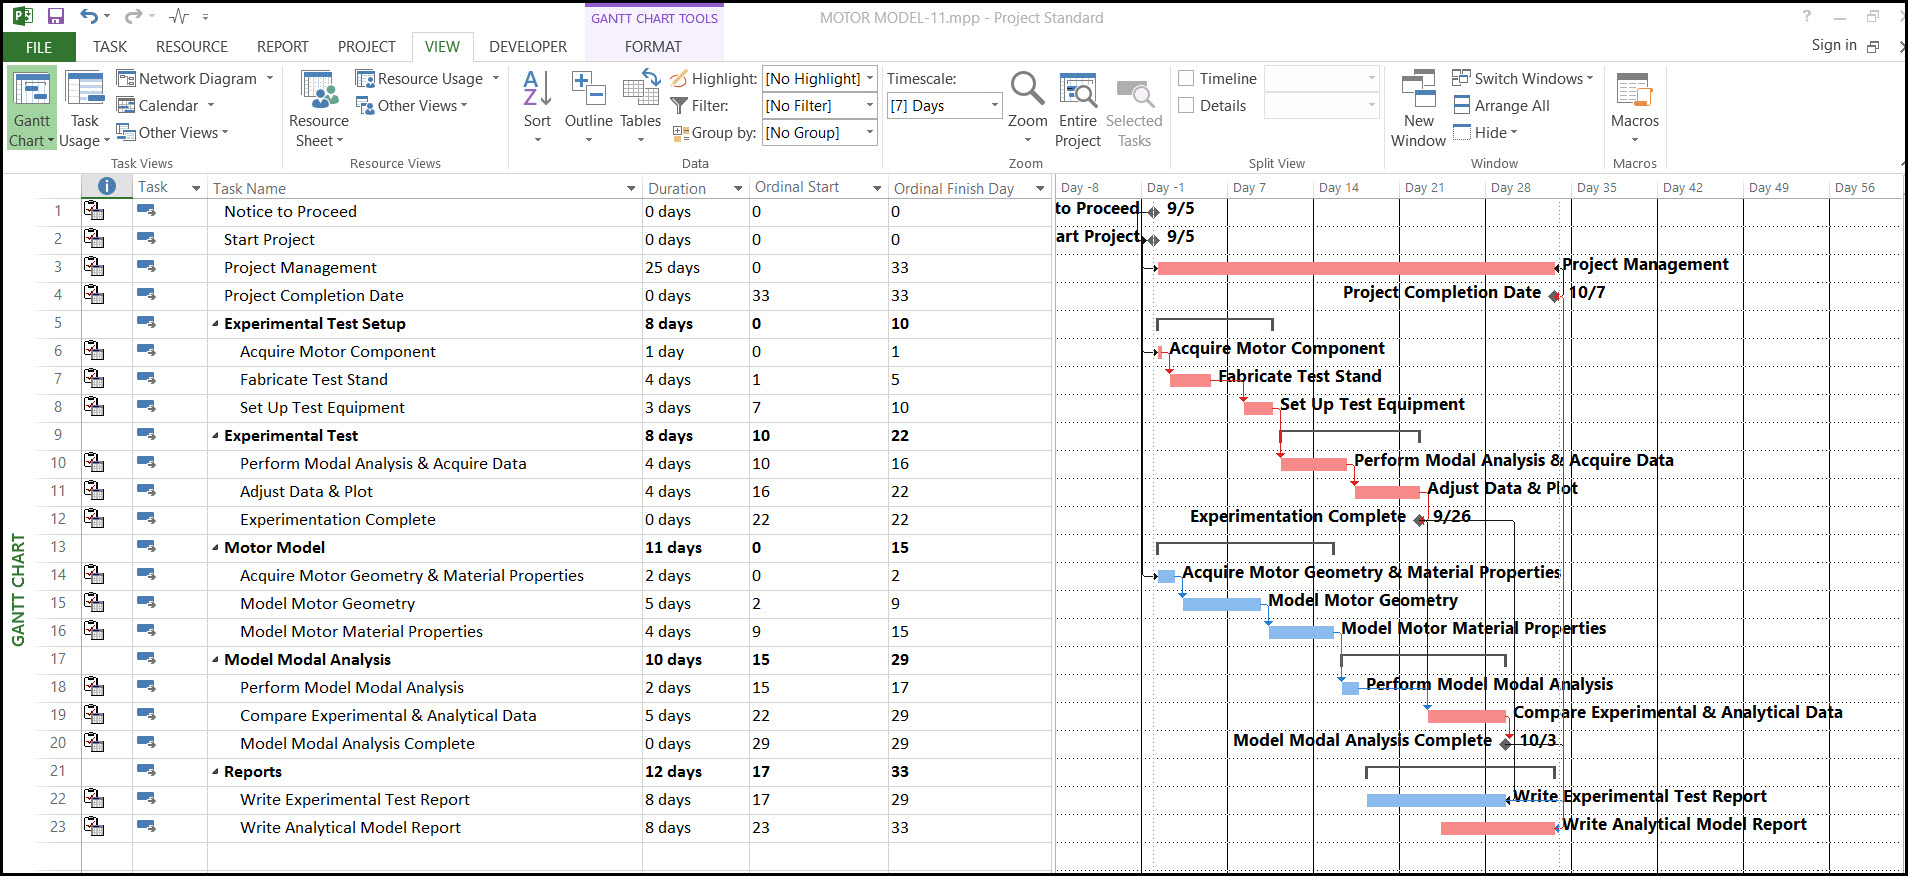
In Figure 9 we see both the ‘ordinal start day’ and ‘ordinal finish day’ columns populated.
Figure 9
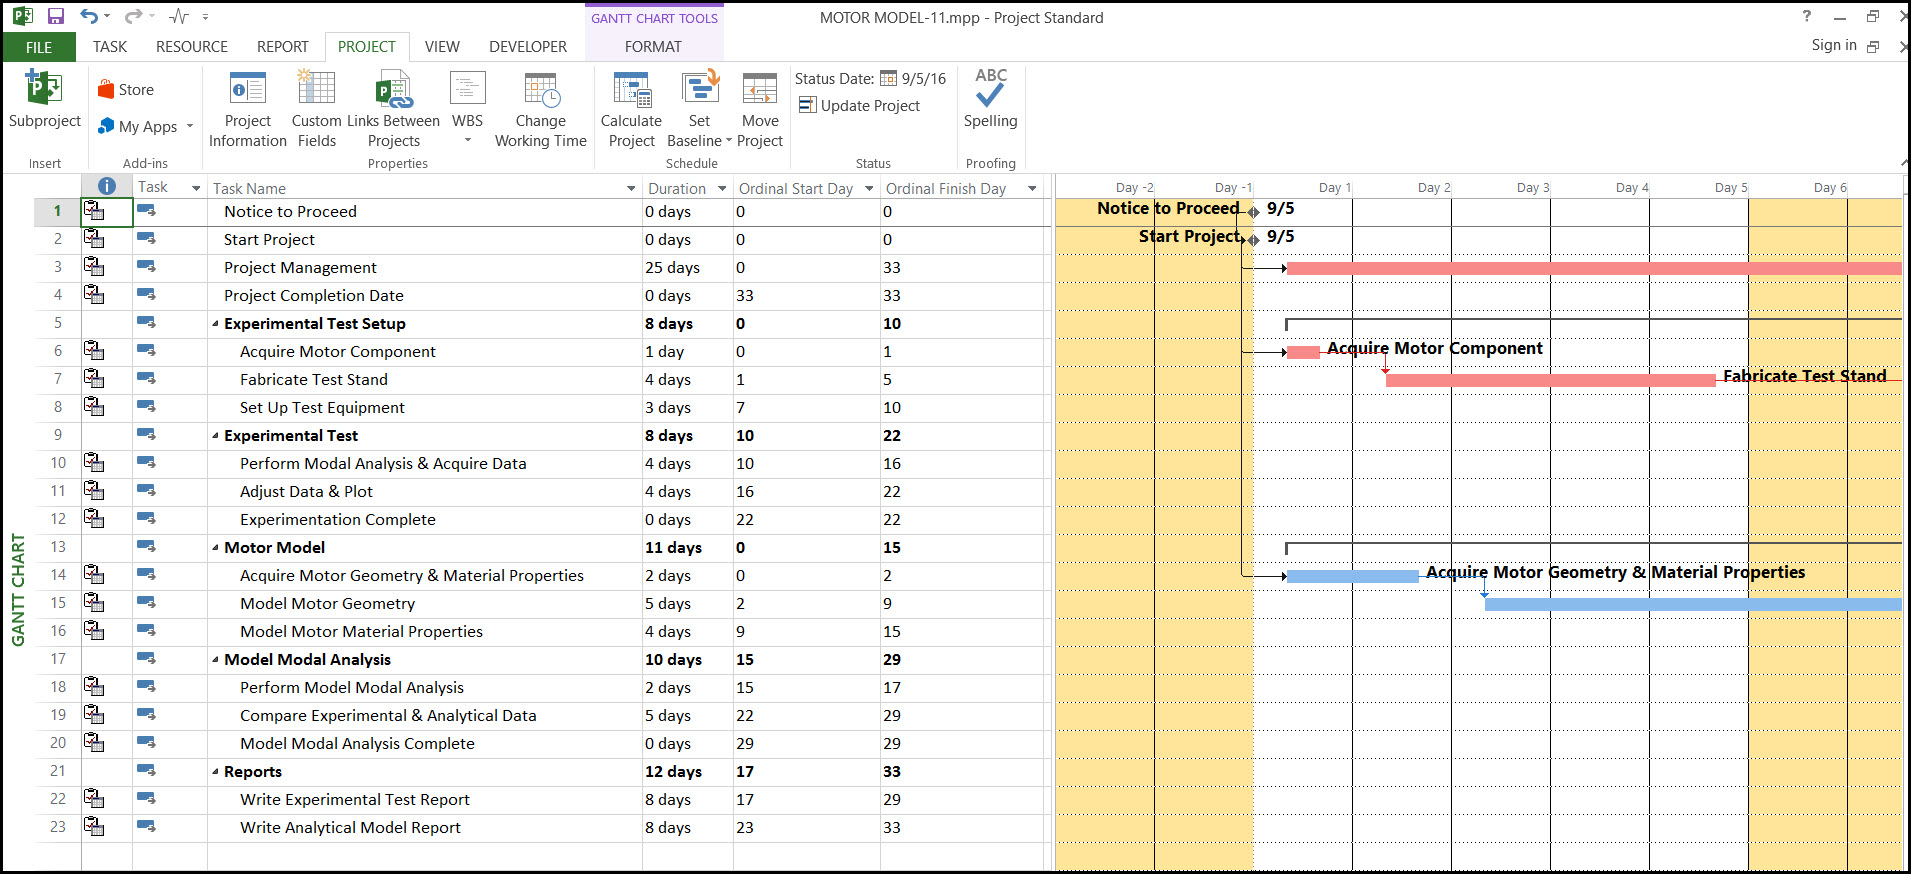
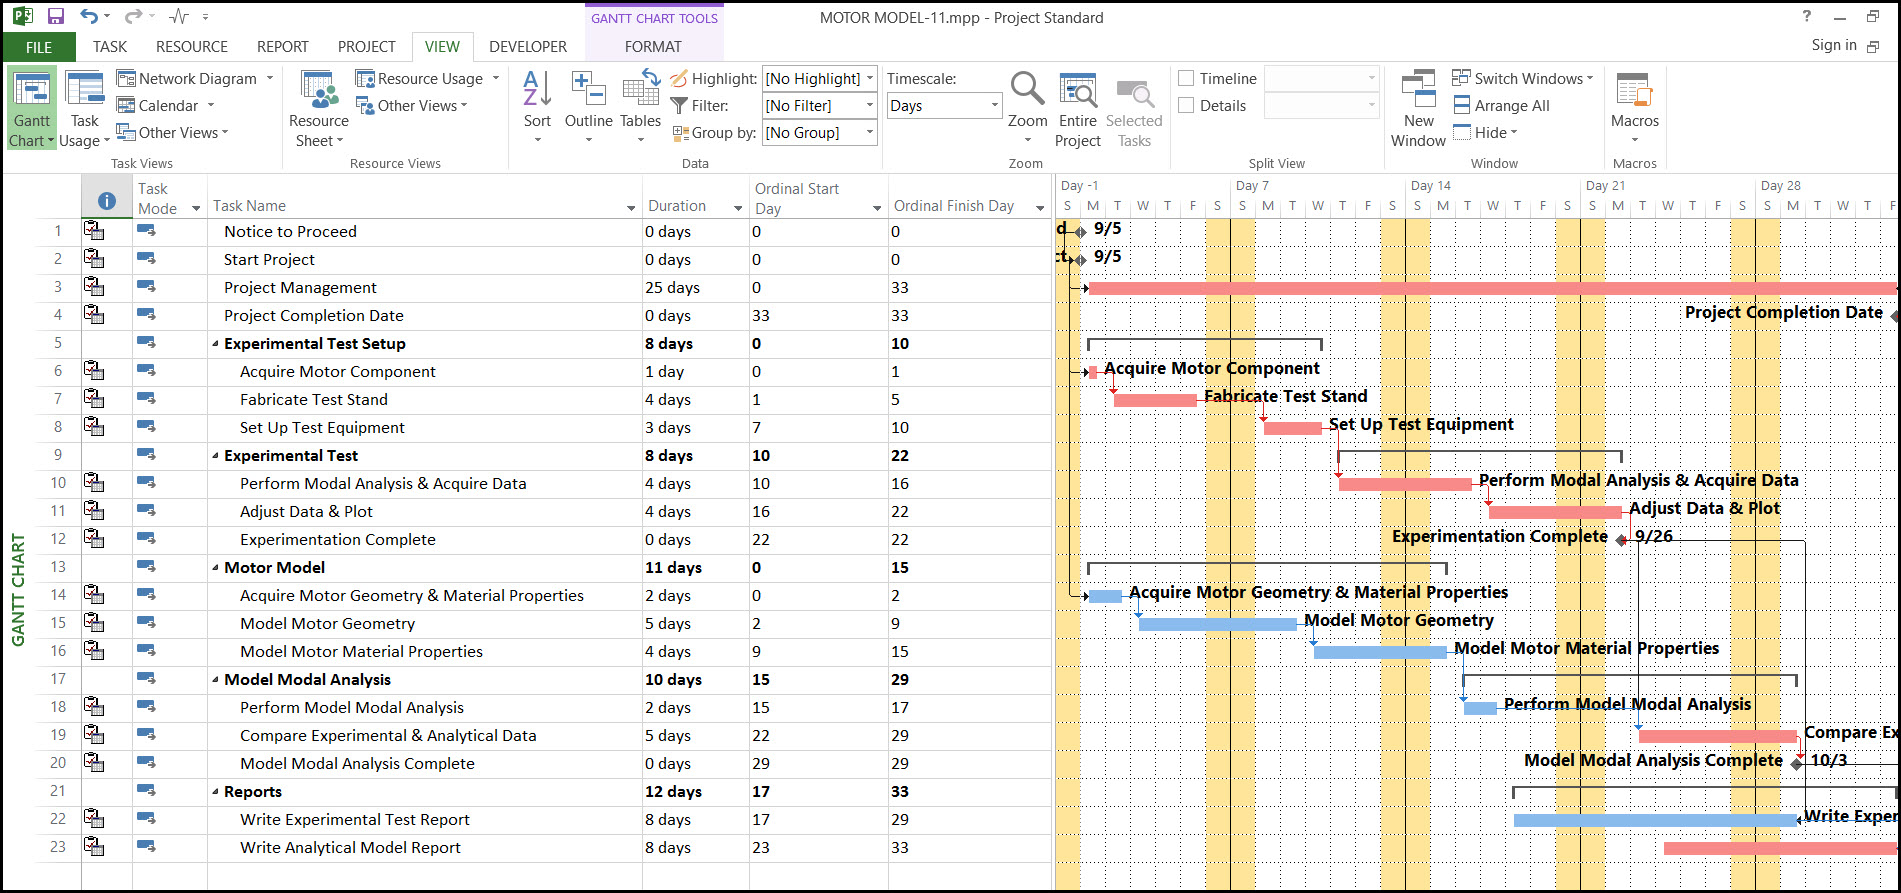
These columns days match the Gantt chart bars. Note that the tick marks are at the end of day. Also, note that ‘Acquire Motor Component’ ends at the end of Day 1 and ‘fabricate test stand’ begins at the end of Day 1. In Figure 10 we demonstrate that the task column days still match the Gantt chart after one week, indicating that weekends are included in our calculations.
Figure 10

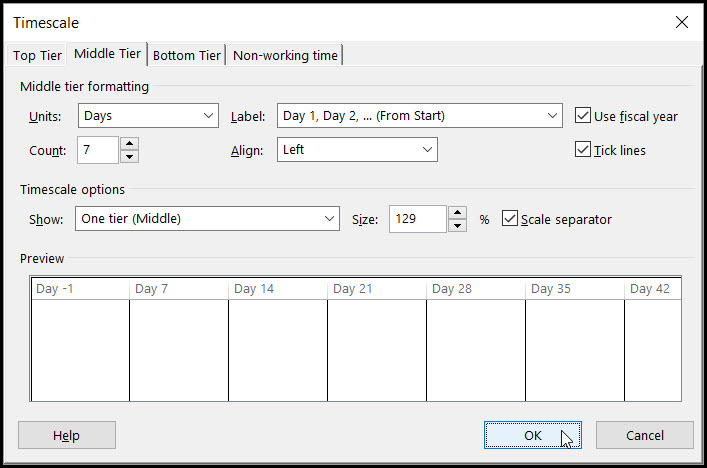
Again, note that ‘set up Test equipment’ begins at the end of Day 7 and ends at the end of Day 10. Adjust the timescale, Figure 11, to have a seven day count between tick marks that are left aligned.
Figure 11
With this adjustment to the timescale we can view the entire project, Figure 12, on the Gantt chart.
Figure 12
Still, it may be easier to read the Gantt chart if we add a second timescale tier for day of the week, Figure 13.
Figure 13

The resulting schedule is displayed in Figure 14.
Figure 14
This has two negatives:
- The first day of the week in the ordinal series is Monday and not Sunday, which makes sense since we are counting from the start of the project, a Monday.
- We just miss viewing the entire project when we include this day of the week second tier.
Summary
When a project has not been assigned an agreed upon start date, it is preferable to populate the task table start and finish days using an ordinal series. It is possible in Microsoft Project 2013 to round these start and finish values to the nearest day.
The problem inherent in displaying days is that the corresponding Gantt chart of most projects will not fit in entirety on the screen. Changing the count of the tick lines to seven definitely helps.
One may also be inclined to label the day of the week, which again makes it difficult to fit the Gantt chart on the screen. Larger projects will require the definition of calendar ordinal dates in weeks or even months. Unfortunately, computation of ordinal start week and ordinal finish week requires mathematical functions that do not appear to be available in Microsoft Project 2013. Because of this you may need to export the schedule to Microsoft Excel, compute the calendar ordinal weeks, and then import the computed calendar ordinal weeks back into Microsoft Project. That is, however, a discussion for another day.