Introducing Adrega PI (Project Intelligence); a refreshingly straight-forward approach to high quality project portfolio dashboard and spreadsheet reporting for Primavera P6.
This web-based software is produced by Adrega AS; a Norwegian software company that has developed this specialized project and portfolio management reporting tool for use with Primavera P6. With Adrega you can easily create high-quality Gantt charts, reporting dashboards, and bundled Excel based S-Curve, time phased and histogram reports all at the click of a mouse.
In this article, we take a first look at Adrega PI, a reporting solution designed for Primavera P6 (and Microsoft Project).
Why Adrega?
Reporting in Primavera P6 and Microsoft Project has some limitations that often lead organizations to look outside the tool for a solution. Many companies simply get by using ad-hoc reporting solutions that invariably include Microsoft Excel and a generous amount of manual configuration and formatting.
Examples of common reporting limitations include:
- Lack of flexibility
- Challenges in licensing and distribution of project reports to all stakeholders
- High-cost, complex integrated system that require considerable development
- Global and project access rights
- Lack of support for multi-cut-off dates (last Sunday of the month, second Friday of the month and bi-weekly)
- Late schedule curves
These are examples of issues that contribute to making reporting of project performance and S-Curves along with various other report types in Primavera P6 a complicated and time consuming process. As a result, project schedulers often resort to using two reporting tools, one to create S-Curves and performance reports and another to produce better quality Gantt charts. Having to work with multiple tools adds a level of complexity to the reporting process and this is where the Adrega PI reporting solution steps in. It replaces all ad-hoc reporting tools with a single, centralized, role-based reporting solution.
Adrega PI has built-in support and addresses all of the reporting challenges mentioned above, plus many more.
So how does Adrega PI work?
Adrega PI works by importing Primavera P6 projects, which then allows you to:
- Provide a range of reporting options that are not available within Primavera P6
- Dramatically reduce the time spent creating reports
- Improve the quality and consistency of reporting across projects
- Build up a history of the project’s period-by-period progress in the Adrega PI database.
- Users with different roles can have instant access to Adrega’s Reporting module without the need for reorganizing access rights in each Primavera P6 project
- Provide clients and internal management with a wide range of reports
The beauty of this is that it’s a centralized reporting solution available on a company wide basis through a web browser.
For users to get the maximum benefit out of using Adrega reporting of historical performance/ status data, the feature “Save Period Performance” in P6 can be used to save periodic project status, or Adrega will create the history based upon the Data Date with each new import of P6 data via the .XML file.
Earned Value Management
Adrega PI’s historical time phased capability augments your Primavera P6 investment with respect to earned value reporting. With time phase data, S-Curves and current period/cumulative reports at your fingertips, earned value reporting and trend analysis becomes much more feasible with Primavera P6.
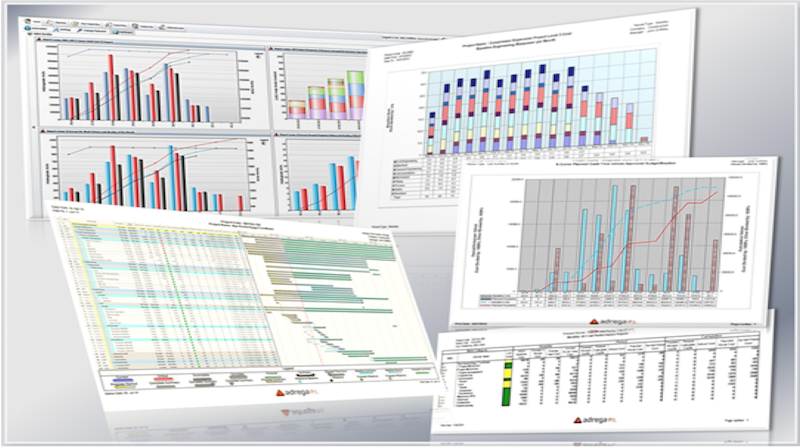
Standard Report Types
Adrega provides as suite of 15 standard report types that include:
- Gantt chart
- 7 Graphical (Project/Activity, Resource, Capacity, Other Resource Types, Trend and Pie)
- 5 Tabular (Project/Activity Information, Project Performance, Time Phased Project and Resources
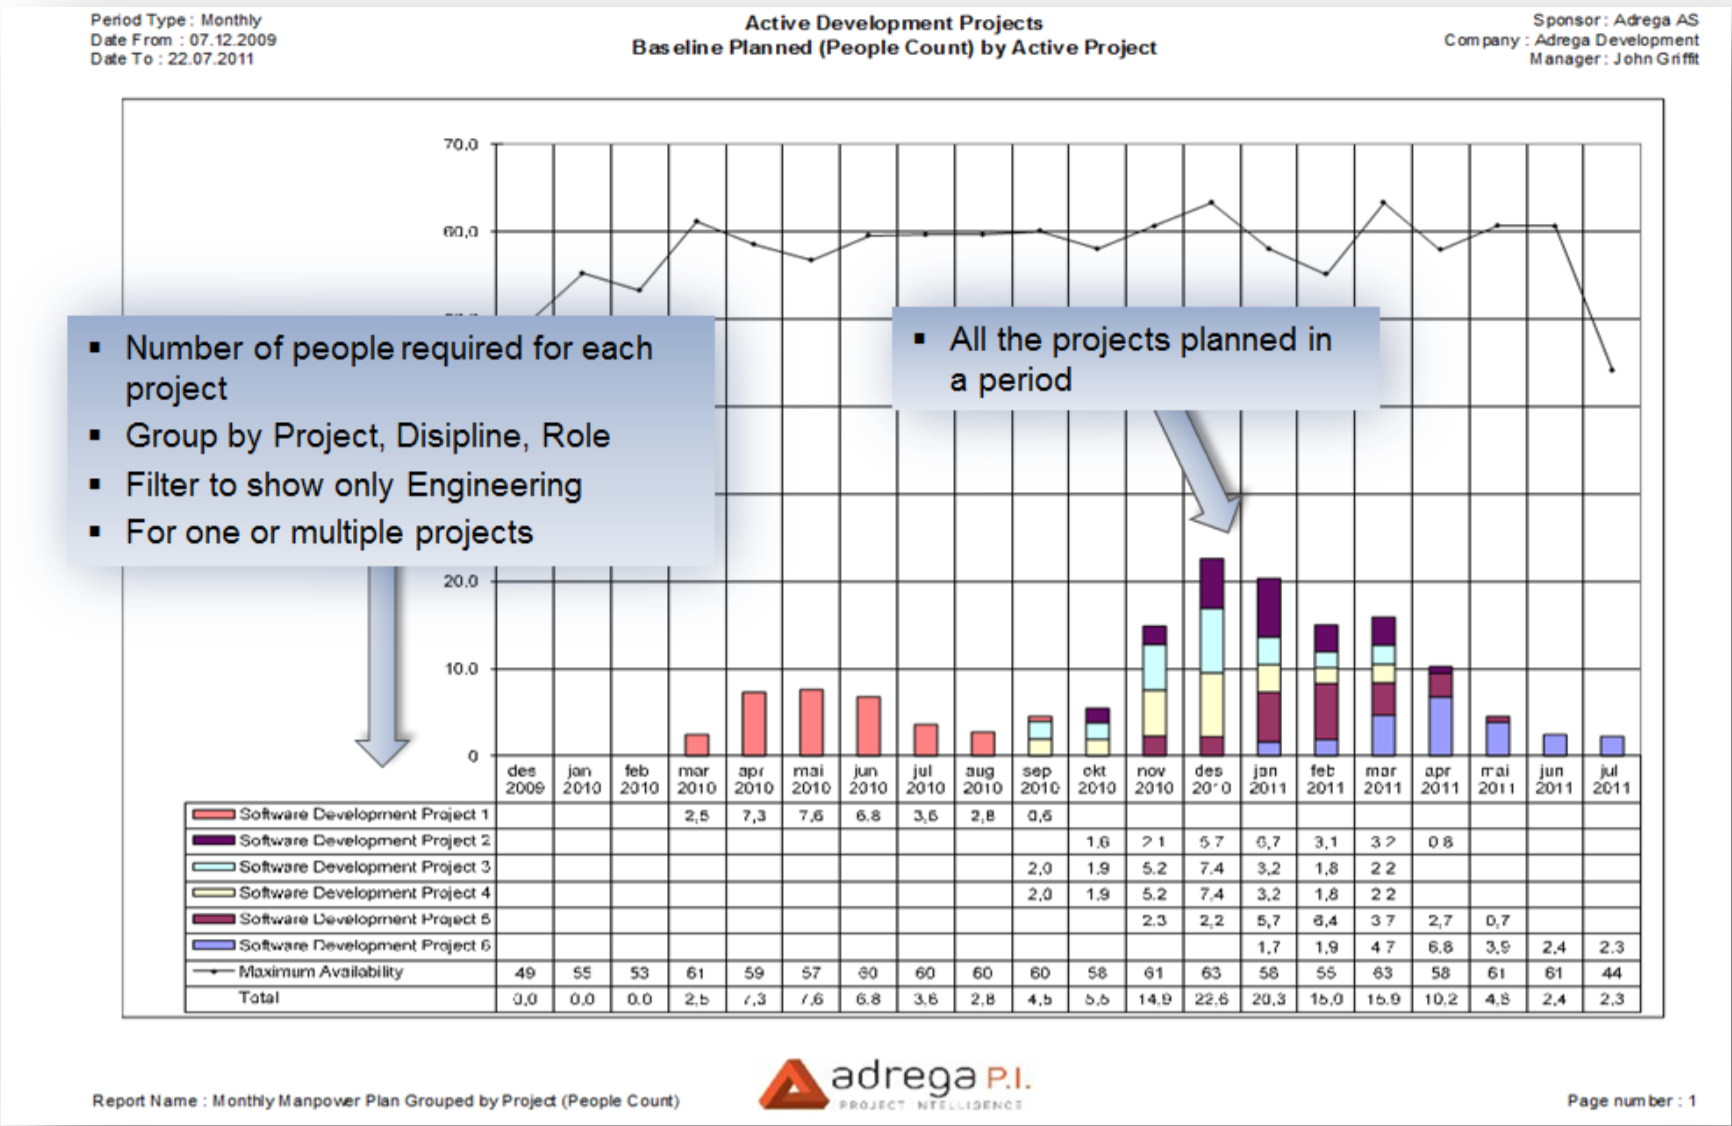
 Manpower Planned – Period by project
Pie Chart Grouped by Responsiblity

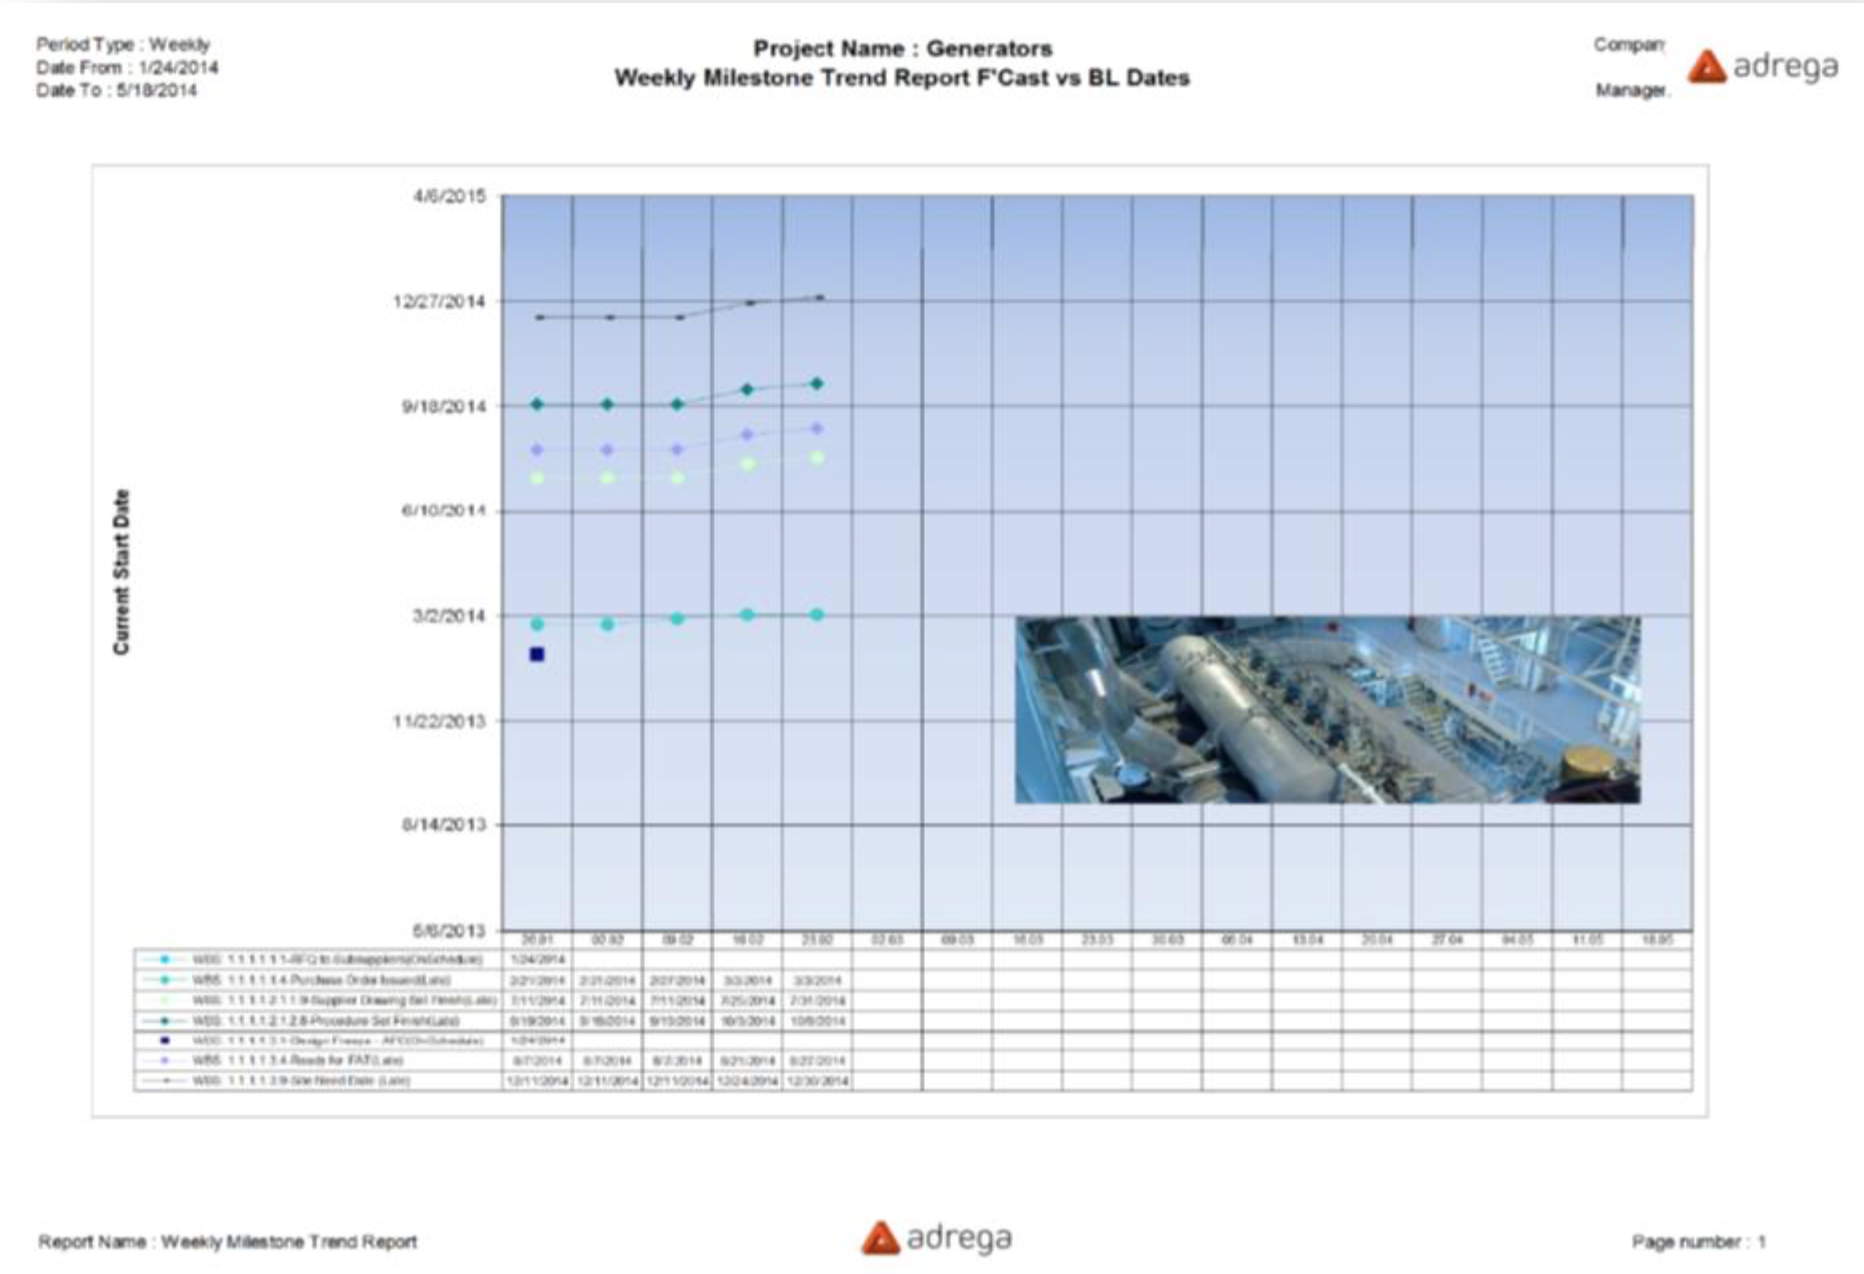
Milestone Trend Report
Compare View
The “Compare View” in Adgrea PI displays data for the project before it is updated (current) as well as what the project will look like once the changes for the new period have been merged.
The left pane of the “Compare View” displays status for the previous period while the right pane displays current status. This represents how the project will look when current status is merged with the previous period.
Compare View

Bundle Up
Report Bundles is another feature that simplifies and speeds up the process of running the same reports against specific projects at each reporting period, without the need for project and report template selection at the time when the reports are run.
With a single click a complete set of preconfigured Graphical and Tabular reports can be run for a single project or a program of projects. Nothing at run time needs to be configured; no changes to column widths, modifications to headers and footers are required. Report bundles support an unlimited number of projects and associated reports.
For example, if five projects are selected and then five reports, the workbook output to Excel will contain a total of 30 reports, five reports for each project and five reports summarizing the values for all projects in the program. So with a maximum of three or four “Clicks” the user can produce 25 reports without the need to run them individually or configure them.
Finally, you can select PDF as the output format. A great option which allows you to produce a PDF file with one click as well as getting only the Graphical sheet output, is a huge time-saver for users. We produced PDF files with 100+ S-Curves using Adrega in around 2 or 3 minutes!
Dashboards
Users can go directly to their personal Dashboard and a view a pre-defined report set called a “Dashboard Report Bundle”. There is no need to save status or save the project as access to the latest project information is automatic.
Alternatively the user can open the Reporting module and, with a few mouse clicks, run all preconfigured reports using predefined report bundles. This could be the standard client monthly status report set which in this example includes 20 preconfigured reports as well as a report bundle configured with reports for internal use only.
Dashboard Which Supports Interactive Gantt Reports

Summary
Adrega PI is an affordable system that adds significant reporting capabilities to a Primavera P6 solution; and does so in a very elegant way. Many organizations could save a lot of time, money and frustration by using Adrega PI with P6 and will certainly enjoy the additional features that simply aren’t available in Primavera P6.