Earned Value analysis has a reputation for being complex with a lot of different metrics, calculations and acronyms but, in reality, at its core Earned Value analysis is a pretty simple concept. In fact, all the calculations for the standard indexes, variances and forecasting methods can be built using four simple data points. These four data points are:
- How much you are planning for your project to cost at the end or the Budget at Complete (BAC)
- How much you had planned to spend through today or the Planned Value (PV)
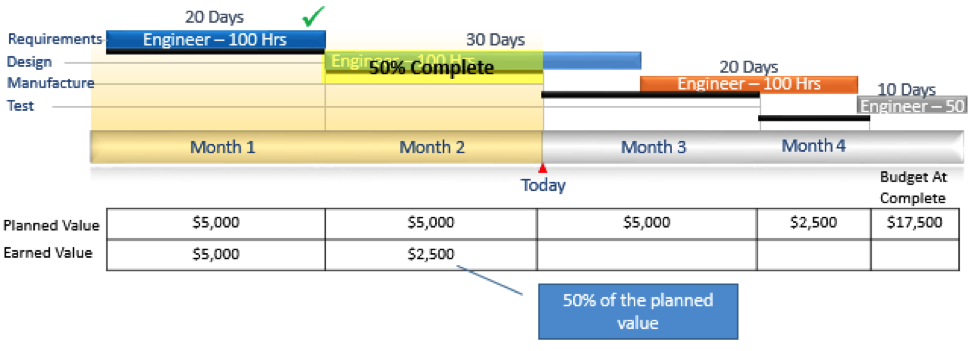
- How much of the work, from a cost stand point, have you actually accomplished or Earned Value (EV)
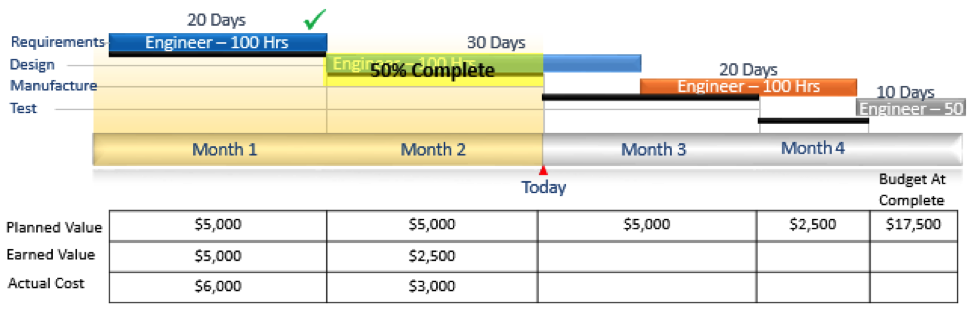
- How much have you spent or Actual Cost (AC)
With these four simple data points you can calculate most Earned Value metrics, including Cost Performance Index (CPI) and Schedule Performance Index (SPI), and from there make accurate predictions about where the project will end up. Let’s take a look at each of these data points in a little more detail.
The BAC is the total amount of budget planned for a project. If you add up everything you are planning on spending to get the scope completed on a project, that is your BAC.
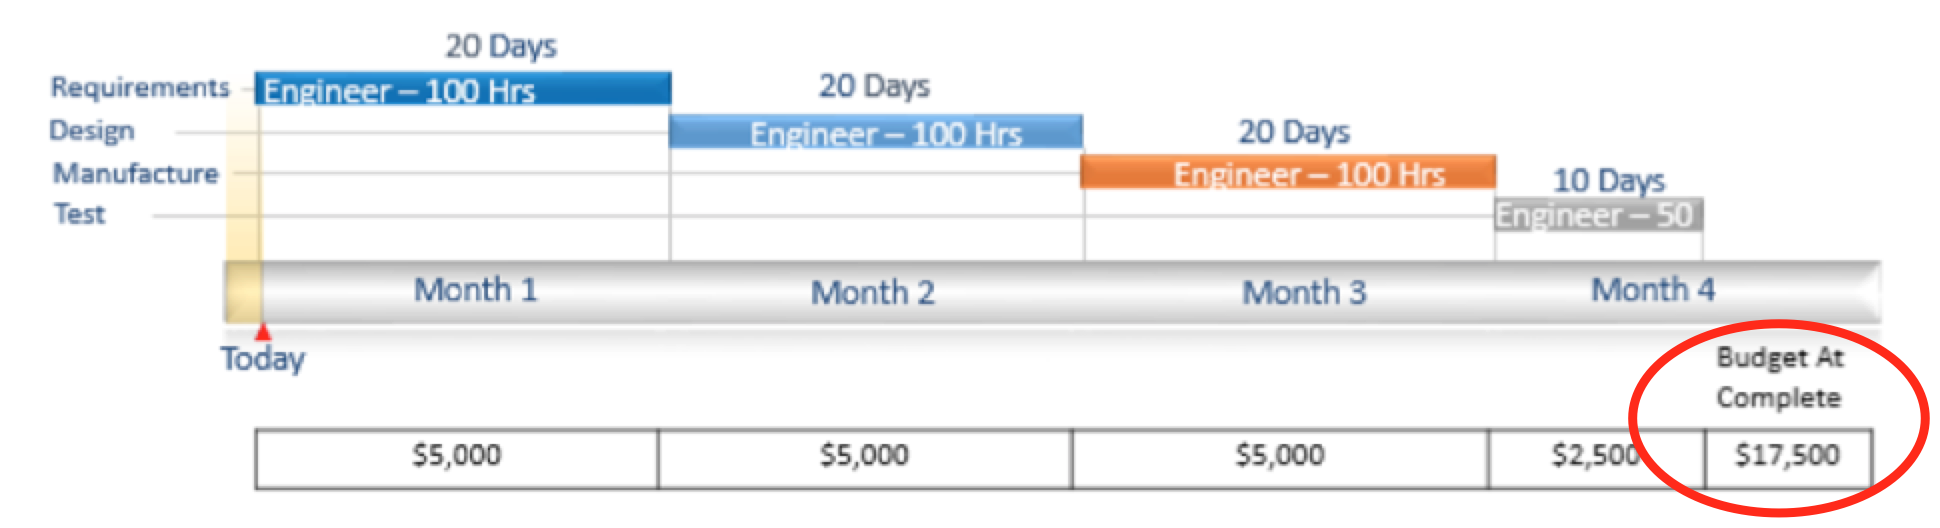 It is important to note that your BAC is not the same as your funding for project. In fact earned value BAC does not even include your Management Reserve. It only includes the values that are distributed down to control accounts or planning packages or value that has scope, have not been planned yet, and are sitting in your Undistributed Budget (UB). Sometimes that concept can be confusing for folks because they look at BAC and they want to equate that to a projects funding. Those concepts are related, funding is a source for BAC, but they’re not synonymous.
The next concept is the Planned Value. This is the time phasing of the BAC and, in particular, how much of that that planned budget should have been spent at a particular point in time. For example, if I’m one month into a project then I’m only going to show my planned value equal to the amount of budget that I thought I was going to spend in that first month.
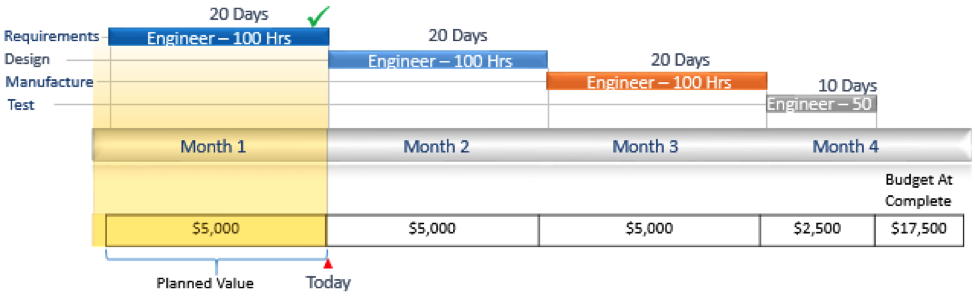 The incremental value comes from the time phasing of the work when you put your plan together. I’m not going to go into how you create that plan here, just understand that that’s being driven by your schedule activities and the resource assignments on those activities. With that time phasing you create a planned value for each period and as you move through time your Plan Value will increase by how much incremental budget is planned in each period.
Earned Value, the next item, is the value for the work that you’ve accomplished through a point in time. This is calculated based on how much you planned to spend for a piece of work and how much you have accomplished. If you completed the work, you earn the full budget associated with that activity or scope of work. If you are part way done, you earn the amount of budget equal to the percent complete of where you are.
So, if I’m recording earned value for an activity that has a total budget of the $100 and I say I’m 50% complete, I will have an earned value of $50. I will accomplish $50 worth of the value associated with that activity (there are lots of ways to calculate where you are on activity that we’ll cover in a different post).
 The fourth item is Actual Cost or AC and this is just what it sounds like. The actual cost is the money you actually spent to accomplish the work. This includes your actual cost from your system of record, your accounting system, as well as any estimated or accrued actuals. It’s important that you are always capturing the actuals and that all actuals are against the same period that you’re performing the work, otherwise you create false variances.
Now that we have the definitions of those four data points, lets look at what we can do with them.
Schedule Performance
First lets look at schedule performance and how can we use these data points to assess your schedule performance? Well, we can use the Planned Value and Earned Value to calculate if you have completed the amount of work you had planned to compete at a point in time. This is called schedule variance (SV) and it is calculated by subtracting the Earned Value (how much you have accomplished) from the Planned Value (how much you thought you would accomplish). In other words, how much work did you think you’re going to accomplish versus how much did you actually accomplish.
If your Earned Value is less than your plan value, you are behind schedule. Makes sense right? If your Earned Value was more than your plan value your ahead of schedule, you’ve accomplished more work than you thought you would when you originally put the plan in place.
Schedule Variance = Earned Value – Planned Value
Schedule Variance = $7,500 – $10,000 = -$2,500
We can also calculate the Schedule Performance Index (SPI), a measurement of how efficiently you’re executing your schedule, with these two data points. If your Earned Value is greater than your plan value then you’ll have a number that is greater than one, which indicates that you’re ahead of schedule.
In other words, for every dollar you thought you would have accomplished to date you have actually accomplished more than a dollar. If your Earned Value is less than your plan value you end up with a number less than one, indicating that you’re behind schedule.
Schedule Performance Index = Earned Value / Planned Value
Schedule Performance Index = $7,500 / $10,000 = .75
All that is done with two simple data points both easily calculated from your plan and from your value data. Note: keep in mind that Earned Value is not a great indicator of your ultimate schedule performance. It focuses on how well you’re performing the schedule for the work that is in process.
Cost Variance
Okay, let’s look at Cost Variance. The same simple math applies here. You are just swapping out your Planned Value with your Actual Costs. Cost Variance is calculated by taking your earned value and subtracting your actual costs. If your own EV is greater than your actual costs you get a positive cost variance. You’ve accomplished more than then you spent. That’s a good thing! The same concept applies if your Earned Value is less than your actual costs. In that case you would have a negative cost variance.
Cost Variance = Earned Value – Actual Costs
Cost Variance = $7,500 – $9,000 = -$1,500
How about how efficiently you are spending money on your project? That is your Cost Performance Index (CPI). Just like SPI, earn value is on top as my nominator, but this time actual cost is on the denominator.
If your Earned Value is greater than your Actual Costs you get a number greater than 1. That means you’re earning more than a dollar’s worth of value for every dollar that you spend. Congrats…you are going to underrun your project!
If your Earned Value is less than your Actual Costs you end up with a number less than one. In other words you’re only earning a fraction of a dollar for every dollar you spend. Uh oh, you’re going to overrun your project!
Cost Performance Index = Earned Value / Actual Cost
Cost Performance Index = $7,500 / $9,000 = .83
Forecasting
So what about forecasting? You can use the metrics calculated above to forecast out your future performance on the project based on your past performance. There are a bunch of different forecast methods available in Earned Value. I’m not going to go into the definition of all of them here, but just show a few different methods and how they’re calculated.
| Method | Formula |
|---|---|
| Cum to Date Cost Performance | BAC / CPI |
| Weighed Cost & Schedule Performance | AC + Remaining Work/(CPI*.8) + (SPI * .2) |
| Full Cost & Schedule Performance | AC + Remaining Work/(CPI * SPI) |
Once you have a forecast, called an Estimate at Complete (EAC), you can calculate your Variance at Complete by comparing it to your Budget at Complete. This will tell you how much you think you will be over or under on my project.
Variance At Complete = Budget At Complete – (Budget At Complete / EAC)
Variance At Complete = $17,500 – ($17,500 / .83) = -$3,584
You can even use the basic data points to figure out how you are going to have to perform going forward to hit your EAC using a metric called To Complete Performance Index (EAC) (TCPIeac). This metric is used to see how realistic your reported EAC is (or isn’t). It looks at what you are projecting your performance is going to be moving forward and compares that to how you have performed to date. If those two numbers are off by more than .1 they will typically read that as indication that your forecast is not reliable. Here is the formula for TCPIeac:
To Complete Performance Index EAC = (BAC – EV)/(EAC – AC)
To Complete Performance Index EAC = ($17,500 – $7,500) / ($21,084 – $9,000) = .83
CPI = .83 & TCPIeac = .83 – EAC is realistic
Summary
For as complex and confusing as earned value analysis might seem at first, hopefully you can start to see that, in the end, it is all based on some very basic concepts of how much you expect something to cost, how you plan to accomplish the work, how much have you accomplished and how much it actually costed you.
With these four basic data points, it is really easy to come up with how you’re performing against your schedule, how efficiently you are spending and what a project is ultimately going to cost you.
There are lots of variations on the above basics, but when you dig into them you will find most, if not all, are based on these same basic concepts. So next time you’re looking at that DAU gold card and you start to get overwhelmed by all the acronyms and metrics calculations remember it’s all based on four simple concepts and math you learned in elementary school.