Suppose you wanted to display two baselines on the Gantt chart: one baseline for measuring progress since the commencement of the project and another baseline for measuring the current month’s progress. Here’s how you can do this in Primavera P6.
This article describes how to create, assign, and display up to two baselines on the Gantt chart in Primavera P6.
In Primavera P6 you can create and assign a project baseline and up to three user baselines. The project baseline is normally the baseline set at the beginning of the project, and should fall under some kind of formal change management control process.
The other baselines are user baselines for more ad-hoc tracking of the project. For instance you may want the user baseline to help you measure schedule progress for the current month. You can also display two baselines on the Gantt chart. You could display one baseline for measuring progress since the beginning of the project and display another baseline for measuring progress for the current month.
The first step in the process is to create the baselines. This is done in Project | Maintain Baselines dialog. Click the + Add button to create a new baseline. The Add New Baseline dialog will appear and ask “what would you like to do?” You want to save a copy of the current project as a new baseline. In our demonstration we have already created two baselines, Figure 1.
 Figure 1
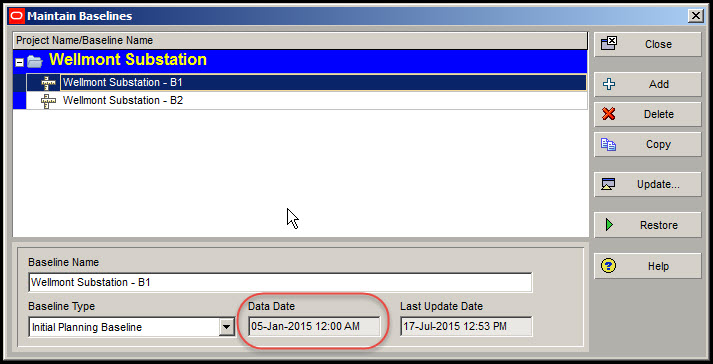
The first, Wellmont Substation – B1, was created at the commencement of our schedule, January 5th. We highlight Wellmont Substation – B1 in Figure 1 and note the Data Date of 05-Jan-2015. The second, Wellmont Substation – B2, was created after one month into the project. Again, we highlight Wellmont Sustation – B2 in Figure 2 and note the Data Date of 02-Feb-2015
Figure 2
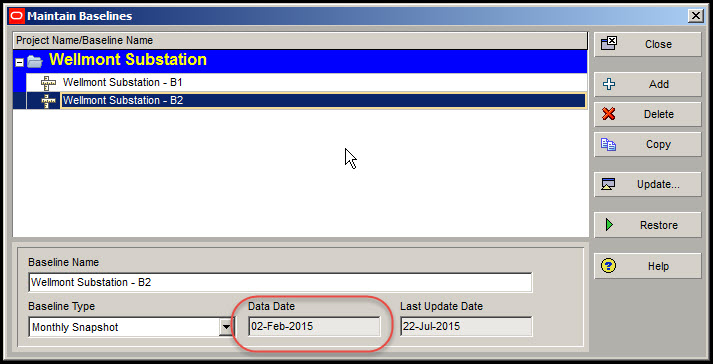
Also, note the Baseline Type of Wellmont Substation – B2 is set to Monthly Snapshot. If you do not have this Baseline Type go to Admin | Admin Categories. Select Baseline Types in the Admin Categories dialog. Click + Add and Primavera P6 will create a new baseline type, which you can name ‘Monthly Snapshot’.
Now we want to assign our baselines. To assign baselines select Project | Assign Baselines. In the Assign Baselines dialog, Figure 3, we set the Project Baseline to Wellmont Substation – B1, set the Primary Baseline to Wellmont Substation – B1, and set the Secondary Baseline to Wellmont Substation – B2.
Figure 3

Great! We created our baselines and now they are assigned.
The next step is to create and/or set up Gantt chart bars for our baselines. Select View | Bars. You should already have a Gantt chart bar labeled Primary Baseline. Toggle the Display on for this bar, Figure 4.
Figure 4
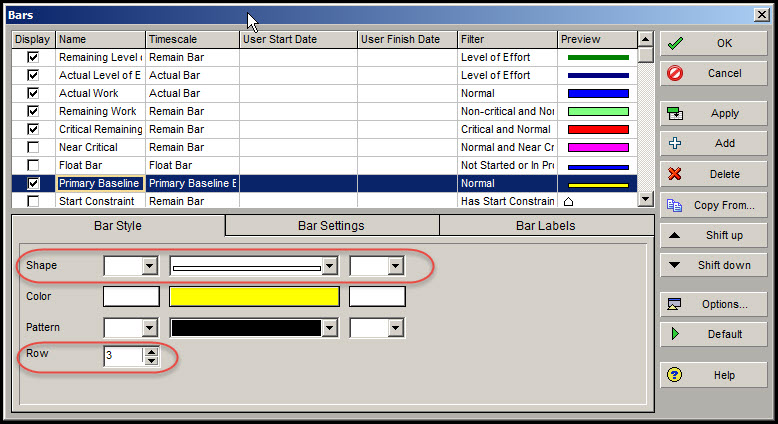
In the bottom frame of the Bars dialog select the Bar Style tab. Adjust the shape of the Primary Baseline Bar, as appropriate. Also, in the Bar Style tab set the Row to 3. So our Primary Baseline that is equivalent to the Project Baseline will be displayed on Row 3, the bottom row.
Let’s now create a new Bar for our Secondary Baseline. In the Bars dialog select + Add. This creates a new Bar, which you can name Secondary Baseline, Figure 5.
Figure 5
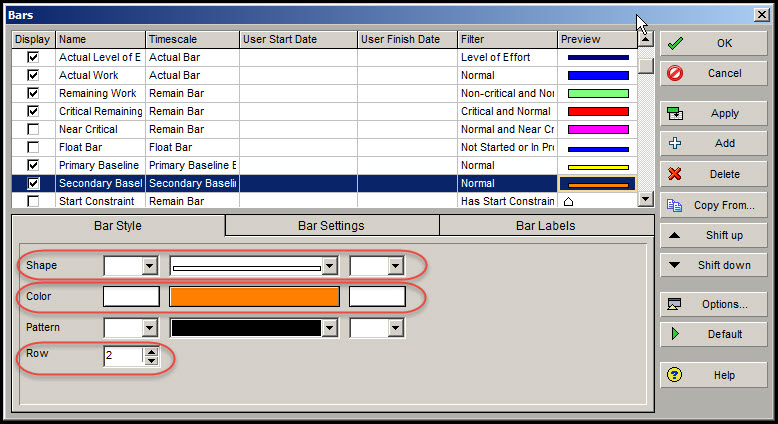
Set the Timescale to Secondary Baseline. Set the filter to Normal. In the bottom frame Bar Style tab adjust the shape, accordingly. Choose an appropriate color, such as orange. Last set the Row to 2. Your Secondary Baseline Bar definition should look similar to Figure 5. If so, select OK.
At this point you still may not see two baselines on your Gantt chart. To rectify this situation select View | Table Font and Row. In the Table, Font and Row dialog toggle off the Keep Current Row Heights option, Figure 6.
Figure 6
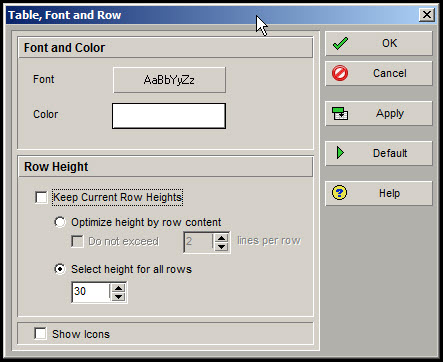
Toggle ‘Select height for all rows’. Increase the row height to, say, 30.
Your Gantt chart should now look similar to Figure 7.
Figure 7
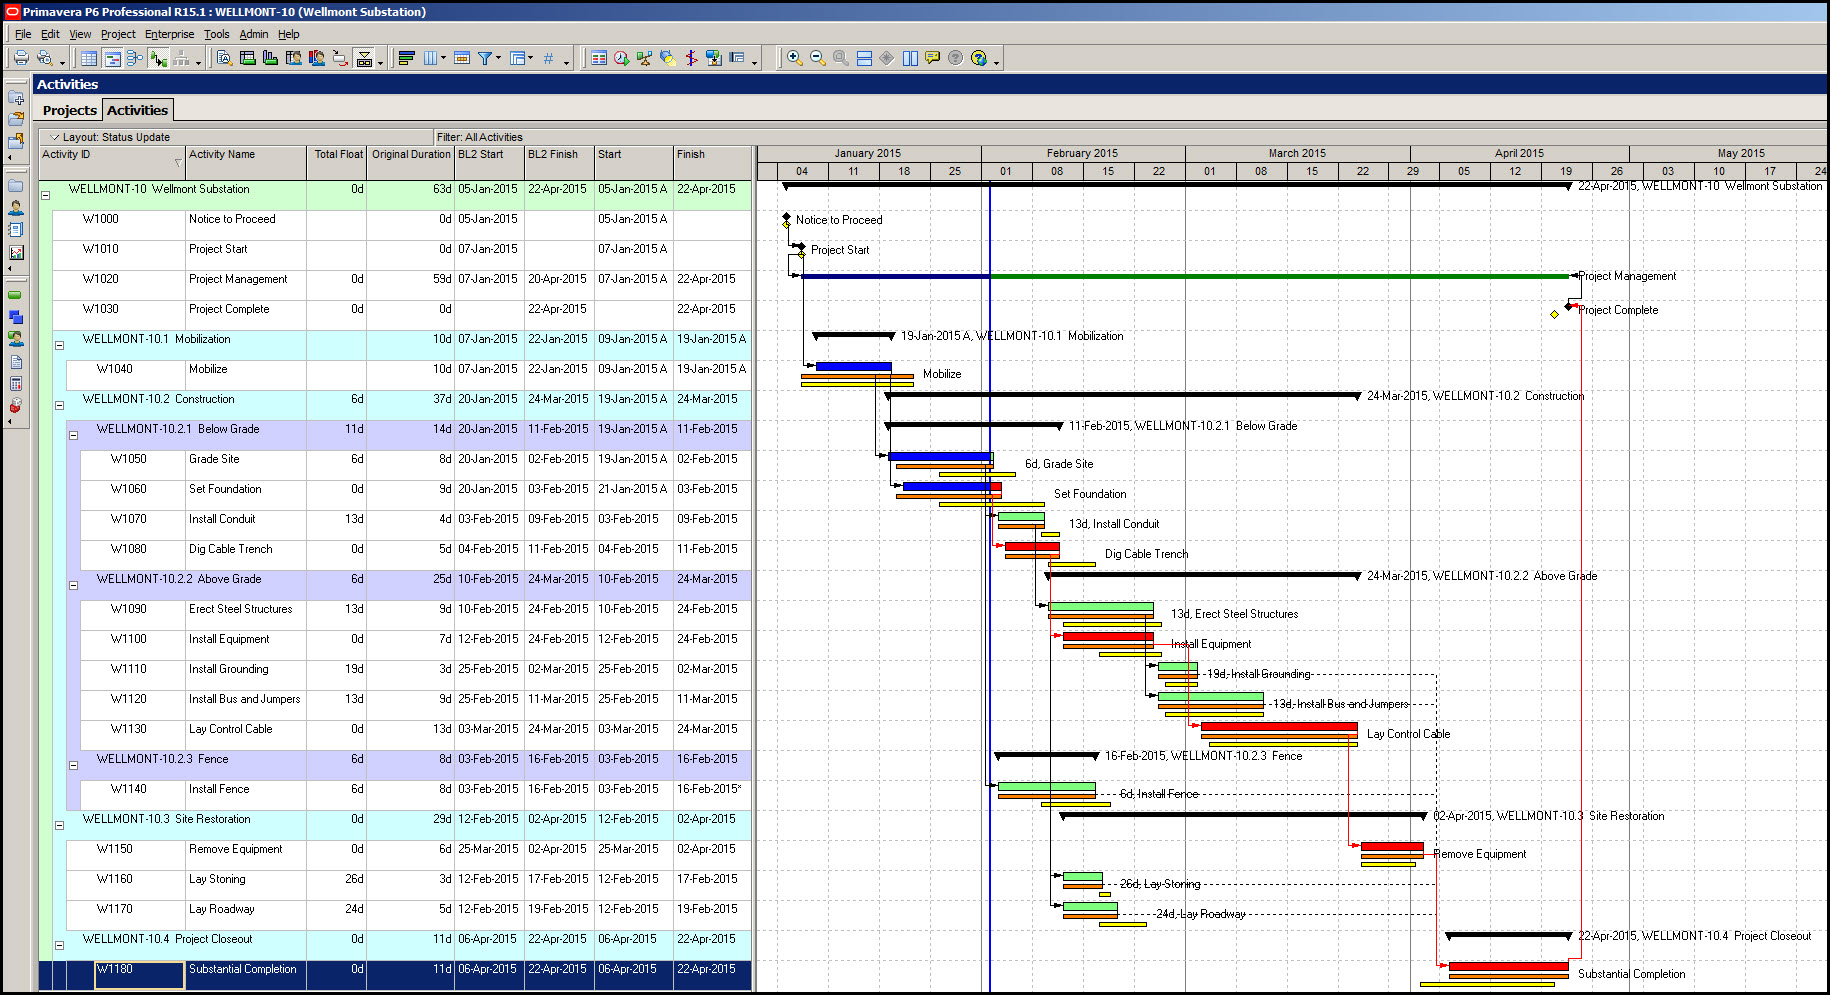
The orange bars represent the Secondary Baseline on Row 2. This baseline will measure progress since February 2nd, 2015. The yellow bars are the Primary Baseline displayed on Row 3, and measure progress since project inception, January 5th. Now you can see your project progress since the beginning in January. And you are all set to measure progress for the month of February.
Summary
Several Bars may be displayed on the Gantt chart enabling you to show at least two baselines. This allows you to, for example, track schedule progress since project inception and, additionally, progress for the current month.
The basic steps to displaying Gantt chart baseline bars is to create the baselines, assign them, and then define a unique Bar for each baseline. In your Bars definition it is important to set the appropriate Row number. Also, if all the defined Bars are still not appearing you may have to increase the row height using the Table Font and Row feature. By adjusting the shape of the Bars in the Bar Style tab you can, possibly, display two Bars per Row. You may have to experiment with the Bar Style shape and Row number definition to get the Gantt chart to appear the way you want it to.