Oracle Primavera P6 Professional supports Gantt chart reporting with numerous labeling possibilities that not everyone is familiar with. Primavera P6 has both predefined labels and associated filters and the ability to create new bar labels. Some of these labeling options for Gantt charts are ideal for reporting to stakeholders and senior management. Come along for the ride as we tour a few of the bar labeling options in Primavera P6 Professional.
Bar Tool
Clicking on the Bars icon in the layout toolbar or selecting View | Bars in the main drop down menu at the top of the screen will bring up the Bars dialog displayed in Figure 1. As shown in Figure 1, Primavera P6 has numerous predefined Bar labeling features available. You can also create new Bar labeling features.

Figure 1
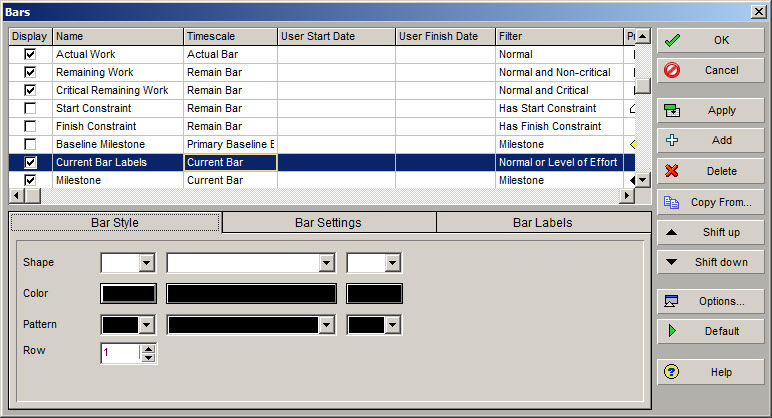
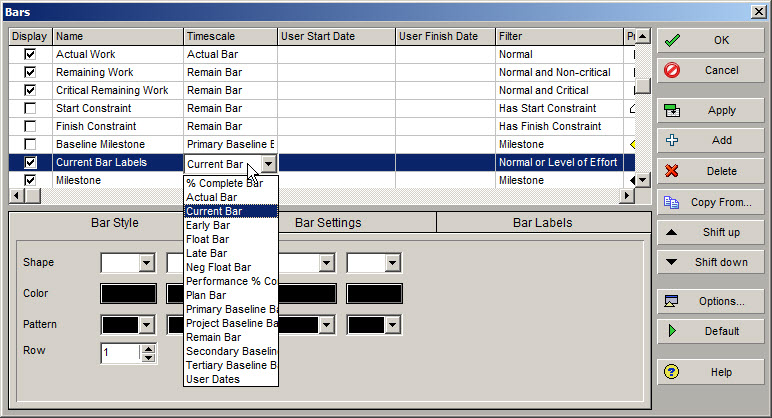
The first column in the Bar dialog is an on and off toggle switch that is used to designate which Bar features are active for the Gant chart. The name of the Bar feature is in the second column. For our example the Bar’s Name is “Current Bar Labels”. In the third column you can select the Timescale from a drop down menu. As displayed in Figure 2, there are numerous Timescale options available. Select the “Current Bar” Timescale for the “Current Bar Labels” defined Bar.
Figure 2
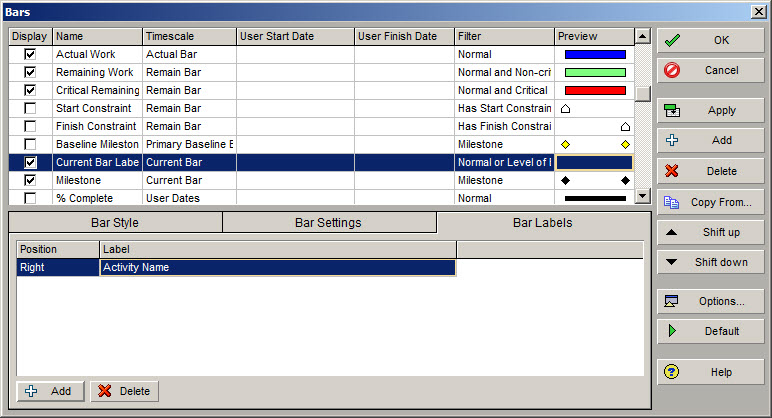
The sixth column, Figure 3, is the Filter column that Primavera P6 uses to specify to which Gantt chart bars to assign the respective features. These filters are not discussed in detail in this article. The last column previews what Gantt chart object will be affected by the selected Bar features. Nothing is displayed for the “Current Bar Label”, as this will be applied to several Gantt chart objects.
Figure 3
Labeling Gantt Chart Objects
There are a few steps to labeling a respective Bar on the Gantt chart.
- First, select the desired Bar feature. In our case select the “Current Bar Label” user defined feature.
- Second, note that below the available Bars are three tabs: Bar Style, Bar Settings, and Bar Labels.
- Third, select the Bar Label tab, and then click the + Add button on the lower left of the dialog. This allows the scheduler to add a label to the respective Gantt chart object. Under the Position column, the scheduler selects the placement of the label.
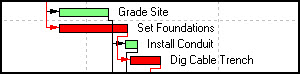
For our example select Right, so the label will be positioned to the right of the Gantt chart object. A whole list of options are available for the Labels column. For this example, select the Activity Name to display the activity name to the right of the Gantt chart object. Again, refer to Figure 3. Last, click Apply and the Gantt chart bars will be labeled as displayed in Figure 4.
Figure 4
Side vs. Below Activity Labels
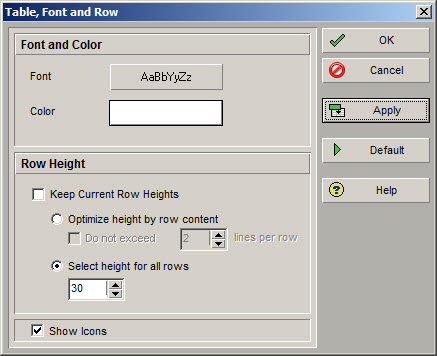
For activities where the duration is long, such as 44-days, the scheduler may want to display the Bar label below the Bar. This requires one additional step to that just described. For our example select the “Current Bar Label”, and the Bar Labels tab. The Position this time will be Bottom-Center and the Label shall again be Activity Name. This places the label below and centered on the Bar. You may not be able to see the Activity Name when you click apply because the row height is too small. To correct this issue select View | Table Font and Row from the main drop down menu. This brings up the dialog in Figure 5. Uncheck the Keep Current Row Heights box, and then toggle on the Select height for all rows. Increase the row height to, say, 30, and then click Apply.
Figure 5
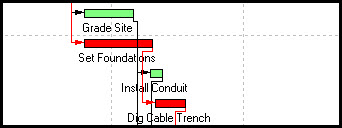
You should now see the Activity Name label displayed below and centered along the Bar, as displayed in Figure 6. Of course, our example has short activity durations, but when activity durations are long, displaying the Activity Name below and centered on the Bar brings more clarity to the Gantt chart.
Figure 6
Summary
Primavera P6 Professional has numerous Gantt chart labeling options. It is typical to display the Bar labels to the right of the Bar, but Primavera P6 also has the option to display the Label below the Bar, which is particularly useful for Gantt charts that have long activity durations.
Placing the Labels below the Bar requires the additional step of increasing the activity table and Gantt chart row height. Placement of the Bar labels is one of numerous options in Primavera that allow you to clearly show the Gantt chart for tracking and reporting activity progress.