To better understand the total float of tasks in your schedule, it’s often very useful to display these on the Gantt chart in Microsoft Project. A Gantt chart view of total slack may complement or even provide more insight than a tabulated list of values.
Let’s say that your upper management wants you to consider options for delaying tasks to move resources to, possibly, “crash” a critical path activity. Most likely, this request would come as a result of an active project’s status report update. So some of your tasks, such as the milestone for project start, would already be completed. Thus, you only want to view on the Gantt chart the total float of tasks that are not started or in progress, as it wouldn’t make sense to show the total float of a completed activity.
This article discusses how to use the Bars Styles feature in Microsoft Project to set up total slack bars that will logically display the total float of tasks on the Gantt chart. Although this article features Microsoft Project 2013, these capabilities are available in most versions in common use today.
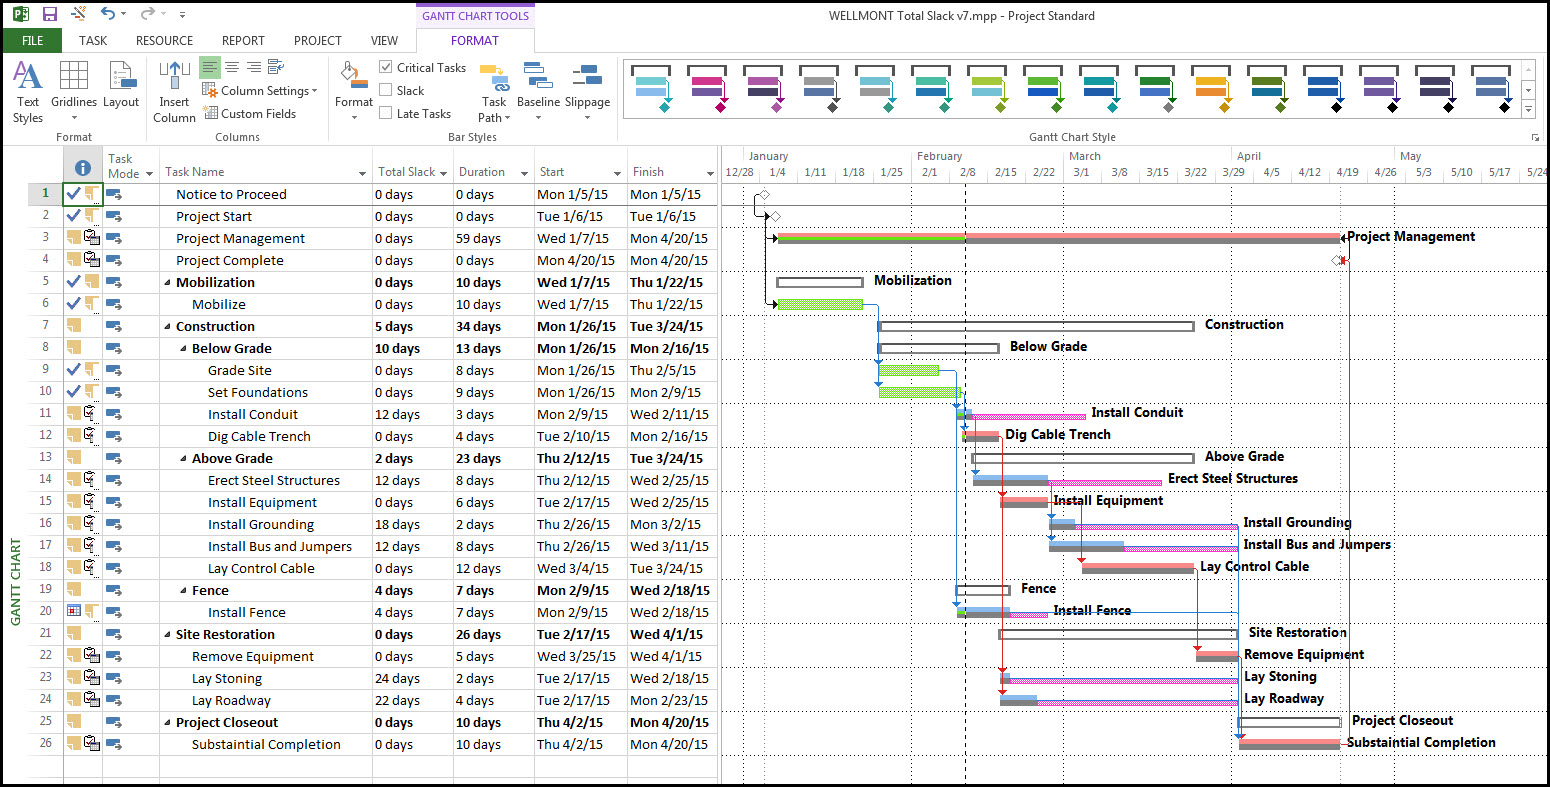
Figure 1 displays a schedule that has been status updated through February 10th, 2015.

Figure 1
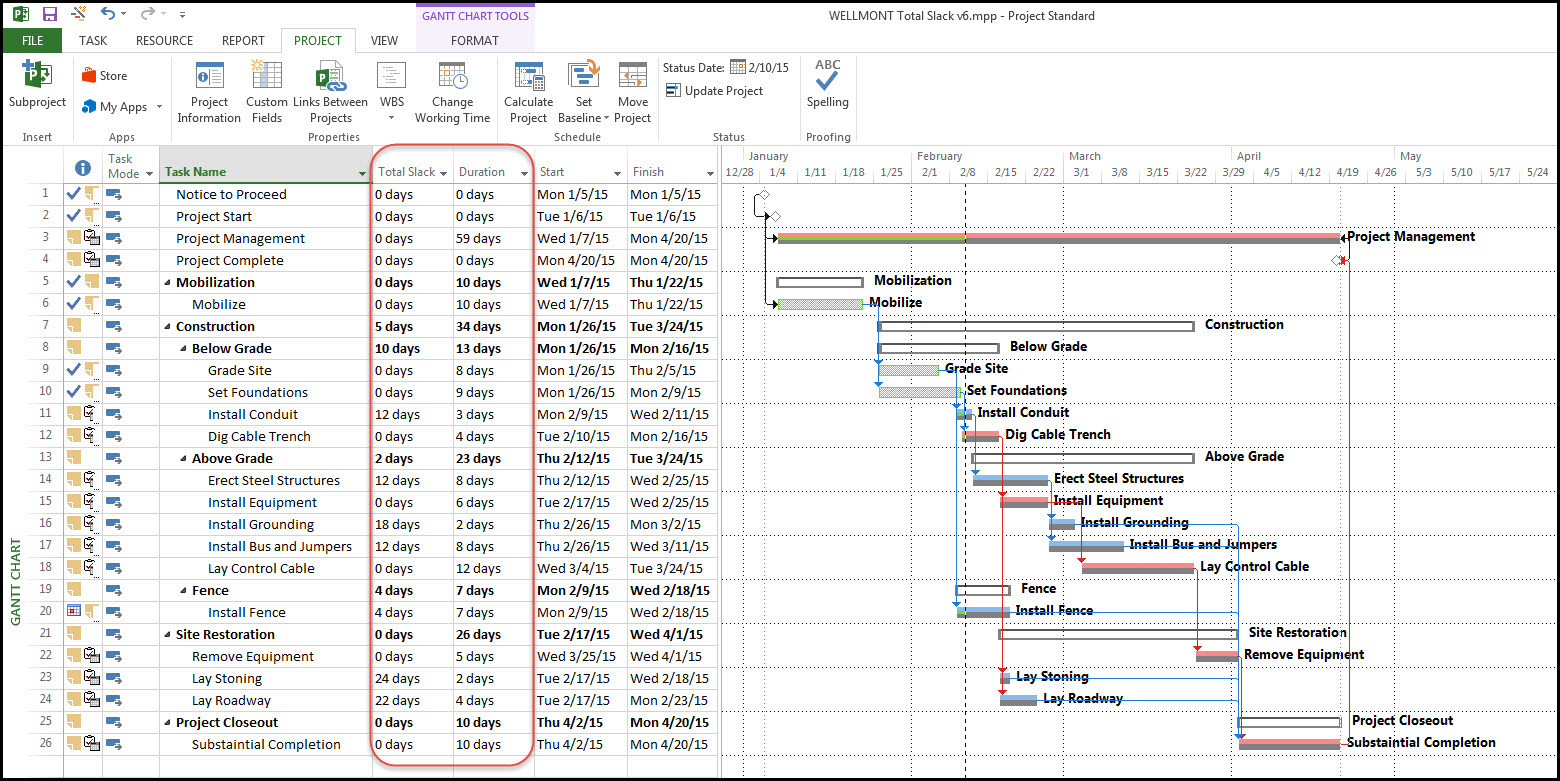
Note that the green bars designate completed tasks, blue bars are tasks with float, and red bars, of course, are critical path tasks. The grey bars are the baseline. Also, the total slack and duration of each task is tabulated in the task view.
To gain insight into schedule flexibility you will want to display the total slack of tasks that are either not started or in progress, but not completed. This will provide you a better understanding of tasks that may be delayed to support resource leveling or crashing a task. Displaying the total slack of both not started and in progress tasks requires the creation of one task bar. This convenience is due to the fact that Microsoft Project 2013 automatically specifies the total slack of completed tasks as zero. We therefore do not need to worry about having to filter out completed tasks from our bar styles features.
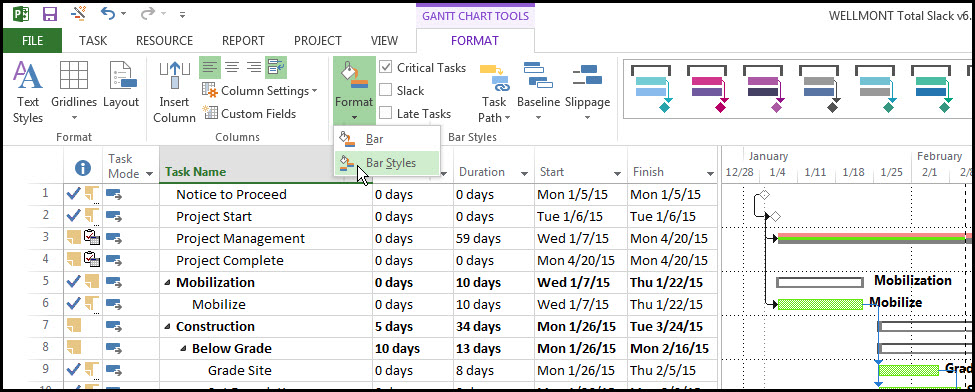
To insert a new bar select Format tab, Bar Styles ribbon group, Format drop down menu, and Bar Styles, Figure 2.
Figure 2
Enter the bar name and adjust the appearance with an appropriate color and shape, Figure 3.
Figure 3
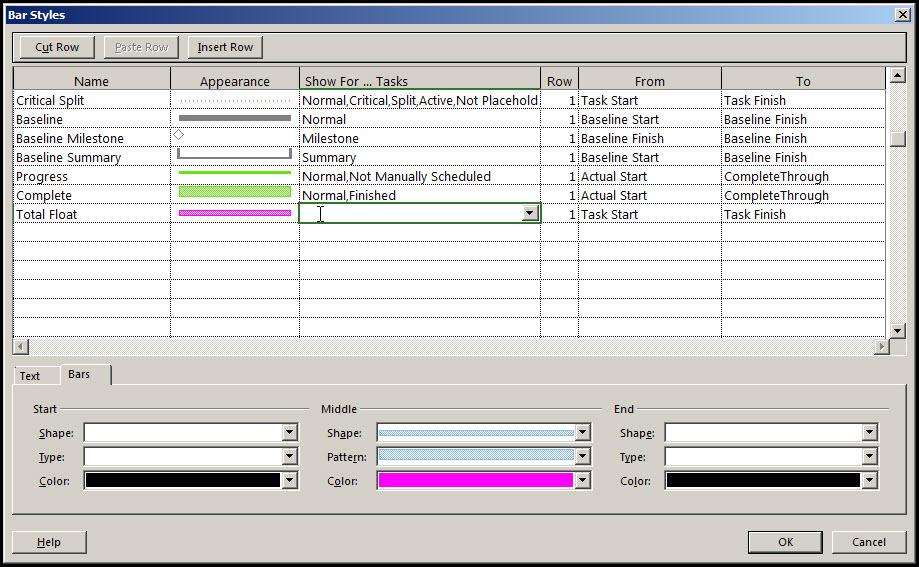
I chose magenta to display total slack. Again, note that completed tasks have a green task bar. As displayed in Figure 4, in the ‘Show For … Tasks’ column, we select the desired bar feature for our example, which is ‘Normal’.
Figure 4
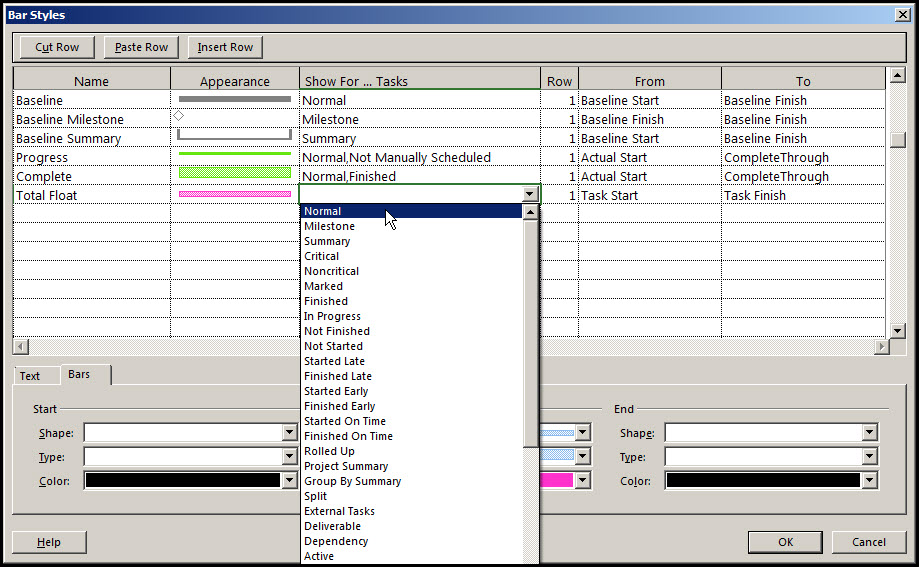
Only one feature is required to display the total slack of both ‘Not Started’ and ‘In Progress’ tasks.
If we only want to display the total slack of ‘Not Started’ tasks then we need to specify two features: 1) Normal and 2) Not Started. Note the only way to invoke more than one feature is by manually typing in each feature instead of using the drop down menu selection. The comma feature separator is essentially an ‘And’ conjunction that will require every typed in feature in this column to be true for the bar to be visible.
We have one criteria for the total slack bar in our schedule. We want the tasks to be normal. To avoid cluttering our schedule with too many total slack bars, we do not want to display total slack for our milestones nor summaries. Besides, the only way we can use float to compress our schedule is by adjusting normal tasks to free up resources for crashing various other critical path tasks.
To continue our bar styles definition we next want our float bar to be shown from the Task Finish to the Total Slack, Figure 5.
Figure 5
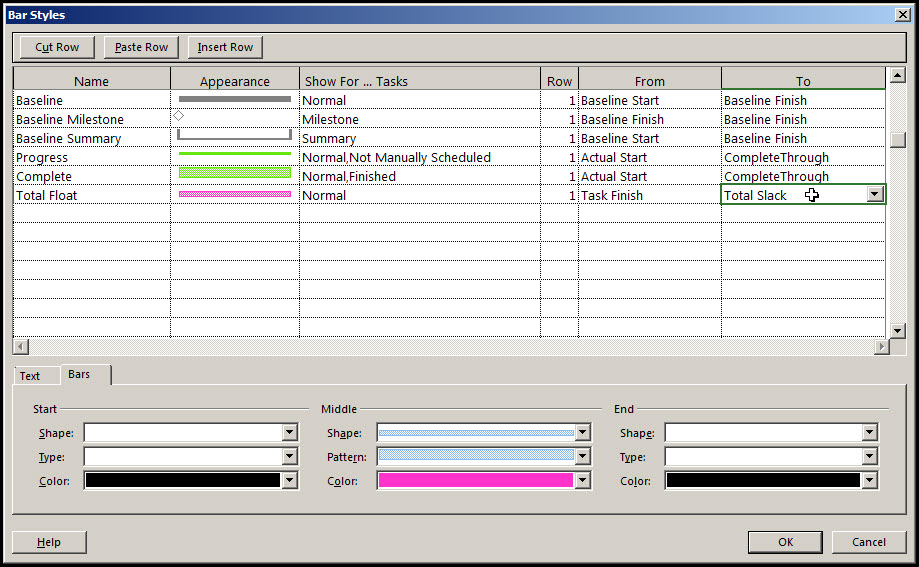
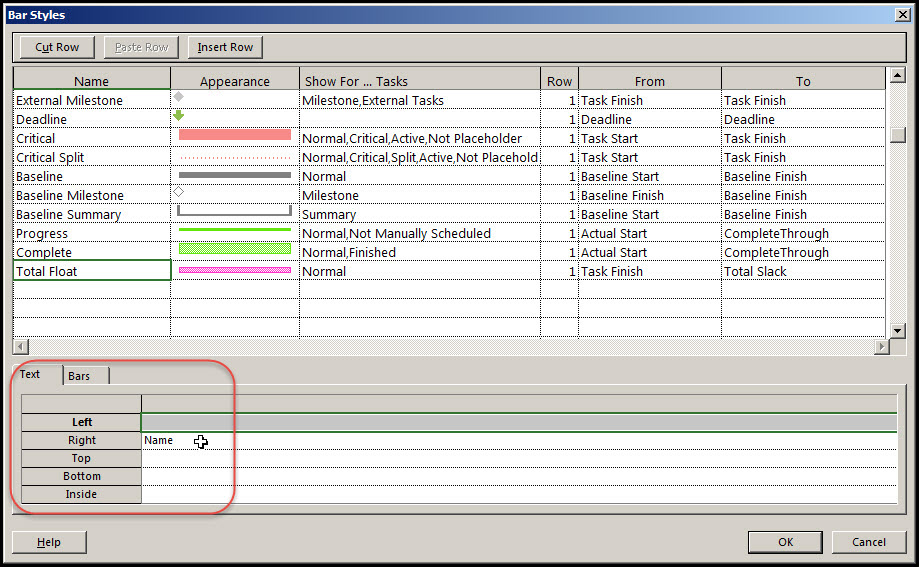
Finally, we want to turn off the name label for the Task bar and turn on a name label for our Total Float bar, Figure 6.
Figure 6
Now the total slack of all the normal and not completed tasks are displayed, Figure 7.
Figure 7
Summary
It is possible in Microsoft Project to display the total slack of tasks that are either not started or in progress, while hiding the total slack of completed tasks. Well, the total slack of completed tasks is not displayed because Microsoft Project automatically specifies the total slack of these tasks as zero.
If needed, the ‘And’ comma conjunction allows you to specify numerous desired features in the ‘Show For … Tasks’ column bar style definition. For our schedule we only need to specify that our tasks are ‘Normal’. Thus, Microsoft Project bars styles features enable you to display the total slack of tasks on the Gantt chart that will help describe and better visualize schedule float.