 Acumen Fuse’s Intersection Analyzer
Acumen Fuse has many metrics to inspect the health of your project. The question is how can you focus in on a single metric and compartmentalize the performance?
The Deltek Acumen Fuse ribbon analyzer provides metric group results for the whole life of the project; the phase analyzer separates these results into project intervals. The intersection analyzer is a third analyzer that inspects a metric result at the intersection of the ribbon and phase analyzers. It provides analysis for a single metric at each phase of the project. So, you can look at one metric within a specific ribbon and period.
This article demonstrates how to use the intersection analyzer to review the schedule’s health through the prism of a single metric separated into intervals.
We begin with our demonstration Wellmont01 schedule imported into Acumen Fuse, Figure 1.
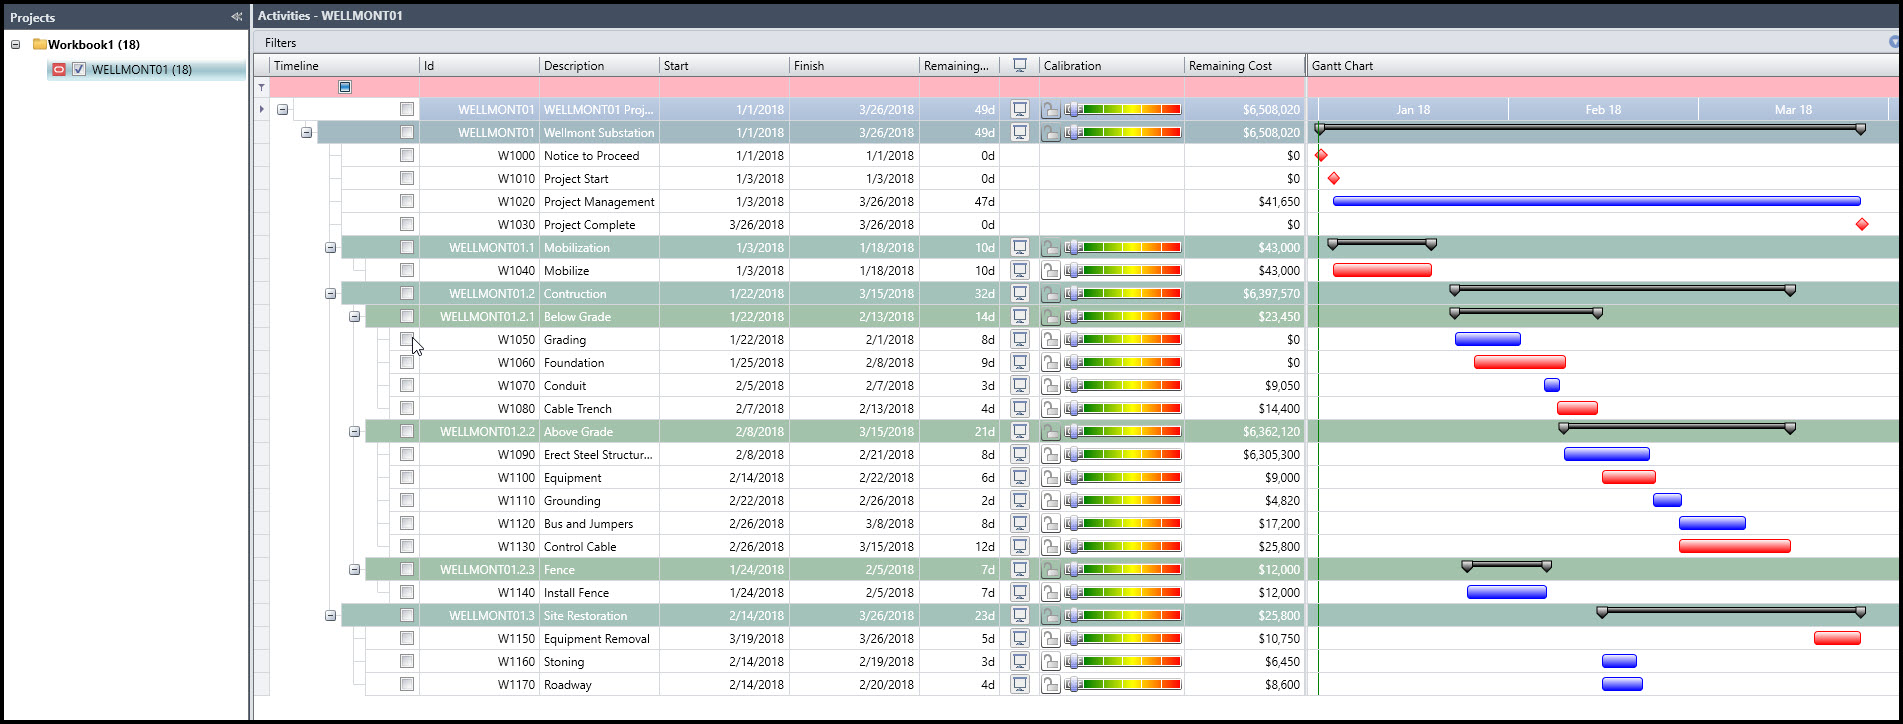 Figure 1
To perform diagnostic analyses of the schedule, select the S2 // Diagnostics tab, Figure 2.
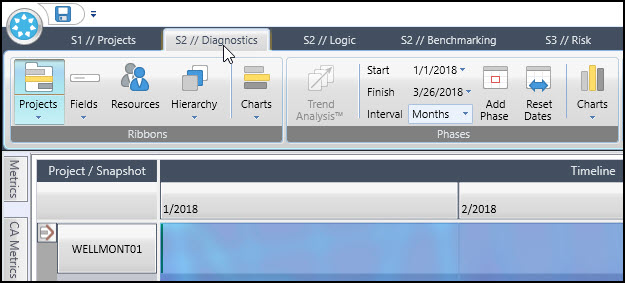 Figure 2
Let us proceed and perform a schedule quality metric group analysis on the schedule. With the schedule quality metric group selected as the active metric group in the bottom playlist choose the fuse button, Figure 3.
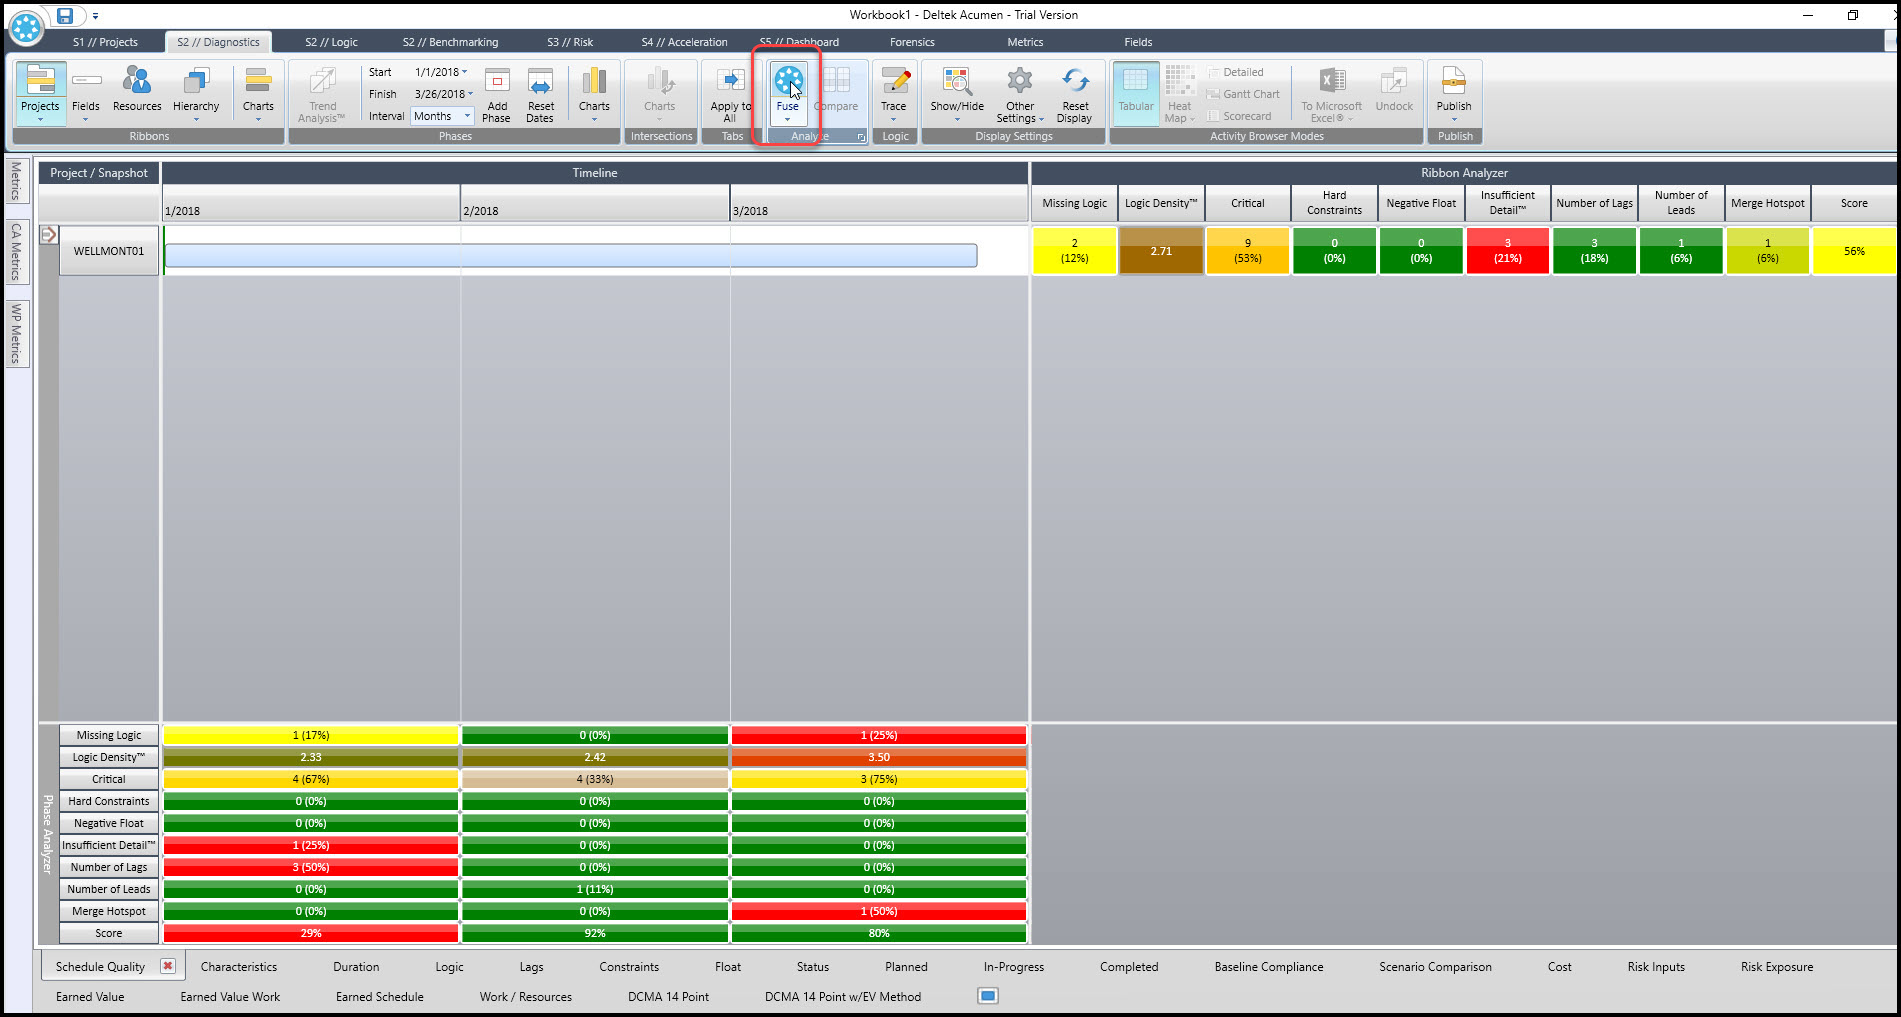 Figure 3
In the upper right are the results of the ribbon analyzer, which, again, displays how the schedule quality metric group performed for the whole life of the project, again, Figure 3. The lower left presents the phase analyzer that separates the metric group results into phases. The intersection analyzer is not currently shown. To activate and display the intersection analyzer, we must first add a metric to the intersection analyzer. Hoover the mouse over the metrics tab on the upper left of the screen, Figure 4.
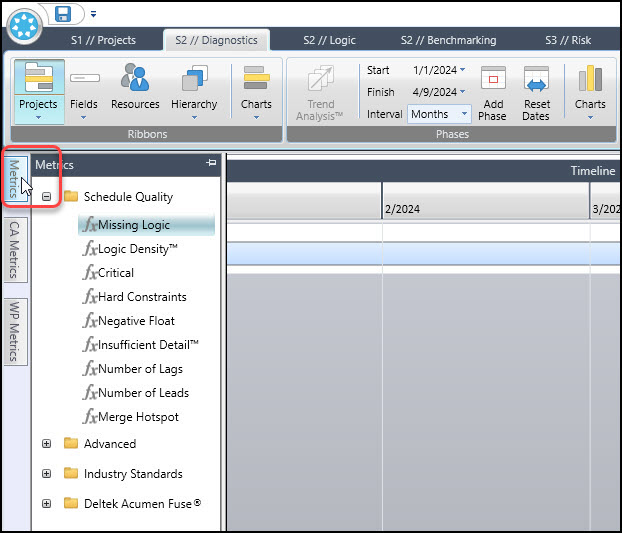 Figure 4
Drill down into Advanced | Logic, then select and right click on the Logic Density metric, Figure 5.
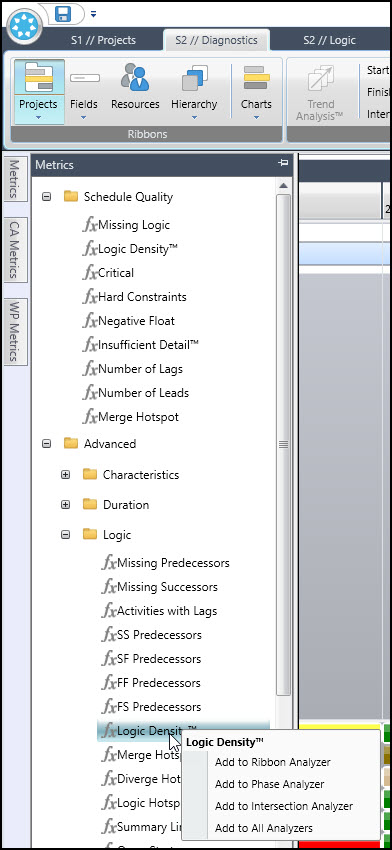 Figure 5
From the popup menu choose ‘Add to intersection Analyzer’, Figure 6.
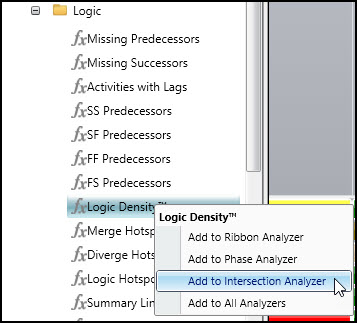 Figure 6
Continue and click the Fuse button again to run the Fuse analysis, Figure 7.
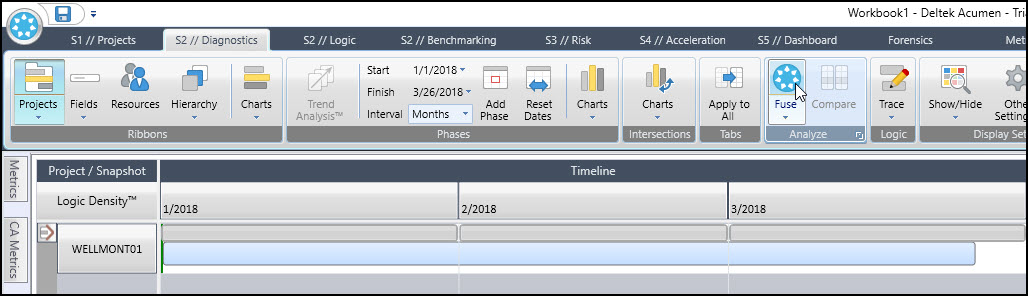 Figure 7
The Logic Density intersection analyzer results appear in Figure 8.
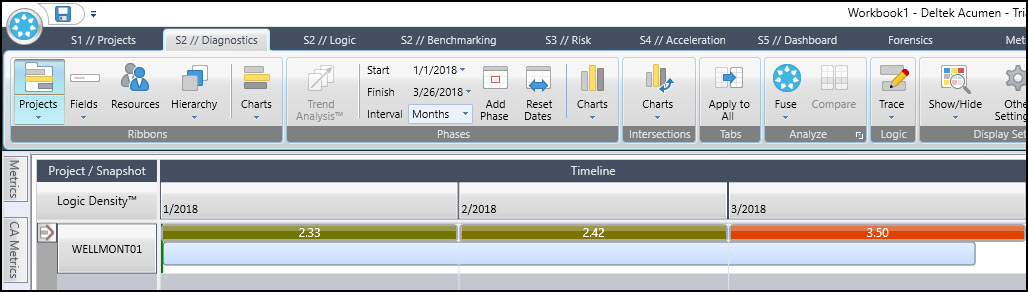 Figure 8
Great! We now have focused in on the Logic Density metric, and we now can see how the schedule performs for this metric during each month of the project: January, February, and March. Logic density is an average of how many relationships are associated with each activity. Each task should have at least one predecessor and one successor, so a score of 2 is on target.
January and February fall in this range, so they are good. March with a score of 3.50, however, is a concern. March looks like it may have redundant logic and requires further review.
Well, this Logic Density investigation has demonstrated how concentrating on the prism of a single metric separated into intervals provides valuable insight into the weak spots in the schedule’s health.
Let’s proceed and investigate remaining cost. To display the Remaining Cost metric in the Intersection Analyzer we continue.
- In the upper far left hoover the mouse over Metrics.
- Drill down into Advanced | Cost and left click on Remaining Cost and then right click on it.
- From the popup menu choose ‘Add to intersection Analyzer’, Figure 9.
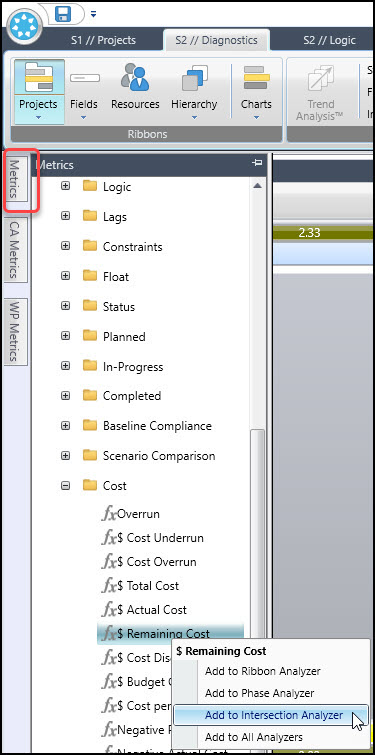 Figure 9
- Click the Fuse button again, which will remove Logic Density from the Intersection Analyzer and both add and calculate the Remaining Cost metric.
There you have the remaining cost for each period: January, February, and March in the intersection analyzer, Figure 10.
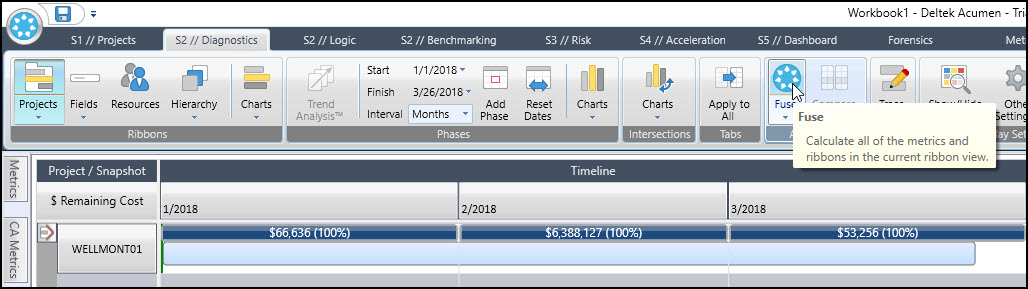 Figure 10
The following steps display the intersection graphical column chart:
- In the intersections group click the bottom portion of the Charts button, Figure 11.
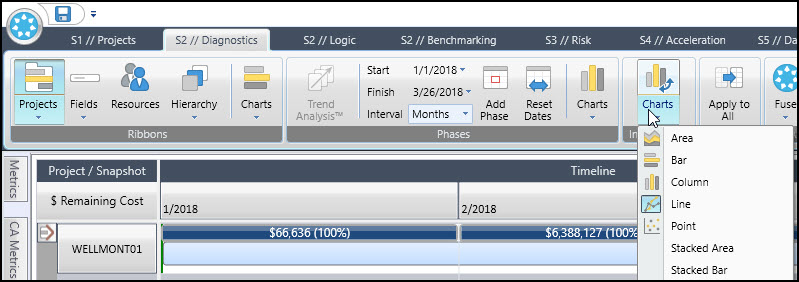 Figure 11
- From the drop-down menu choose column.
 Figure 12
- In the intersections group, click the top portion of Charts.
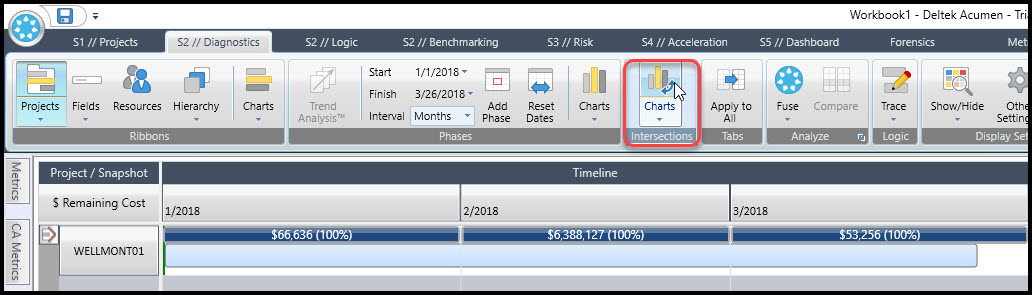 Figure 13
Acumen displays a column chart displaying the remaining cost for each period, Figure 14.
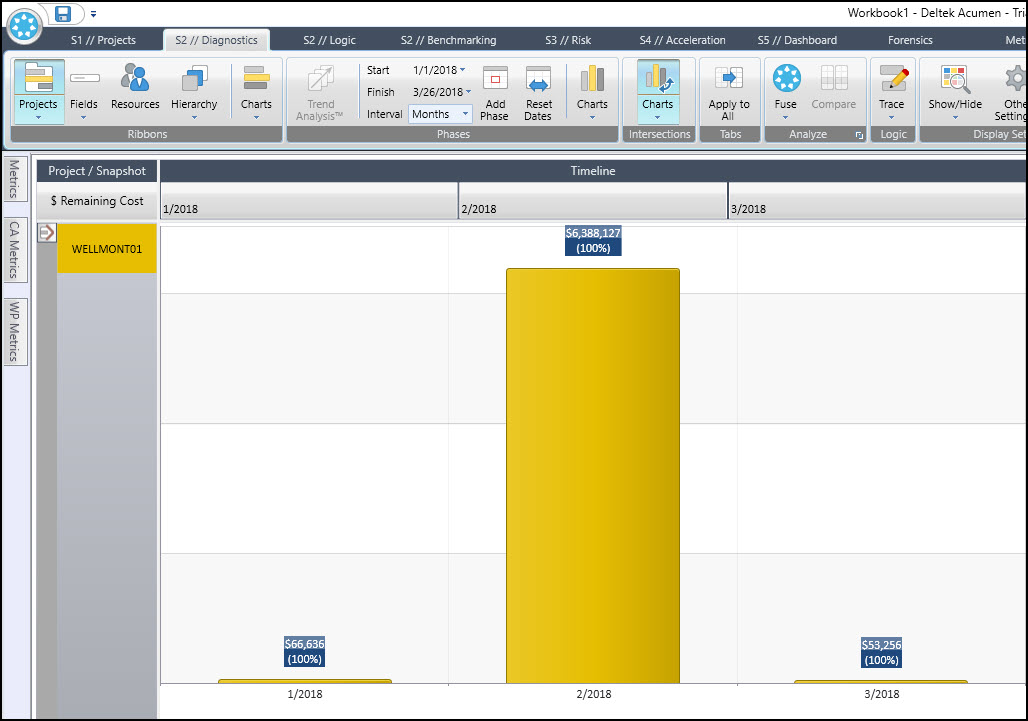 Figure 14
The bar chart really highlights the significant spending in February. So, we now know that February is the month to examine when considering cost cutting efforts that could achieve a material impact on the schedule’s cost.
- To return to the tabulated data, again, click Charts in intersections, Figure 15.
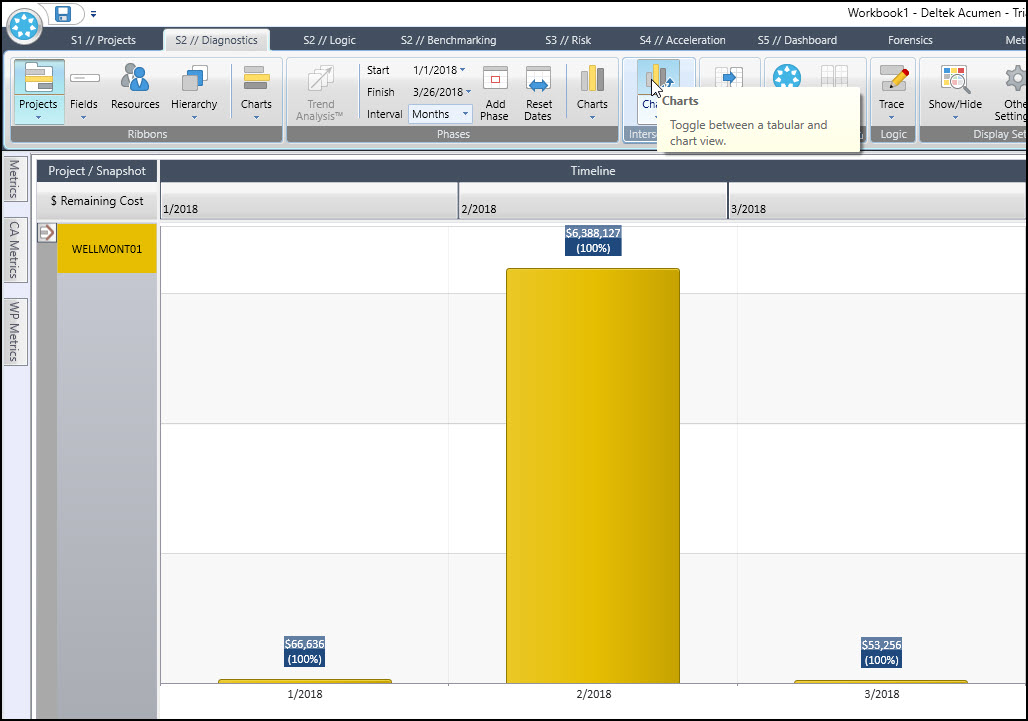 Figure 15
- To remove the intersection remaining cost data, hoover the mouse over the $ Remaining Cost field and click the X button to remove, Figure 16.
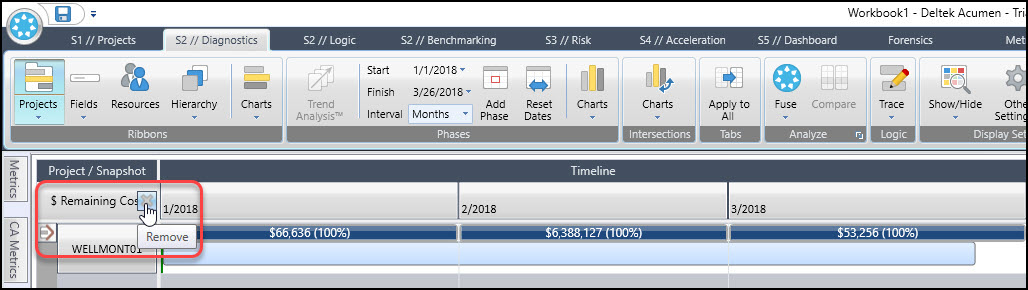 Figure 16
The intersection analyzer is removed, Figure 17.
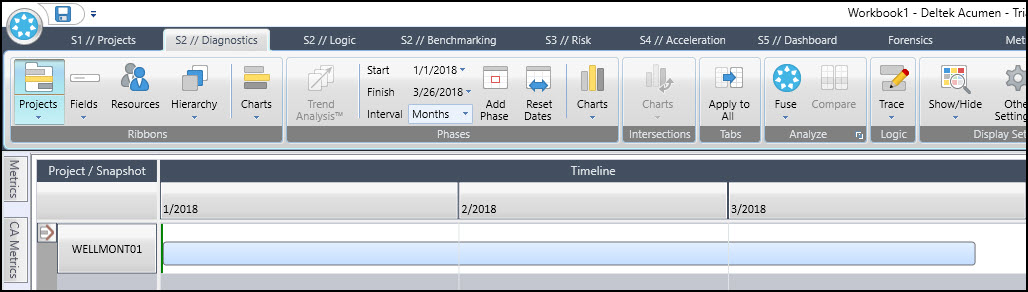 Figure 17
So that concludes our demonstration on the intersection analyzer’s ability to center an investigation in on a respective metric separated into intervals.
Summary
Acumen Fuse has three analyzers: ribbon, phase, and intersection. Again, the ribbon analyzer shows the metric group results for the life of the project. The phase analyzer separates the metric group results into phases. The intersection analyzer is limited to report one metric at a time.
However, the intersection analyzer is the most detailed of the three analyzers as it pinpoints exceptions within a ribbon and phase combined. In this way the scheduler concentrates the analysis on a single metric and interval, which can expose and/or confirm weak areas in schedule health.