Have you seen those line graphs that are created from earned value management systems? They might look confusing but they are actually pretty simple to read once you know what they show. In this article, we’ll look at two earned value graph examples and explain what they are telling you in terms of project performance.
The data analysis and graphs for earned value analysis is one of the key reporting artifacts for project managers and it’s an effective control tool. If your team uses it, here’s what you need to know.
What is the earned value graph?
The earned value graph you see most often is the S-curve that shows all the different data points. It gives you a visual representation of variance and the difference between planned value, actual cost and earned value. It has three lines, often in different colors to make them easier to identify. The lines represent budget, actual expenditure and earned value.
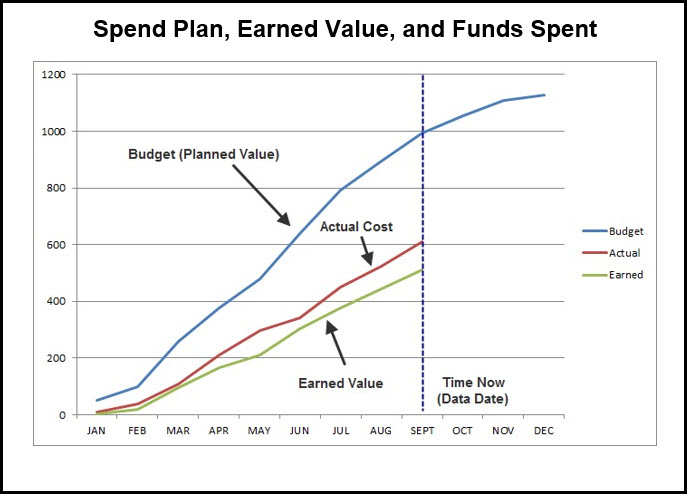
The earned value graph created from your project data will look a bit like the image below.
Can you make an earned value graph in Excel?
You can make an earned value graph in any tool that allows you to enter the data and plot out a line graph of those numbers.
However, we would not recommend using Excel when there are other, more specialized project management software tools for earned value reporting, like Deltek Cobra. If you are serious about using earned value management as a way of measuring project performance and predicting likely future performance, then it’s worth investing in a system designed to do that as it will save your team a huge amount of time in the long run.
If you are simply putting together a one-off graph for earned value, for example as part of a college assignment, then by all means you can use Excel to do that.
How to read an earned value graph
The earned value graph example above shows three lines.
Planned value: This is the project’s budget. The data is time-phased across the life of the project which in this case is January to December. It’s a cumulative line so the number goes up as each month the project spends more. Typically, projects spend less during the initiation and set up phase as that’s when there is a lot of talking and negotiating.
Then, when the project moves into the delivery phases of the project life cycle, you could see some steep inclines as the project invests in the equipment or resources required to get going. It’s rare in our experience for the line to be even across the whole project: if this is the case for your graph, then it would be worth checking to see if the budget has simply been split evenly month by month across the project duration instead of being carefully phased for when the money is actually going to be spent. This line will start at the project’s inception date and continue until the end of the project as you should have the information for the whole project.
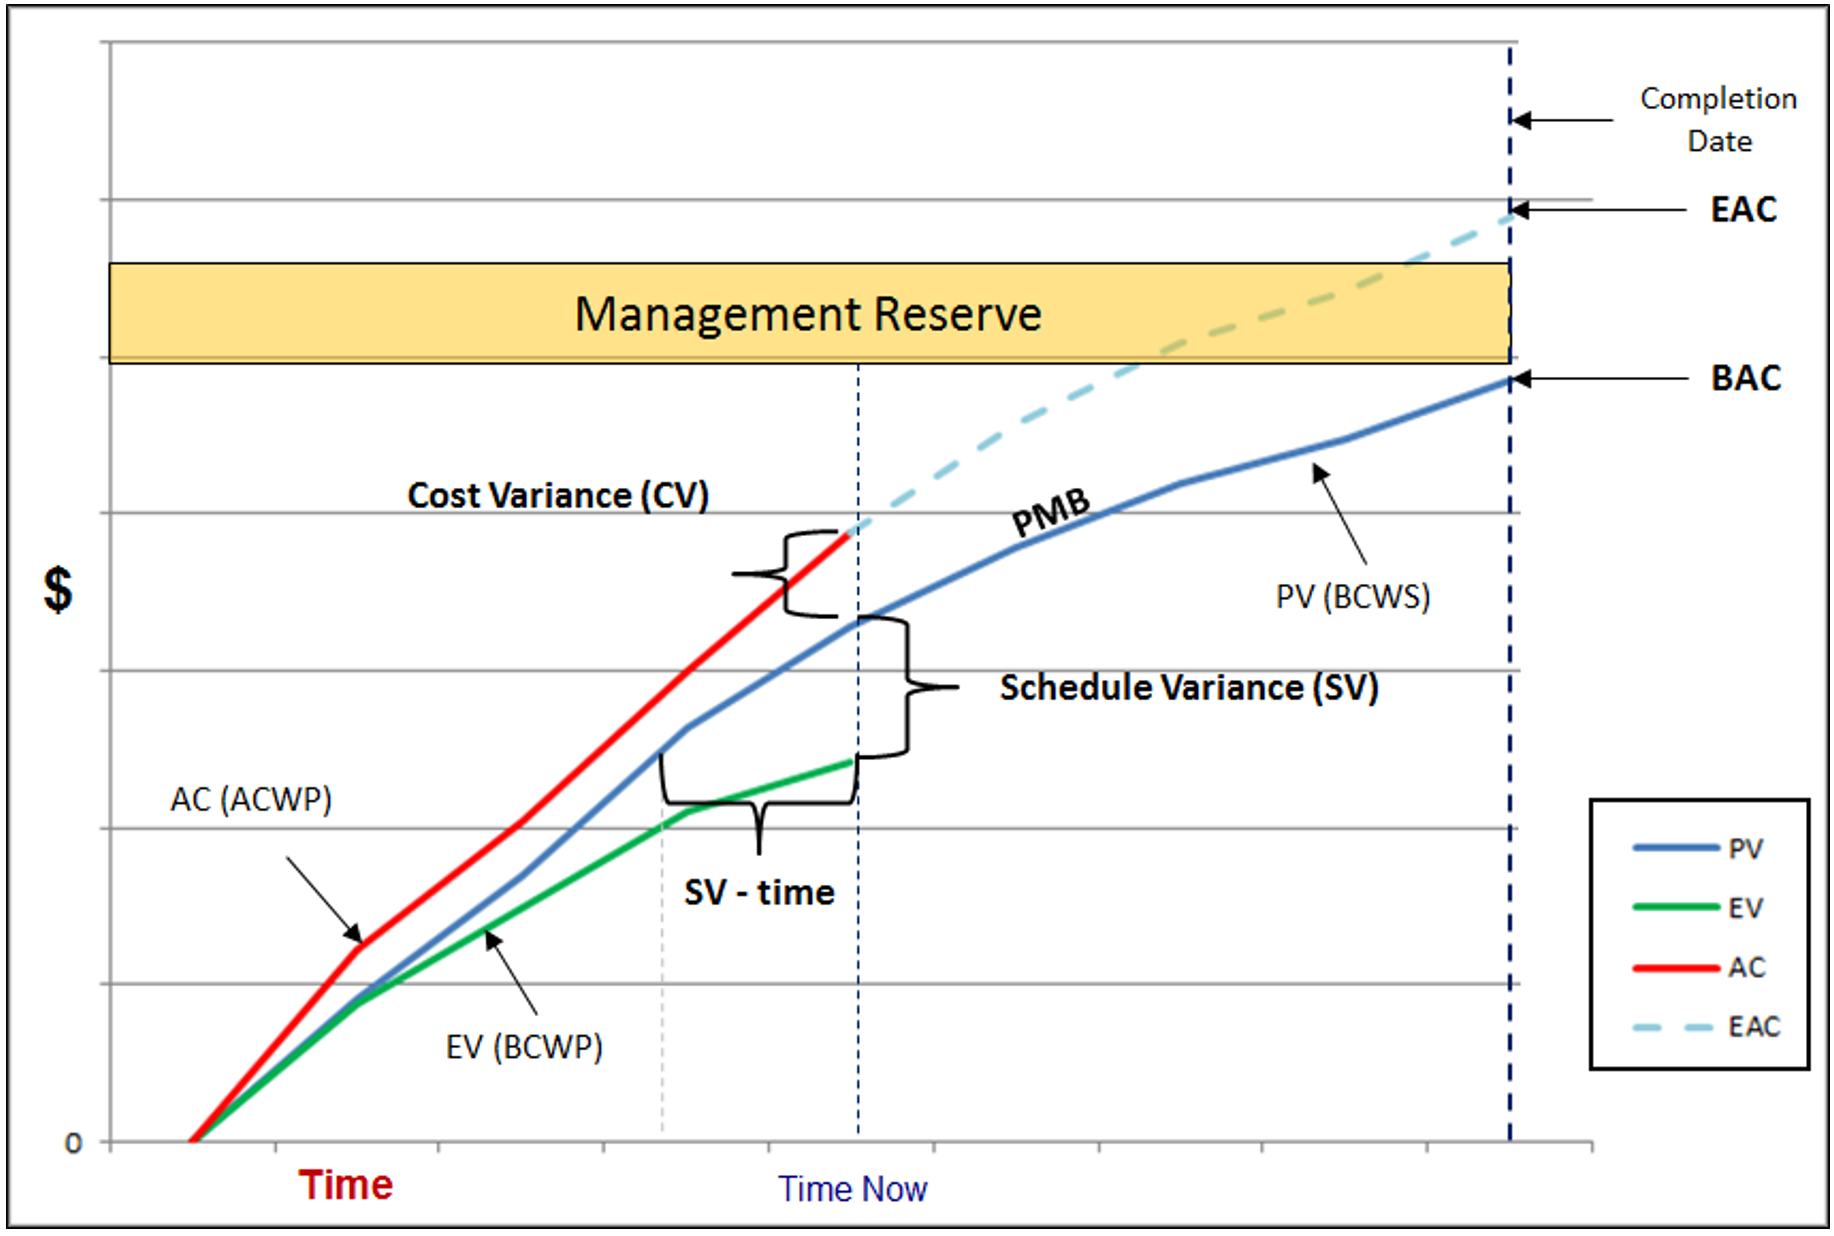
Actual cost: This represents the costs incurred on the project. The line stops at today’s date because you cannot record actual cost for future months. On the example graph above, you can see that’s the red line and it stops in September, reflecting the month that this graph was calculated for. However, you could forecast the actual cost based on the current run rate and what is still left to spend, and if you do this, the normal protocol is to show that as a dotted line. The continuation of the line represents the Estimate at Completion (EAC).
Earned value: The green line on the example earned value graph above shows the earned value for the project to date.
How to identify variance from an earned value graph
As a project manager, what you really want to use an earned value management graph for is to provide insights into project performance. Here’s what to look for.
Variance at completion: The difference between actual cost and project budget at completion. Look at the difference between the actual cost forecast (the dotted line) and the budget line. The difference is the variance you are expecting in financial terms.
Schedule variance: The difference between the earned value line and the planned value line, at the date you wish to measure. This shows you how far behind (or ahead) of the project schedule you are. Ideally, the earned value of the project should equal the planned value, but often for various reasons it does not. The graph shows you visually how far off the plan the project is tracking so you can investigate and take appropriate management actions.
Cost variance: The difference between earned value and actual cost, at the date you wish to measure. For example, for a given report, a narrow gap between the two lines would show that the project was spending broadly what was expected for this point in the work. You can assess the project’s cost performance from this information.
The earned value graph below shows these variances.
Using the earned value graph
The earned value graph has many uses, including being included in project status updates for sharing with project stakeholders to show actual progress. It’s particularly useful if the graph shows bad news, as we’ve found it is always easier to break that to a project sponsor if you have the data to back it up! You can also use it for project forecasting, as past performance could well be a robust way to generate an accurate forecast of future performance.
Ultimately the graph is only one part of your reporting toolkit. A simple project may not need to use earned value reporting at all, but complex projects definitely benefit from it in many cases. A robust earned value management system will give you other ways of looking at performance data to track project progress, perhaps in data tables or other reporting formats. The project team should be comfortable with looking at and interpreting this data. Earned value management training is available if they want to brush up their skills and get more confident using graphs like this.