 Stacked histograms are great for presenting the cost loadings of multiple resources. Let’s take a look at how you can use them.
Project managers and line managers need to plan each coming week’s work on the project. The more activities occurring in a week, the more mobilization and coordination efforts are required to match the plan.
Stacked histograms in P6 Professional are an effective way project managers can anticipate and plan for busy work weeks. The stacked histogram also reveals lull periods in project activity, which are opportune times to schedule team member meetings.
The color coding and stacking of the histogram columns ensures that no resource loading is hidden. All resources the scheduler elects to display appear in the stacked histogram provided they are active on the schedule. The differing colors, each representing a resource, makes for monitoring the peaks and lows of individual resource loadings in relation to others. In this way the stacked histogram can support manual resource leveling among other resource planning initiatives.
Creating Stacked Histograms In P6
This article demonstrates how to generate and print a stacked histogram to assess resource loading in the schedule.
In Figure 1 we have a screen shot of a portion of the Juniper Nursing Home schedule that comes standard in P6 Professional.
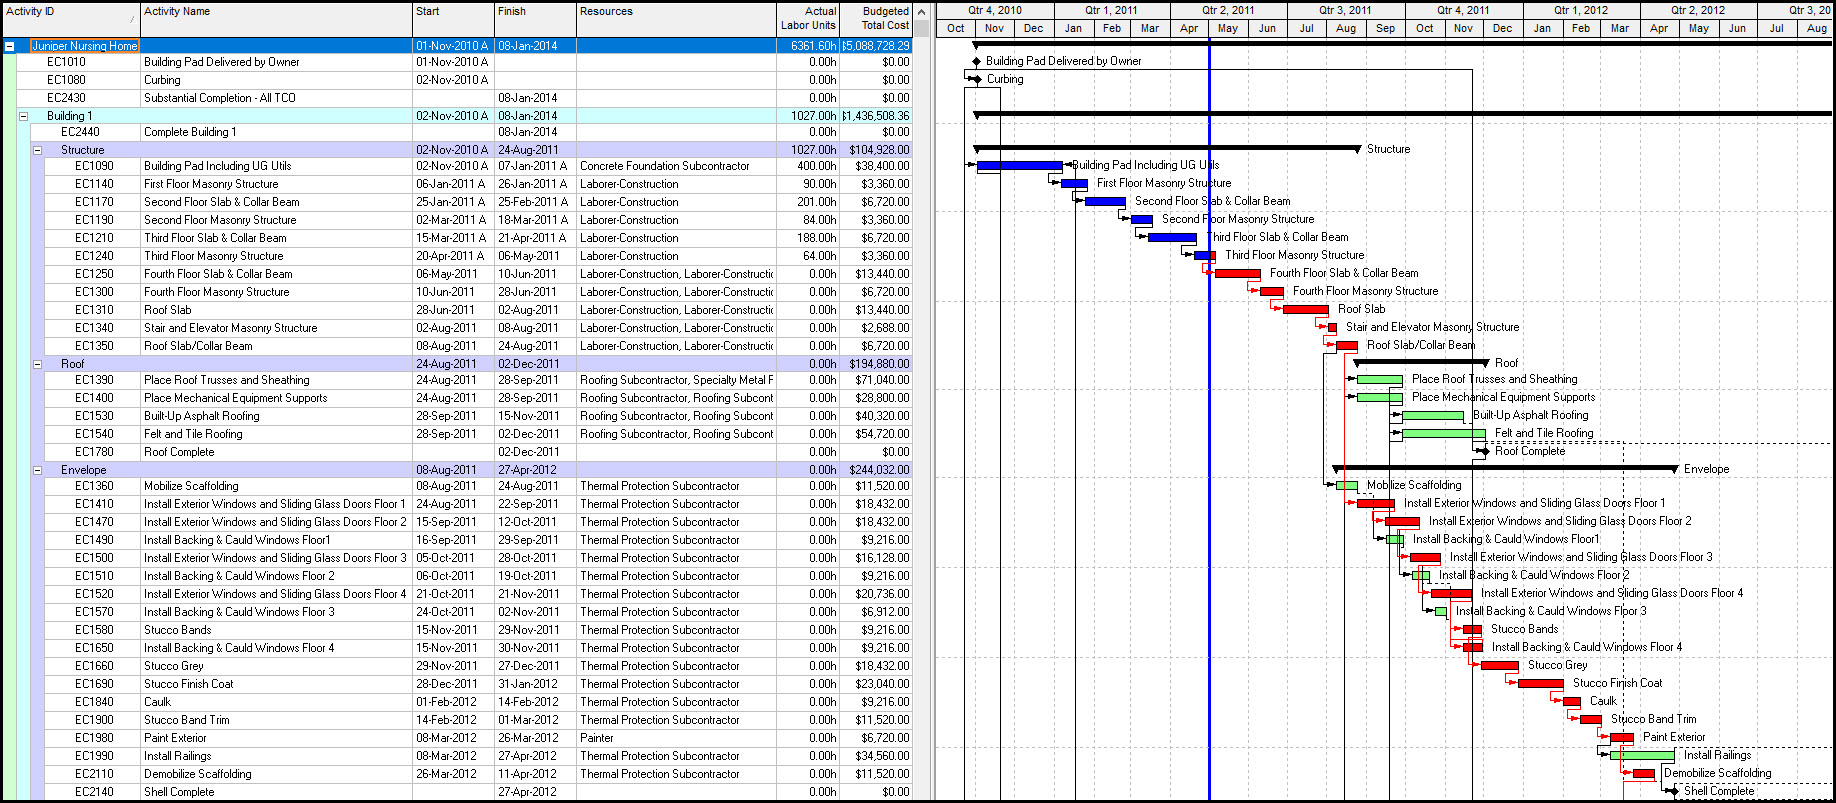 Figure 1
We want to examine the schedule’s resource loading with a stacked histogram. We proceed and click the Resource Usage Profile in the bottom layout tool group, Figure 2.
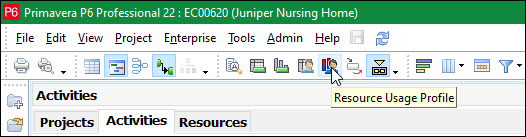 Figure 2
Continuing, in the lower right frame, we click Display and confirm Open Projects Only is chosen and Stacked Histogram, Figure 3, then we click Resource Usage Profile Options.
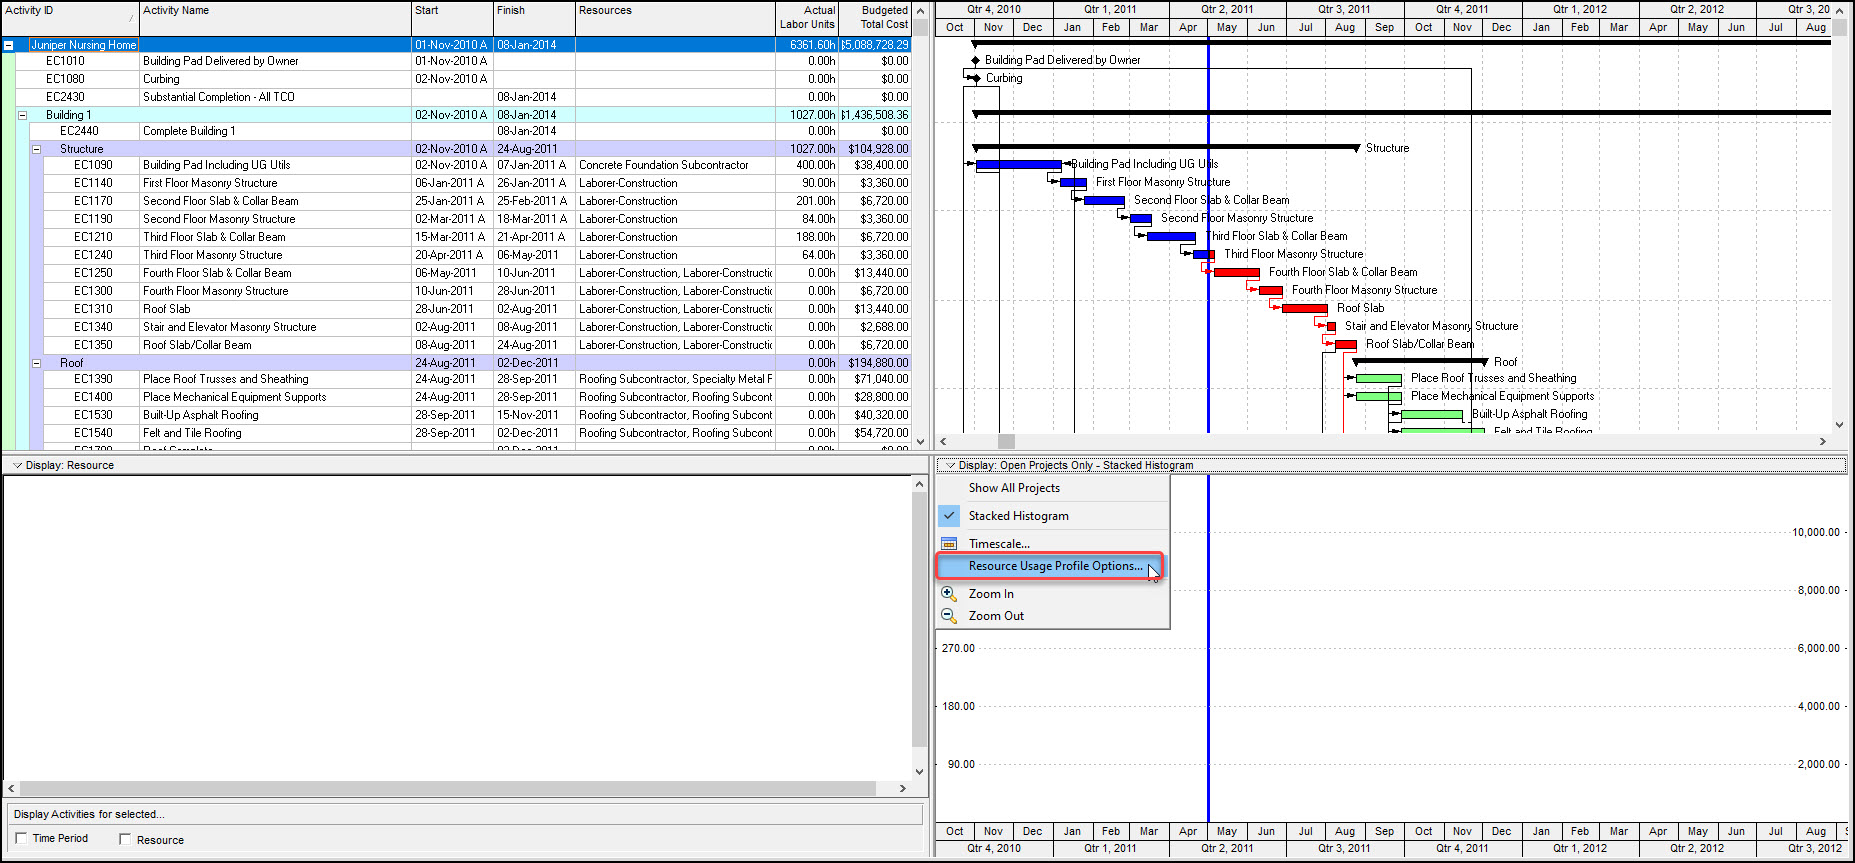 Figure 3
In the Resource Usage Profile Options dialogue, we elect to display At Completion Units and show Individual cumulative curves, then we click Add to include a respective resource on our Stacked Histogram, Figure 4.
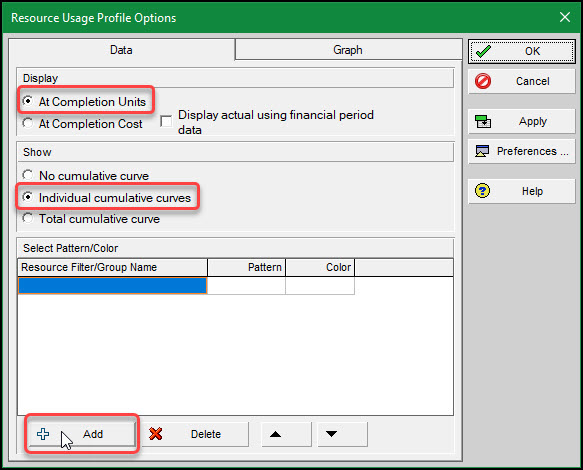 Figure 4
This opens the Filters dialogue, Figure 5, where we create a filter with the following elements: parameter, Resource ID; equivalency, equals; and Value, Concrete-Sub.
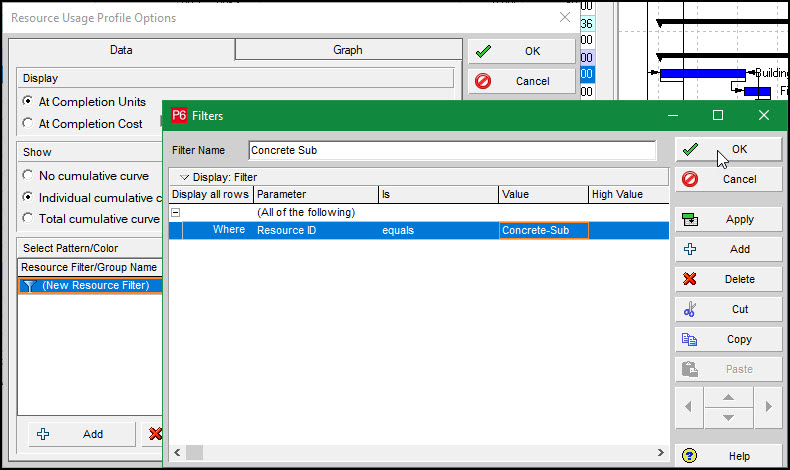 Figure 5
We name the filter Concrete Sub and click OK, Figure 5. Continuing we click apply to plot the Concrete Sub’s resource loading on the Stacked Histogram, Figure 6.
 Figure 6
We carry on and add the Conveying Sub, Drywall (sub), and Electrician, and apply, Figure 7.
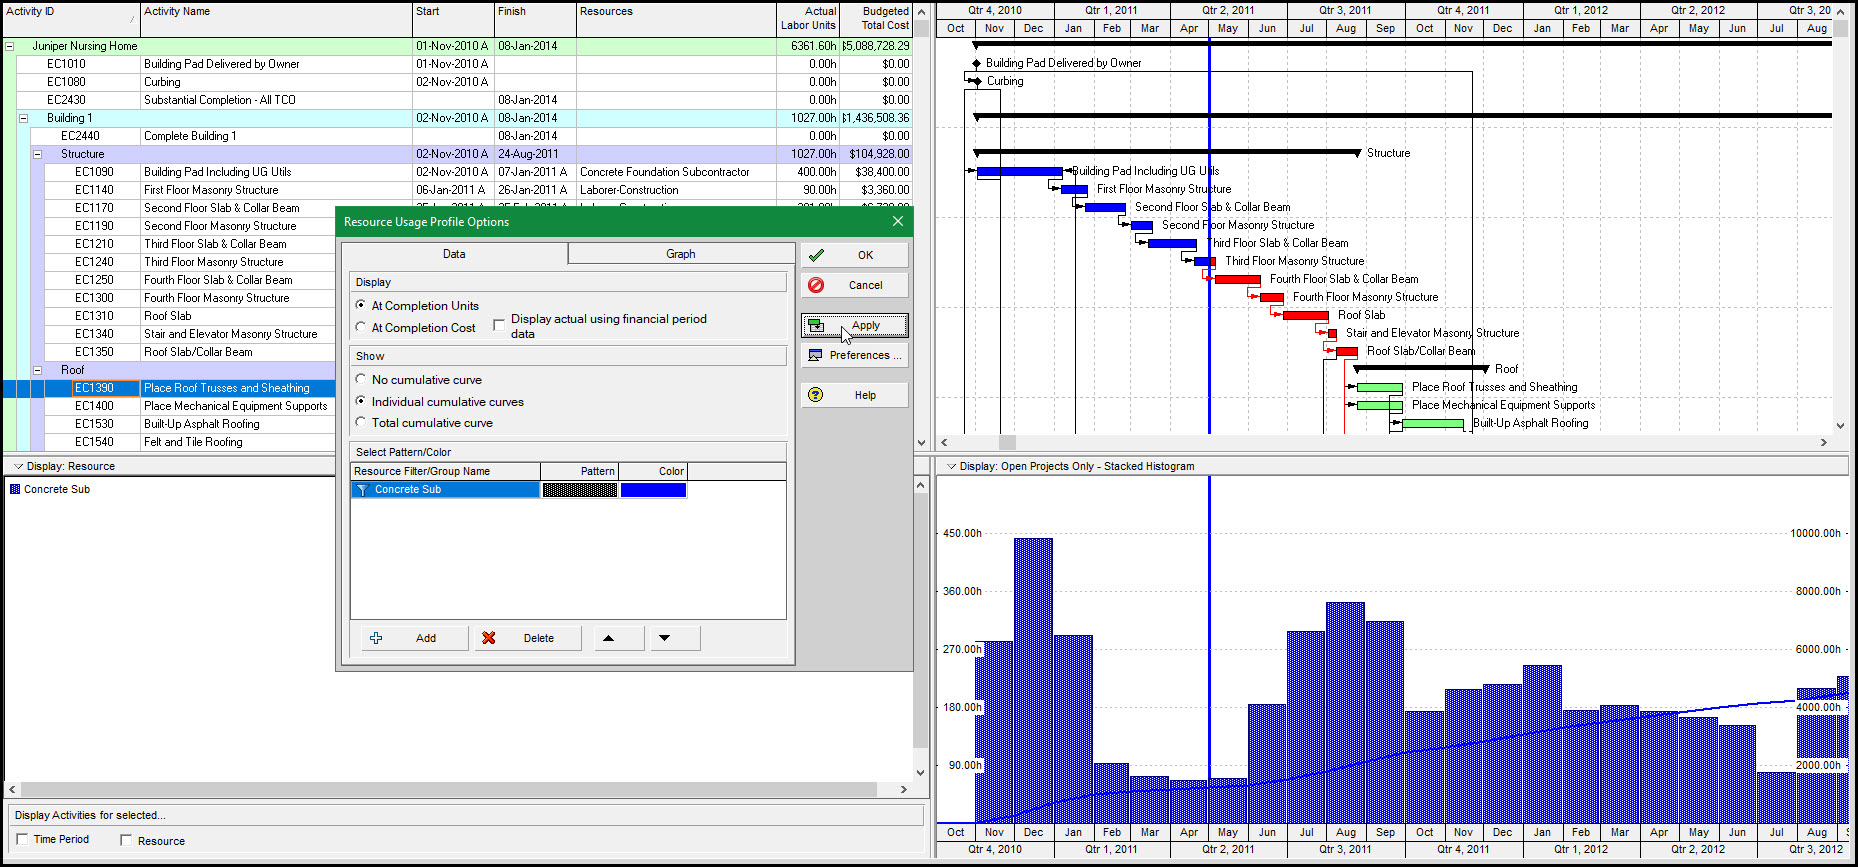 Figure 7
We want the Concrete sub to be at the bottom of the Stacked Histogram, so we use the down arrow in the Resource Usage Profile Options to place it at the bottom, Figure 8.
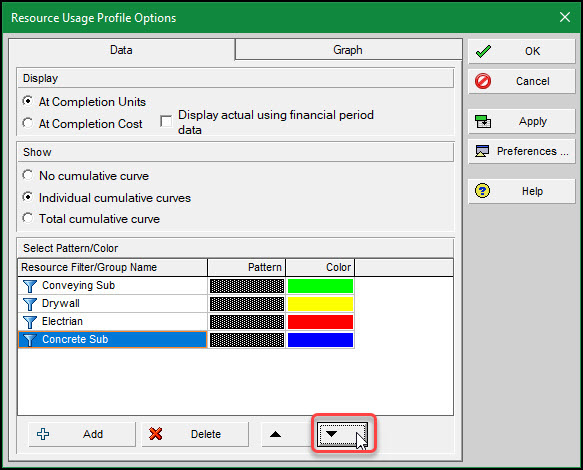 Figure 8
We click apply and our Stacked Histogram appears as in Figure 9.
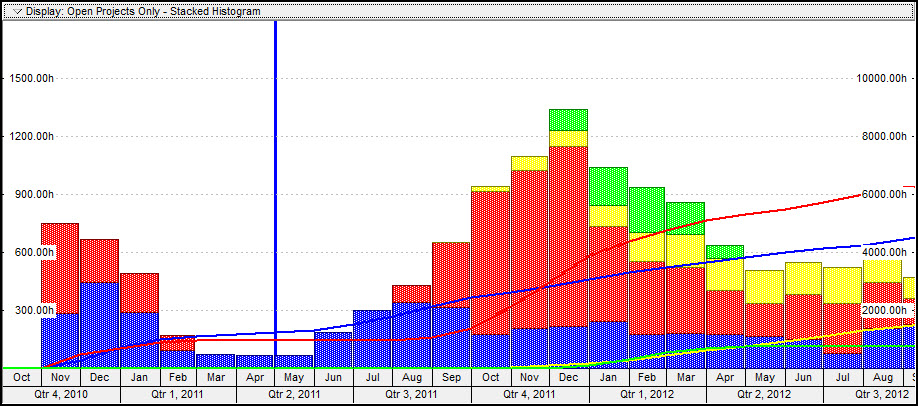 Figure 9
Also note the cumulative curves for each resource by color. Now that we have our Stacked Histogram plotted let us create a print preview. We choose File | Print Setup and from the dropdown menu choose Adobe PDF, paper size 11×17, and Landscape, Figure 10.
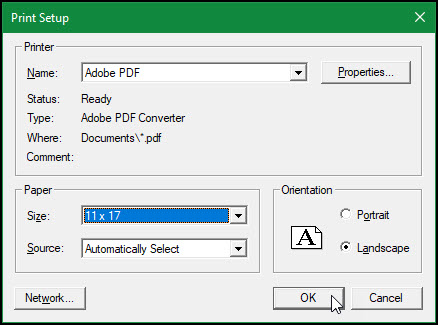 Figure 10
Click OK. We select File | Page Setup and Options, then un-toggle all print options except Profile, Figure 11.
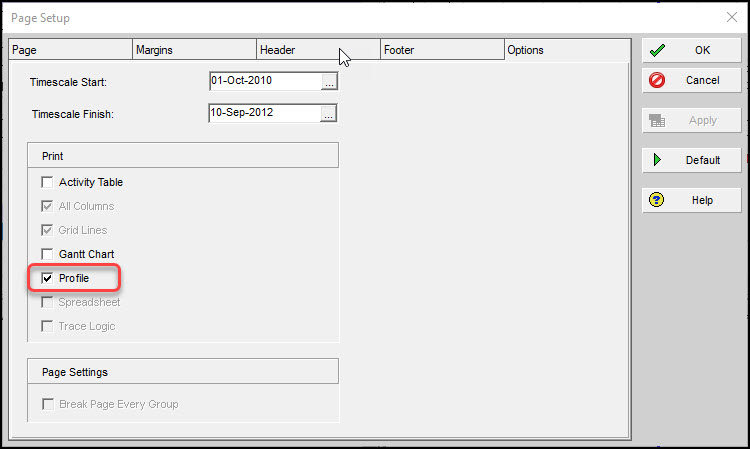 Figure 11
We click on Section 2 and choose to modify and remove the text. We change the Height to 1-inch, then we insert a picture, using the ellipse we locate our Ten Six Consulting company logo on our computer, Figure 12.
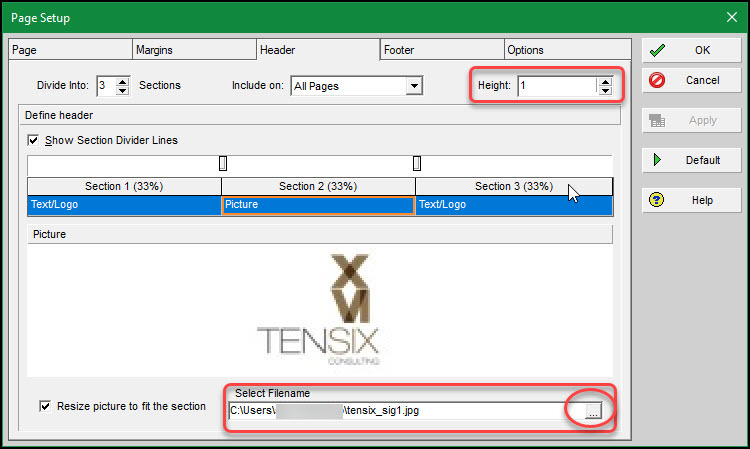 Figure 12
Then we click on section 3, click modify, and highlight the time stamp and remove it, Figure 13.
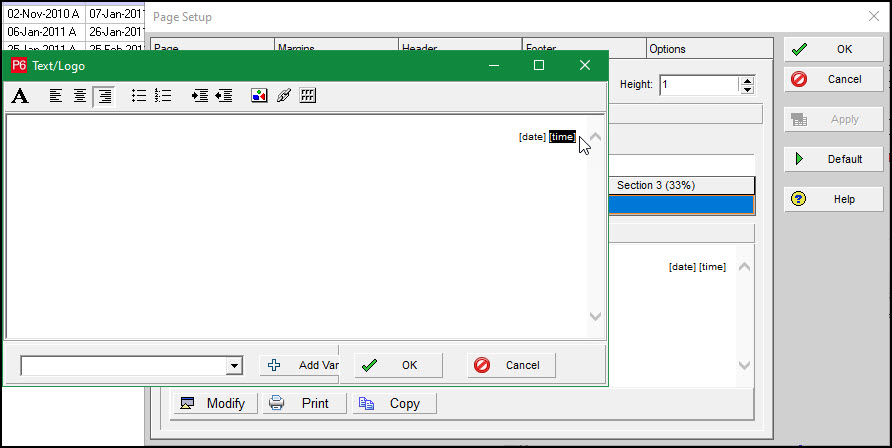 Figure 13
We next choose File | Print Preview and the plot displays in Figure 14.
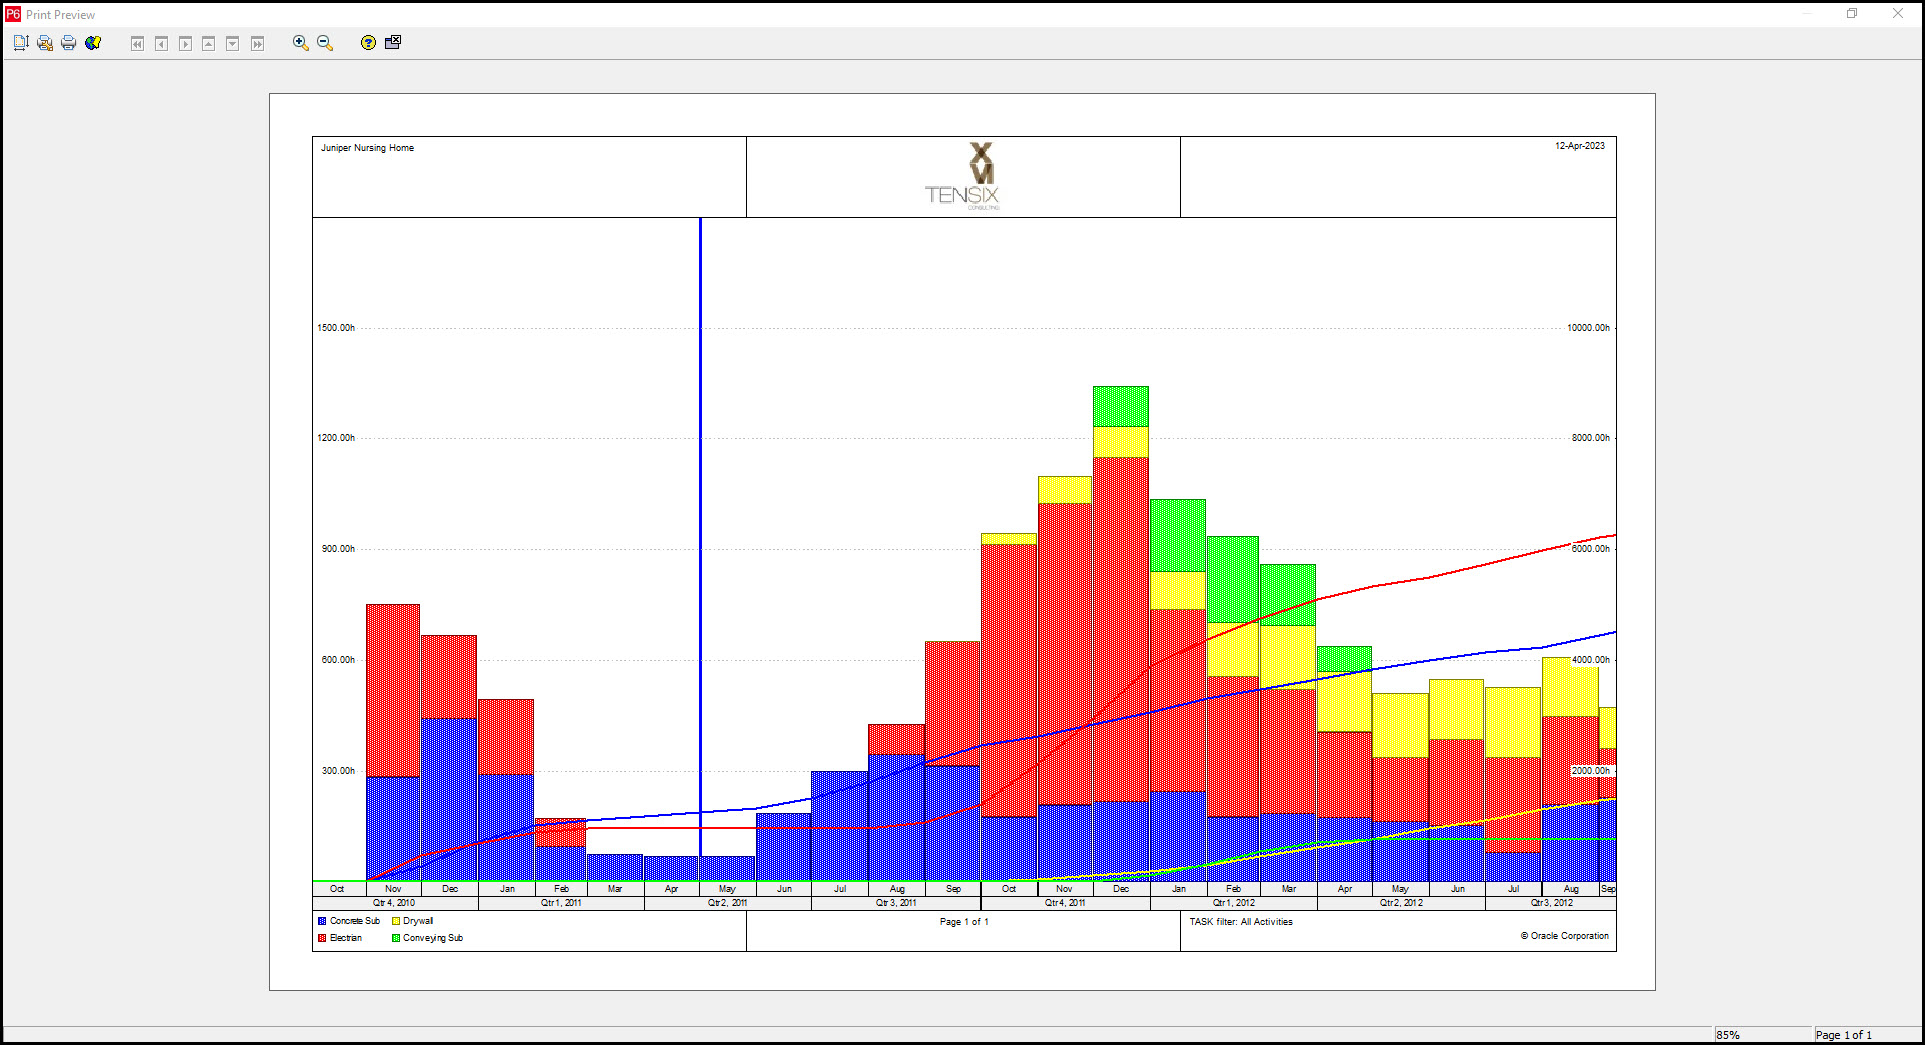 Figure 14
Finally, we print to Adobe PDF. The Juniper Nursing Home Stack Histogram plot displays in Adobe, Figure 15.
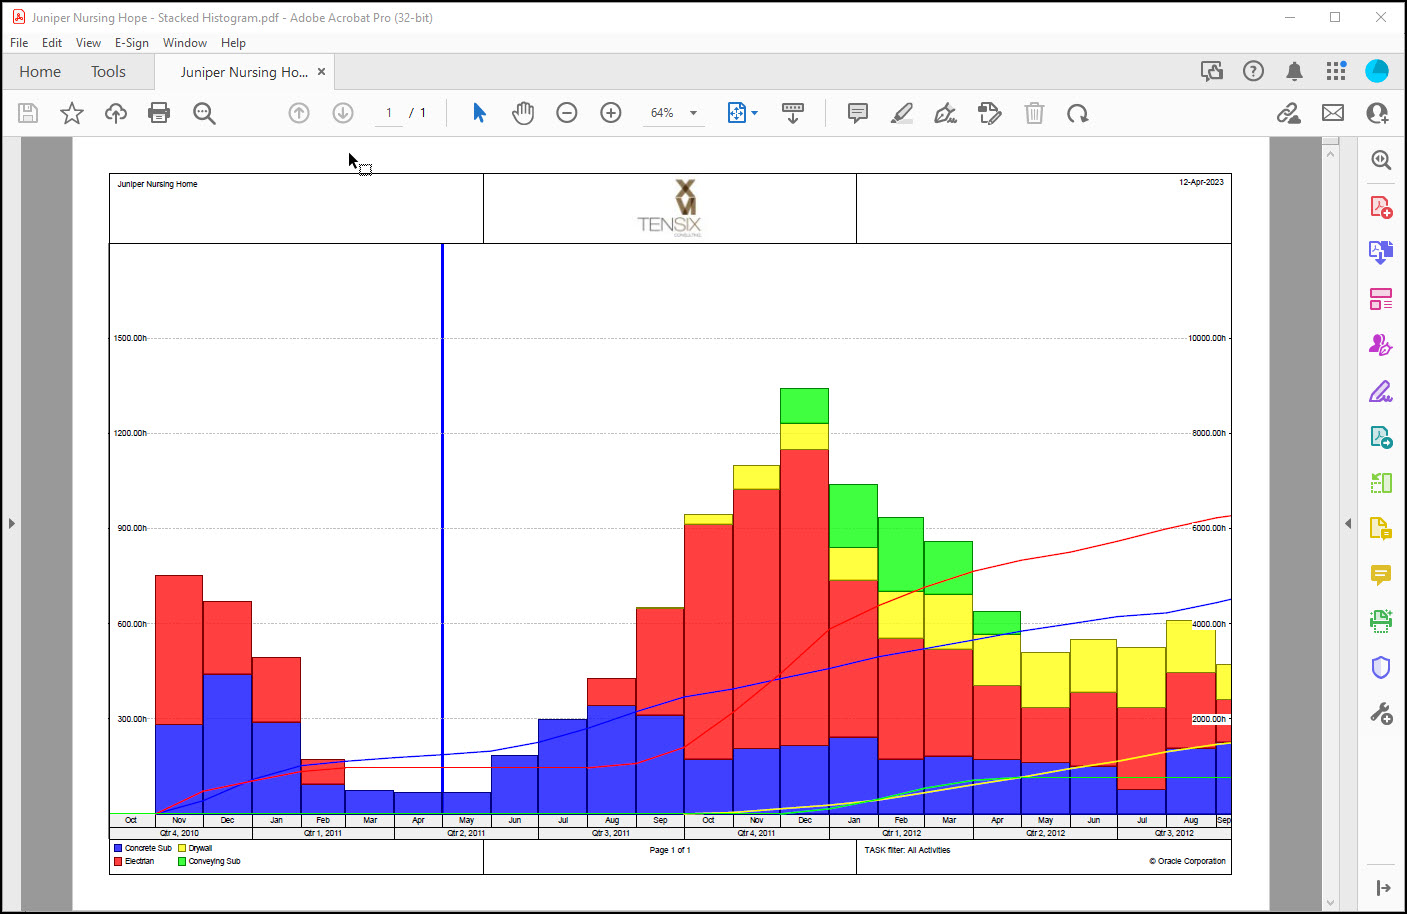 Figure 15
Summary
The Stacked Histogram plot supports project managers and line managers that want a profile of resource loadings for the whole project life. The steps to creating Stacked Histograms are not many, but must be repeated for each resource you want to include.
Click the Resource Usage Profile button and then in the bottom right frame choose Display | Resource Usage Profile Options. Add each resource of interest in the Resource Usage Profile Options dialogue. In the filter choose Resource ID as the parameter and then your preferred Resource as the value.
In this way project managers, schedulers, and line managers alike can produce Stacked Histograms which, is a helpful for investigating and confirming distribution of resources throughout the project life.