 Schedule Risk Analysis in Deltek Acumen Risk is all about creating confidence levels and ranges into which the schedule is most likely to fall. But stakeholder’s must first trust the validity of the Schedule Risk Analysis (SRA) before accepting these confidence levels.
Trust comes from a tenable SRA, and SRA integrity is founded on three elements:
- a quality schedule
- well-defined duration/cost uncertainty
- and discrete risk events
A quality schedule is most important; schedulers should not proceed until confirmation of an acceptable schedule. But schedulers need all three of these components for an SRA that instills confidence that the risk adjusted schedule/cost probability values (P-value) are realistic. The risk analysis in Deltek Acumen supports all three of these elements that make for a justifiable SRA.
Schedule Risk Analysis in Deltek Acumen
This article discusses Schedule Risk Analysis in Deltek Acumen and the elements or pillars of a defensible SRA.
1. Quality Schedule
The first risk analysis component is a sound schedule. Before performing schedule risk analysis in Deltek Acumen on a schedule, we must first measure its quality. If the schedule quality is deficient then the risk analysis results will be suspect. It is, therefore, imperative to have a quality schedule. If not, the risk analysis should be halted until further review of the schedule. Yes, it is that important to have a good quality schedule before proceeding with the risk analysis.
Acumen has a diagnostic analysis feature in S2 // Diagnostics that has a plethora of metrics (over 300+ metrics) to measure schedule quality. The default metric group in Acumen is the Schedule Quality Analysis (SQA) group. This group consists of nine metrics: missing logic, logic density, critical, hard constraints, negative float, insufficient detail, number of lags, number of leads, and merge hotspots.
These metrics Acumen developers have determined in their judgement or wisdom are the most important metrics to consider for a good SRA. Note that this SQA metric group also has seven metrics that include completed activities in the analysis. It is best for the metric to consider only task remaining duration, as completed activities make no further contribution to schedule outcome.
Another metric group to consider when inspecting the quality of a schedule is the Defense Contract Management Agency’s (DCMA) 14-Point Assessment, which mostly does not include completed activities. Its fourteen metrics are as follows: logic, leads, lags, Start-to-Start (SS) & Finish-to-Finish (FF) relationships, Start-to-Finish (SF) relationships, hard constraints, high float, negative float, high duration, invalid forecast, invalid actuals, resources, missed activities, critical path test, calculation of the critical path length index (CPLI), and calculation of the baseline execution index (BEI). The Invalid Actual Dates, Missed Activities, CPLI, and BEI metric analyses include completed activities. Be aware that some of the DCMA 14-Assessments do not relate directly to SRA.
Now, if you are only interested in considering metrics that directly affect SRA then you want a metric group that includes only the following five metrics:
- Constraints
- Missing Logic
- Leads
- Lags
- Redundant Logic
1. Constraints
Risk analysts recommend removing all constraints from the schedule. Constraints indicate an event on a particular date, e.g. contractual commitments. These contractual dates are more like wish list items because the probability of meeting a contractual date is extremely low. If you must use constraints it is best to use soft constraints, such as a Start On or After (SOOA) or a Finish On or Before (FOOB). But even soft constraints can be too restrictive. For example, in the SOOA constraint, Figure 1, you have variability in the random number generation on or after the SOOA specified date, but the risk analysis tool will not generate random numbers that are earlier than the SOOA constraint date.
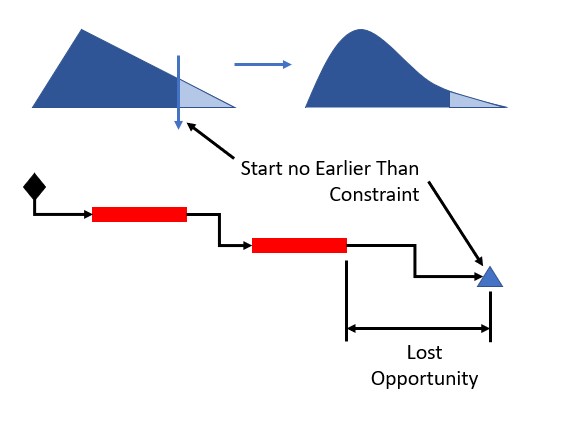 Figure 1
You essentially lose the opportunity for this respective activity to start earlier than the SOOA constraint date, which may not reflect reality. Instead of saying an activity takes place on a specific date, it is better to confirm when it can be done and at what confidence level.
2. Missing Logic
The missing logic metric shows how well (or poorly) schedule tasks are logically linked together. In a well linked schedule, every activity will have at least one predecessor and one successor. The exceptions are program start has no predecessor and program finish has no successor. All other activities missing either a predecessor or successor indicates a break in the respective network logic path, Figure 2.
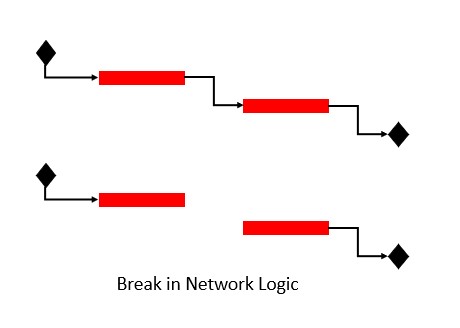 Figure 2
This creates a dangling activity. It also threatens and/or corrupts the risk analysis, as (1) when things happen and (2) the driving activity will both be unreliable.
3. Leads
Leads (or Negative Lags) do not always make sense. Leads commence a successor based on the predicted completion of a predecessor task. In certain situations, as in Figure 3, below, the successor activity is complete while the predecessor activity is still in the future.
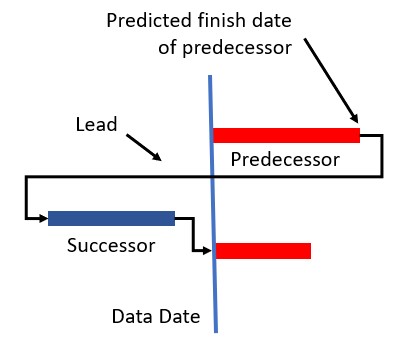 Figure 3
In this situation the logic is not describing a real predecessor; the predecessor, again, is in the future after the successor, which does not make sense.
4. Lags
Lags, Figure 4, represent waiting time between the completion of a predecessor and commencement of a successor.
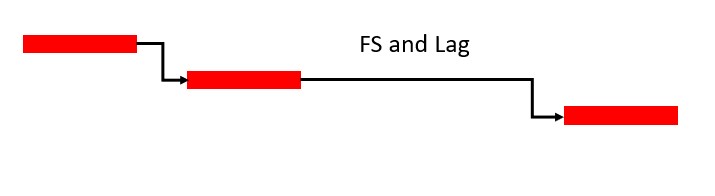 Figure 4
Lags may describe processes, such as the drying of paint or curing of concrete. In the past the drying/curing of paint and curing of concrete were considered fixed durations. But research that considers temperature and/or humidity inserts some variability into the curing process. This means concrete cure lag is better modeled as a task that has a triangular probability distribution based on the minimum, most likely, and maximum durations of the curing process. The risk analysis tool also does not model lag; it models activities.
5. Redundant Logic
Redundant logic may have a negative effect on the final probability of the project. In risk analysis the probabilities of parallel paths are multiplied together to arrive at the probability of the successor/project. In the example below, Figure 5, we have redundant logic and two parallel paths, and each have 80% probability, which is acceptable.
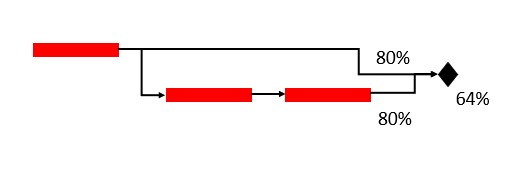 Figure 5
When we multiply these 80% probabilities together, we get a completion date probability of only 64%, a failing schedule quality score. Without the redundant logic the project end date would have an 80% probability, a passing score. So, the redundant logic artificially lowered the output probability. For this reason, it is important to remove all redundant logic from the schedule. The exception is when you have cost loaded redundant logic. In this situation it is best to include the redundancy. Note that Acumen does not have a ‘redundant logic’ metric group, but it does have a ‘redundancy index’ in S2 // Logic. So, it is possible in Acumen to inspect a schedule for redundancy.
It is feasible to create a metric group in Acumen that considers constraints, missing logic, leads, and lags. These metrics are core to an SRA appropriate quality schedule. Again, there is no redundant logic metric, but S2 // Logic has a redundancy index.
2. Duration/Cost Uncertainty
Duration/Cost uncertainty is most likely from estimating errors. These estimating errors could be due to work related knowledge gaps, differing resources, unstable resource productivity, and too much reliance on others to perform the work. The good news is that estimation accuracy increases as planning and engineering proceed.
Duration and cost uncertainty are also attributed to project risks. These include insertion of new technology, resource availability, mismatch between historical and actual production rates, late delivery of materials, delivery of materials in unacceptable condition, permitting issues, and pressure to adopt unrealistic short durations or too much cost cutting. Neglecting duration and/or cost uncertainty associated with a single point estimate inevitably leads to schedule problems when reality strikes.
So, estimating errors and project risk both contribute to duration/cost uncertainty. The best representation of this uncertainty is a probability distribution, which represents the likelihood of a duration/cost happening. And a simple three-point estimate makes a significant step forward compared to the single point deterministic estimate. This three-point estimate becomes a triangular probability distribution, as displayed in Figure 6.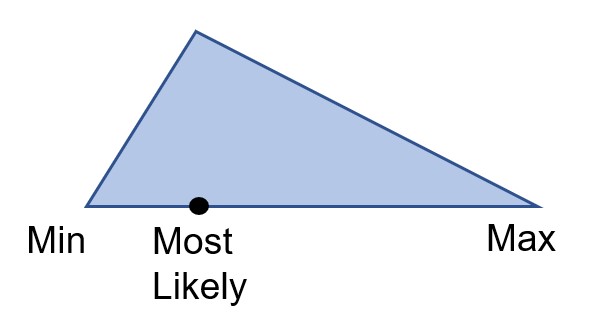 Figure 6
In the three-point estimate for duration the estimator provides the longest possible or pessimistic duration, the most likely duration, and the shortest or optimistic duration. Likewise, for cost models, the scheduler provides the highest probable cost, most realistic cost, and lowest possible cost. So, every activity in the schedule is assigned a max, most likely, and min duration/cost.
In Figure 7 we have a schedule that has duration probability distribution triangles defined for each activity.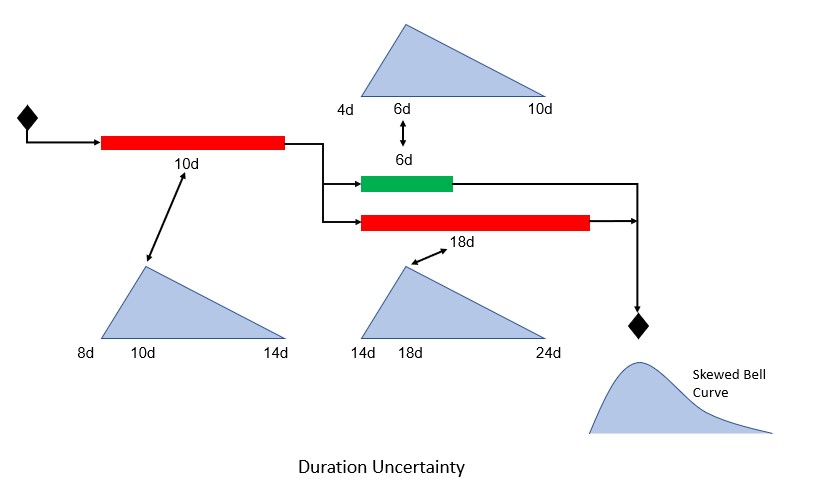 Figure 7
As mentioned, probability distribution triangles consist of a Min, Most Likely, and Max duration and/or cost. The triangular probability distribution is an efficient and accurate representation of durations and/or costs. The resulting probability distribution at project completion is a skewed bell curve, again, Figure 7. Acumen has triangular, normal, and uniform probability distributions that can be assigned to duration and/or cost. Again, the triangular probability distribution is preferred for combined efficiency and accuracy.
3. Discrete Risk Events
Projects come with risk. That is part and parcel of the unique nature of a project. In addition to duration and cost uncertainty projects also have events that contribute to risk. The Acumen risk register allows you to enter specific risk events and then weight their probability and impact. Risk events are mapped to respective activities. In this way the scheduler considers the risk event and its probable schedule and cost effect on corresponding schedule activities.
In Figure 8 we have our probability distribution triangle.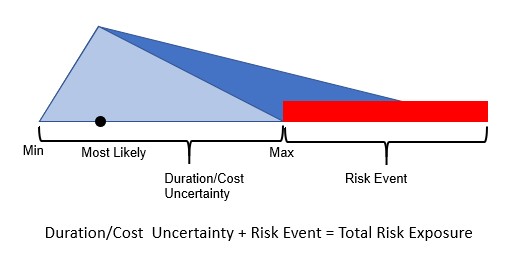 Figure 8
The comprehensive probability distribution triangle consists of two risk exposures: duration/cost uncertainty and a risk event. As displayed in Figure 8, the risk event may have a significant impact on extending duration and/or increasing the cost of an activity/effort.
Let us now discuss: ‘known–known’, ‘known–unknown’, and ‘unknown–unknown’ events. These risk classifications are based on our knowledge about an events identification (known or unknown) and knowledge about its probability and impact (known or unknown). Known-knowns are part of our general knowledge and are definitely included in the schedule. Known-unknowns are events that we know we do not know about.
Consider a hurricane. A hurricane may be a known event but with an unknown probability and impact. A hurricane may have an uncertain track and intensity. These known-unknown events are defined in the risk register. Finally, we have unknown-unknowns, which are the worst kind of risk. We do not even know they exist. They are sudden high impact events often referred to as black swans. One cannot anticipate these events. Black swans are low probability and high impact.
Consider risks early in the project life cycle; mitigation costs increase exponentially as the project proceeds. So, it is best to front load opportunity and risk management efforts. The first major step in risk management is identification of both opportunities and threats. And the goal is a comprehensive risk register. You want confidence that your risk identification research is complete, and your risk register is comprehensive; it should consider all project related known-unknowns.
You, however, do not want to overdo your risk register. When considering risk events to include in the risk register, exclude those risk events that are possible but not very probable and where there is nothing you can do about it. The classic example is an airplane crashing into your corporate headquarters or manufacturing facility.
Yes, it is possible that a plane could crash into your building and have an extremely high impact. But it is not very probable and there is nothing you can do to prevent this from happening. So do not include this airplane event in your project’s risk register.
You also want to consider the tasks the risk event is linked to. A risk event with high probability and high impact but mapped to a 2-day activity is not a primary schedule risk event despite its high overall probability and impact score. The same goes for schedule risk events mapped to activities with significant free float and/or total float.
A medium probability and/or impact schedule risk event that affects driving logic would be of more concern. And most definitely should be included in the risk register. Acumen’s risk register includes mapping features to link risk events to individual or multiple activities.
Historical risk registers should be leveraged in brainstorming sessions to generate opportunity and threat events for your new project. Most companies also keep libraries of common risks by project type. Many of these risks come from project lessons learned notes. So, lessons learned are a good source of knowledge for opportunities and threats. But hold off reviewing lessons learned check lists until late in the brainstorming workshop. This avoids fixating or “anchoring” on lessons learned and not considering all other potential risks.
It is further good to first consider opportunities to have a more thorough and balanced risk analysis; our minds are more apt to revert to the negative. Acumen’s risk register may include both opportunities and threats to a schedule. Also, individual research is good, but team oriented brainstorming workshops are paramount. Team workshops generate more robust ideas, and more comprehensive risk registers, which is the target. And, again, Acumen’s risk register considers both opportunities and threats.
Summary
A well-built schedule is of upmost importance for a quality Schedule Risk Analysis in Deltek Acumen. Schedulers should inspect their schedules using Deltek Acumen’s schedule quality metric group and the DCMA 14-Point Assessment metric group. The DCMA 14-Point Assessment is good, as most its assessments do not include completed activities. But the metrics that correlate most directly to a quality schedule are constraints, missing logic, leads, lags, and redundant logic.
In Deltek Acumen you can create a unique metric group including four of these metrics. Deltek Acumen has a triangular probability distribution type that provides an efficient and accurate duration/cost uncertainty. Discrete risk events can add significantly to time and money estimates. A triangular probability distribution representing a total risk exposure consists of duration/cost uncertainty and risk events.
Risk events or known-unknowns should be included in a risk register. Deltek Acumen’s risk register includes both opportunities and threats for a more well-rounded risk register. Leveraging risk events from similar historical projects and team oriented brainstorming workshops also help ensure a comprehensive risk register.