


Here we take a look at sizing the Gantt chart for printout on to a 11×17 sheet of paper to fit alongside your activity table.
You will most likely want your schedule printed to 11×17, the largest size a standard printer can accommodate. However, even though it is larger than 8.5×11, you still have limited paper room for your schedule. Hence, the Gantt chart needs to be as narrow as possible. It is a little bit of an art to have your Gantt chart shrink to a size suitable for fitting on your printout.
Here we demonstrate some tips and techniques sizing the Gantt chart for printout.
Our demonstration schedule is in Figure 1; we want to print the Gantt chart and activity table on an 11×17 sheet of paper.

Figure 1
We choose File | Print Preview, Figure 2, to view a print preview.

Figure 2
The print preview is displayed in Figure 3.

Figure 3
Observe the narrow Activity ID column: The shrink vertical grouping bands are on. This Group and Sort setting was written about in the blog Sizing the Activity Table for Printout in P6 Professional.
The activity table looks good.
A closer look at the Gantt chart reveals start milestones that look chopped off at the beginning of the project and hidden task labels near completion, Figure 3. To correct this, we click the Page Setup icon in Figure 4.

Figure 4
Our Timescale Start, Project Start (PS) and Timescale Finish, Project Finish (PF) were chosen from the ellipse (three periods square icon) dropdown menus, Figure 5.

Figure 5
We want to modify these by making Timescale Start earlier than the PS (to fit in the milestone relationship lines) and Timescale Finish later than the PF (to fit in the task labeling on the right side of the Gantt chart). Figure 6 shows how we modify the Timescale Start PS by subtracting one day (1D) and Timescale Finish PF by adding one week (1W).

Figure 6
The print preview appears in Figure 7 and looks good.

Figure 7
You usually want to add as many activity table columns as possible. Figure 8 demonstrates what happens to the Gantt chart when adding a Total Float, Activity % Complete, and Cost columns.

Figure 8
Our Gantt chart does not fit on the screen output. When we click File | Print Preview, less than half the schedule fits on the Gantt chart area, Figure 9.

Figure 9
To fit the schedule, we hover the mouse over the lower Timescale increment row, which is the day of the week for our “Week/Day 1” Timescale. So, we hover the mouse (highlighted by a blue circle) over the Timescale day of the week until the (Sherlock Holmes) magnifying glass appears. See Figure 10; the mouse now appears as a magnifying glass in this figure.

Figure 10
Then we left-click (a mouse left-click is represented by the smaller green circle highlighter) and drag the magnifying glass mouse to the left, Figure 11, which compresses the Timescale and, therefore, the Gantt chart.

Figure 11
Figure 12 displays the Gantt chart after compressing the Timescale.

Figure 12
Now we choose File | Print Preview, Figure 13.

Figure 13
Now, the Gantt chart print preview looks better, Figure 14.

Figure 14
Figure 15 shows a close-up of the Gantt chart in the Print Preview with no label adjustments.

Figure 15
If you want to tweak the task labels displayed in Figure 15 further, you could modify the Timescale Finish PF and add two weeks (2W) to view the entire task labeling. We do not demonstrate tweaking the task label view. Again, refer to the article above for a primer on tweaking the PS and PF dates to fit relationship lines and task labeling on the Print Preview.
Another way to sizing the Gantt chart for printout, is to adjust the Timescale. In Figure 16, we right-click on the Gantt chart and choose Timescale from the popup menu.

Figure 16
We then change the Date Interval from Week/Day 1 to Month/Week, Figure 17.

Figure 17
Great! But now we have too many vertical sight lines. To continue, we right-click the Gantt chart and choose Bar Chart Options from the popup menu, Figure 18.

Figure 18
We change the Vertical Lines – Minor from Day to Week, Figure 19.
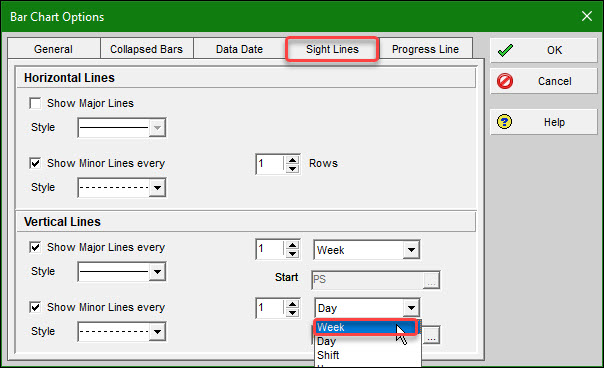
Figure 19
We change the Vertical Lines – Major from Week to Month, Figure 20.

Figure 20
The print preview of the resulting schedule is in Figure 21.
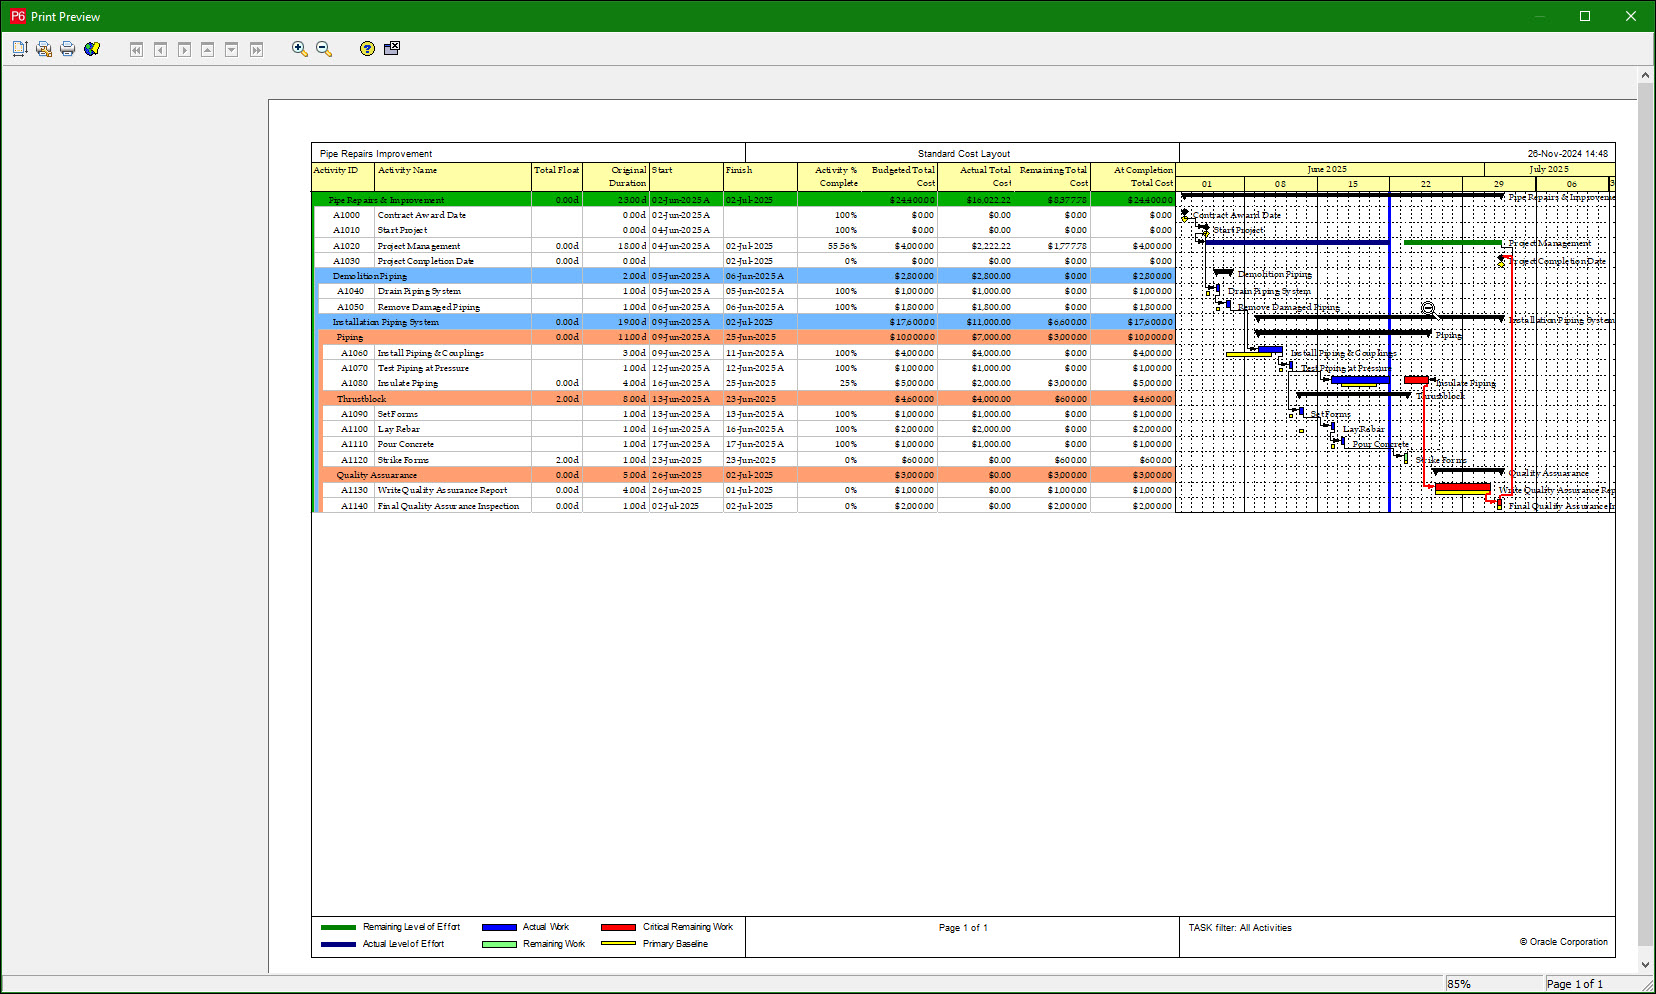
Figure 21
We need to adjust it to fit the labeling at the end of the project tasks. To do this, we click page setup, Figure 22.

Figure 22
We add two weeks (2W) to the Timescale Finish PF, Figure 23.

Figure 23
The resulting schedule print preview is in Figure 24.

Figure 24
A closeup of the scheduled Gantt chart print preview is in Figure 25, which looks good.
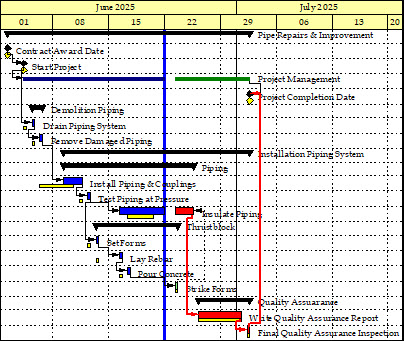
Figure 25
Summary
Sizing the Gantt chart for printout in P6 needs a few adjustments to fit it and the activity table on one 11×17 sheet of paper.
- To better display relationship lines and labeling, subtract days from the project start PS and add weeks to the project finish PF. (You can also add months (M) or quarters (Q).
- To expand the activity table with additional data columns, we will likely need to compress the Gantt chart using the mouse magnifying glass, left-clicking, and dragging left.
- An alternative is to change the Timescale of the Gantt chart from Week/Day 1 to Month/Week to provide a higher-level view of the Gantt chart.
- Again, modify the Timescale start PS and Timescale finish PF accordingly to fit relationship lines and labeling on the Gantt chart.
You may also need to adjust the sight lines. For an additional demonstration of Gantt chart sight line adjustment, refer to the following:
Thus, we can manually adjust the Gantt chart timescale with the Sherlock Holmes mouse left-click and drag or automatically choose a different Date Interval for the Timescale and adjust the sight lines to match accordingly.