 How to create an Acumen Risk Analysis Schedule
A reliable Deltek Acumen Schedule Risk Analysis (SRA) has three pillars, and the first and most important one is a well-built schedule.
An accurate SRA has three components: a quality schedule, well-defined duration/cost uncertainty, and discrete risk events. Again, the most crucial element is a quality schedule. It is not worth proceeding with the SRA if the schedule is lacking.
Fortunately, Acumen is a robust scheduling tool, and has features for measuring the quality of a schedule. In fact, Acumen is considered a one stop shop for confirming the soundness of a schedule and actually performing the SRA.
Acumen works along a five-stage maturity model that begins with a non-validated schedule, performs schedule diagnostics, continues with risk adjustments, looks for optimization opportunities, and concludes with a team-aligned schedule that has realistic targets at desired confidence levels.
This article demonstrates schedule quality inspection using various standard and personalized metric groups in Deltek’s Acumen software. This will help prepare an Acumen Risk Analysis Schedule.
How to Create an Acumen Risk Analysis Schedule
We have in Figure 1, our demonstration Primavera P6 cost loaded schedule.
 Figure 1
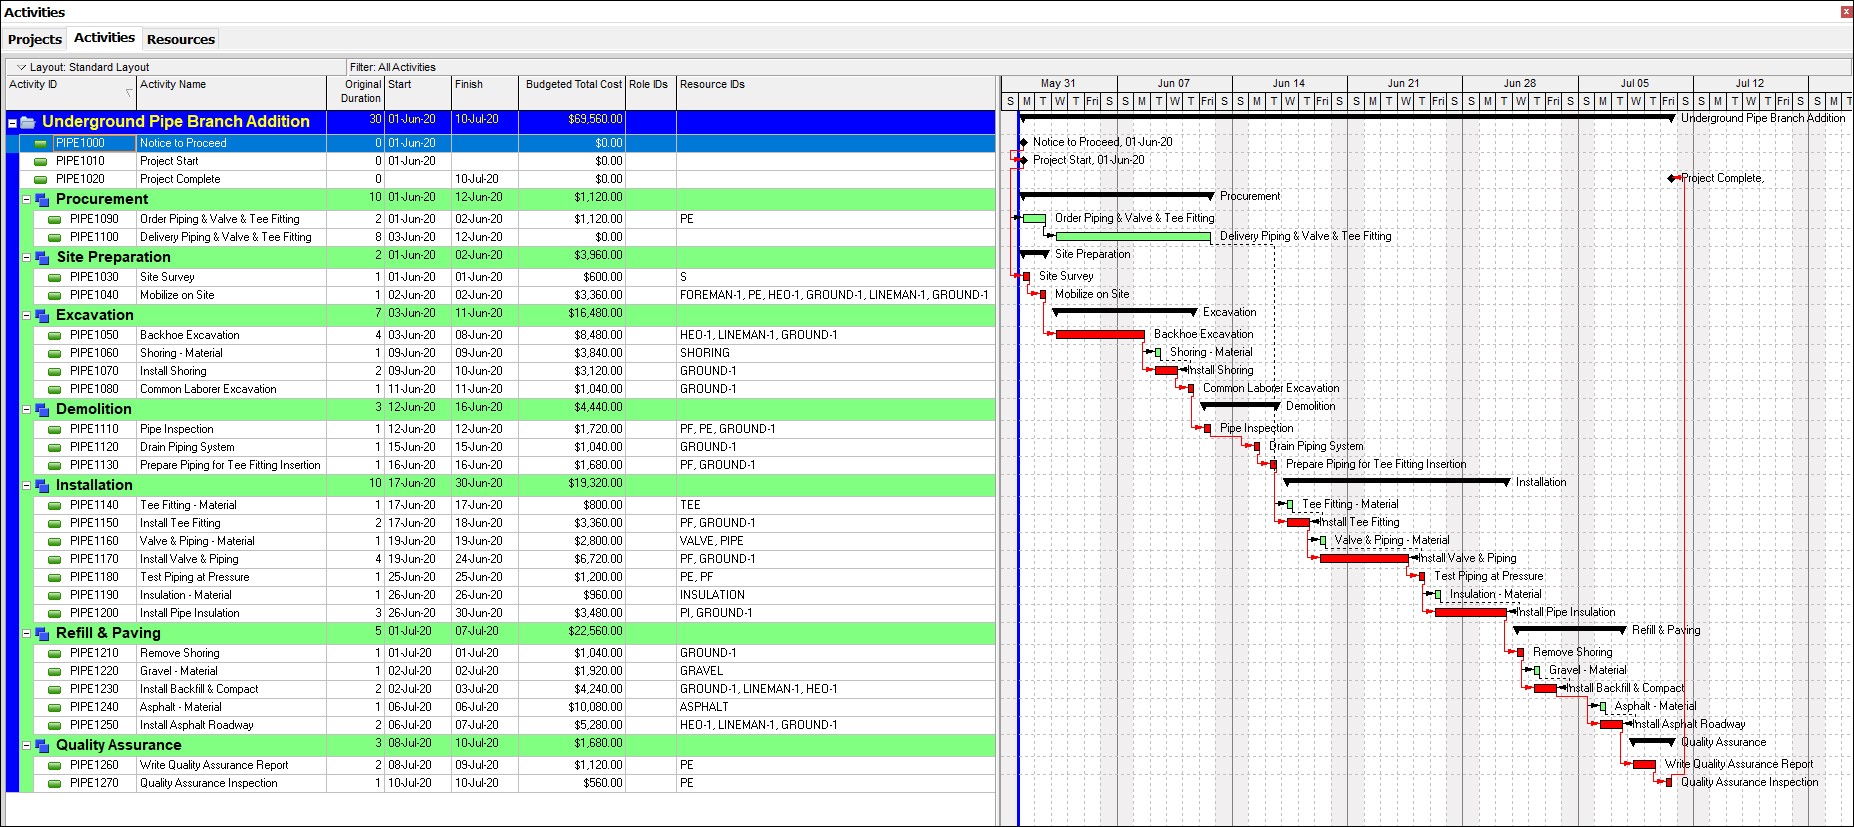
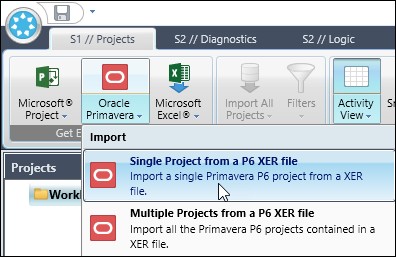
This is an underground pipe addition project. We begin by importing our P6 XER file into Acumen. We choose Oracle Primavera | Single Project from a P6 XER file, Figure 2.
Figure 2
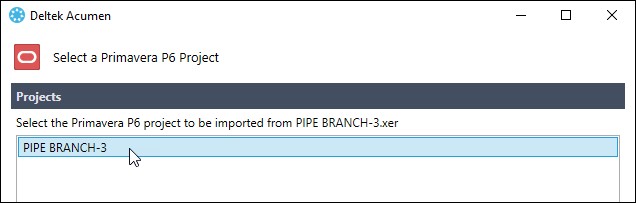
We find our file in the Windows Operating System file structure and choose to open it. We then select our project in the Select a Primavera P6 Project dialog.
Figure 3
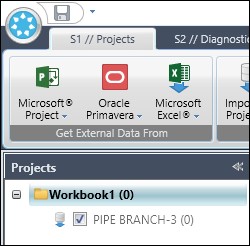
At this stage it does not import the file; it links it to Workbook1, Figure 4.
Figure 4
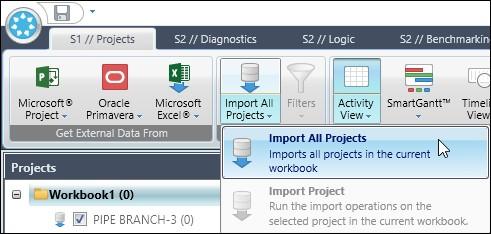
But now we are ready to import our project into Acumen. We choose Import All Projects, Figure 5.
Figure 5
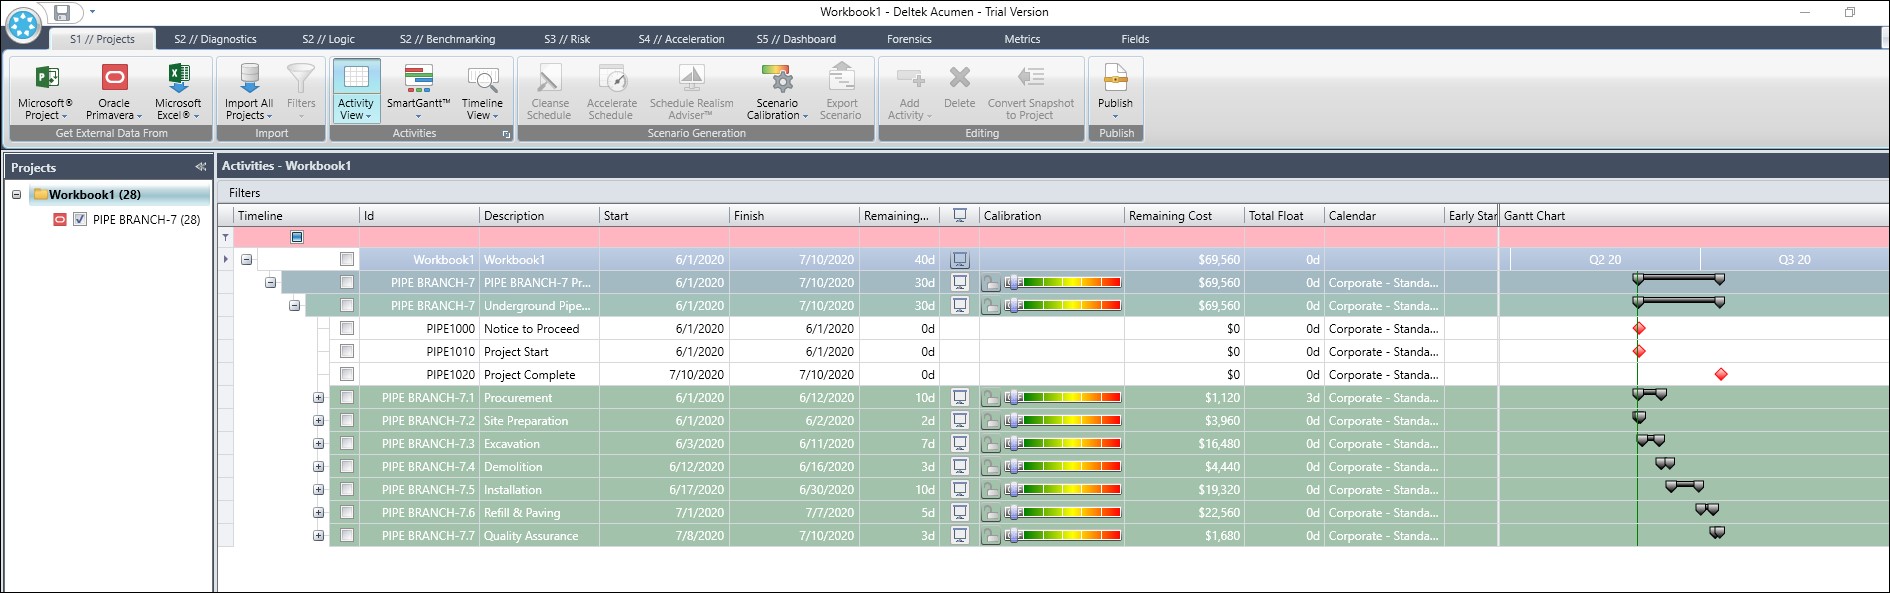
Our imported schedule appears in Acumen S1 // Projects, Figure 6.
Figure 6
We are now ready to perform schedule diagnostics on our schedule to see if it is prepared for SRA. This is an important step if we want to perform SRA on our Acumen Risk Analysis Schedule.
Schedule Quality Analysis Metric Group
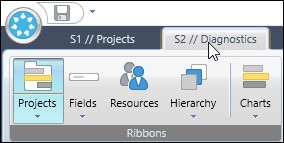
We proceed and select S2 // Diagnostics, Figure 7.
Figure 7

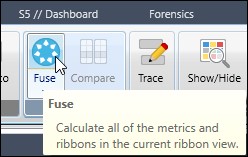
In Diagnostics we click Fuse to perform a Schedule Quality diagnostic analysis, which is the default, Figure 8.
Figure 8

Results of the Schedule Quality diagnostic analysis are displayed in Figure 9.
Figure 9
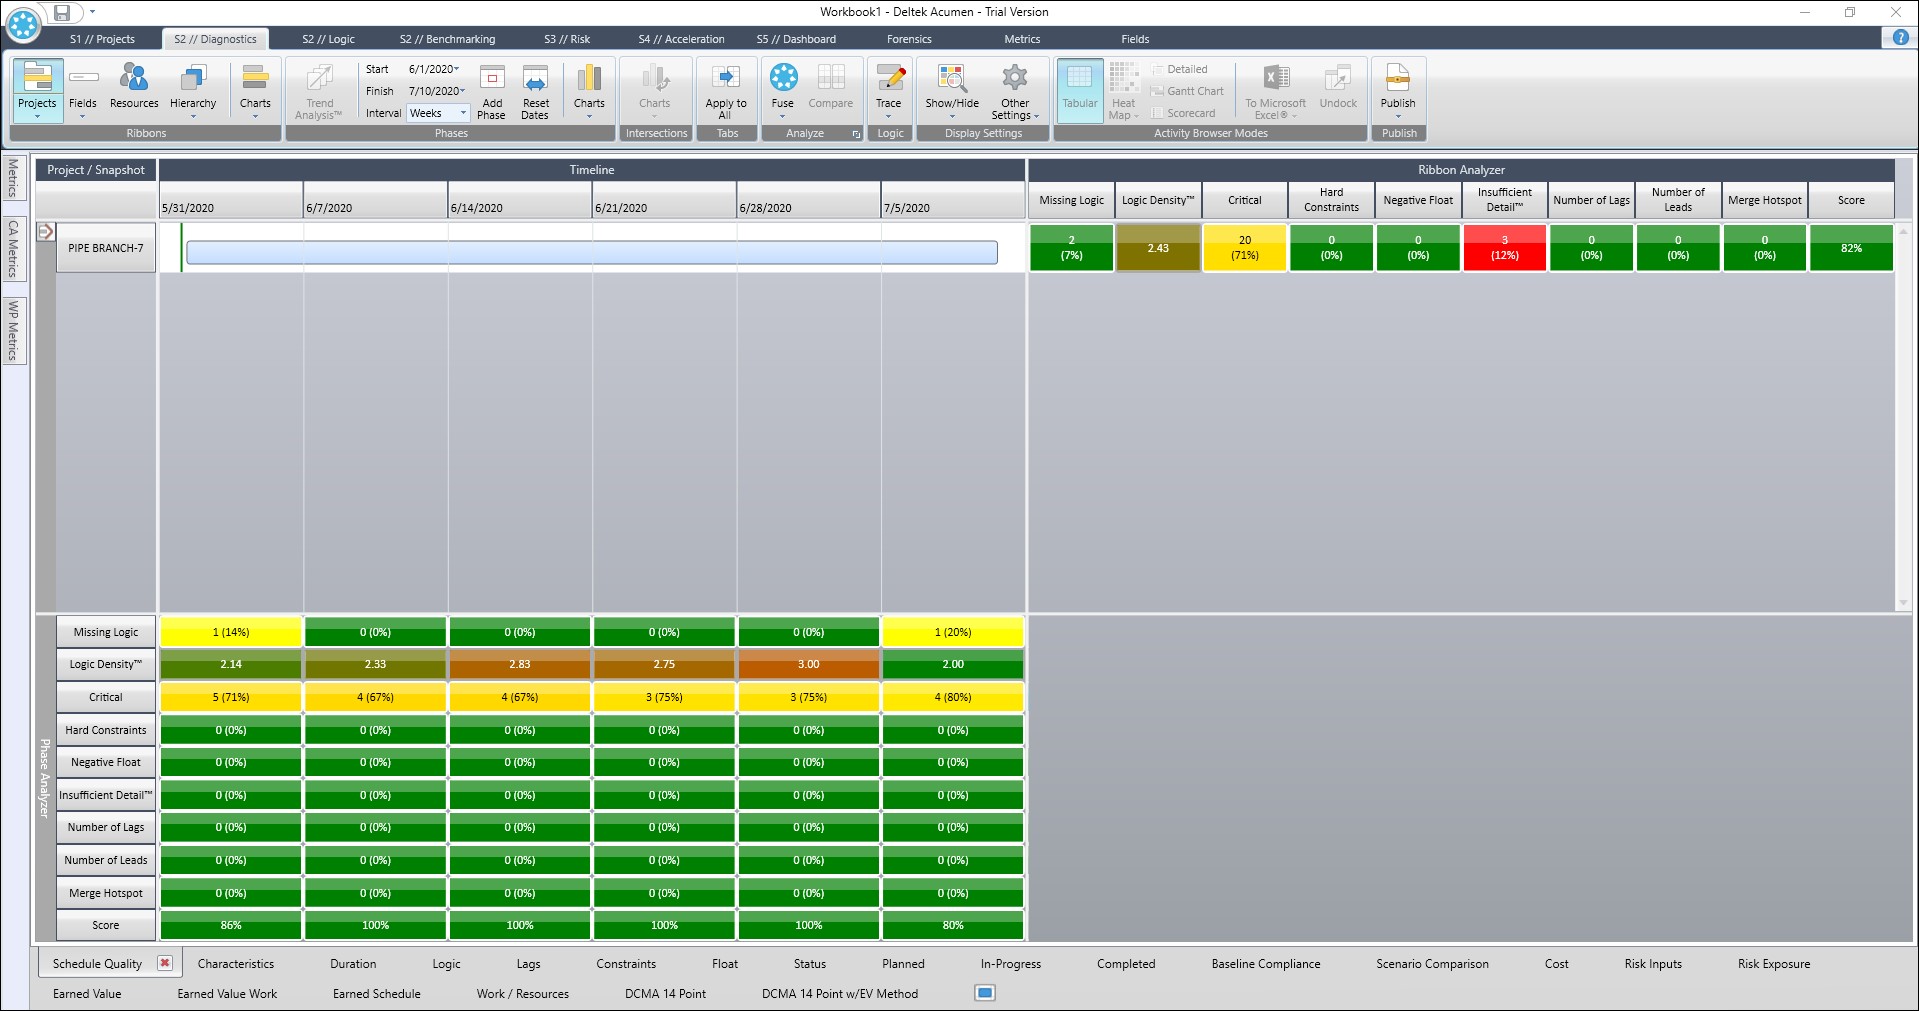
Figure 9 has both the ribbon analyzer results and phase analyzer results. The phase analyzer shows the schedule’s metric performance through each interval in the schedule. Our phase analyzer interval is weeks, which is the default. The ribbon analyzer results provide a project summary of the schedule’s performance for each metric in the Schedule Quality group. A zoomed in display of the Schedule Quality Ribbon Analyzer results is in Figure 10.
Figure 10
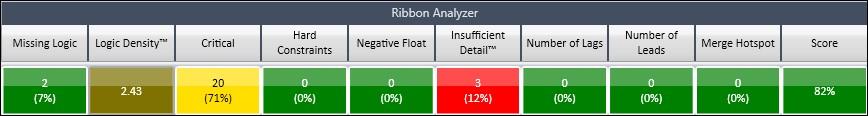
Figure 11 displays the scorecard results of the Schedule Quality analysis.
Figure 11
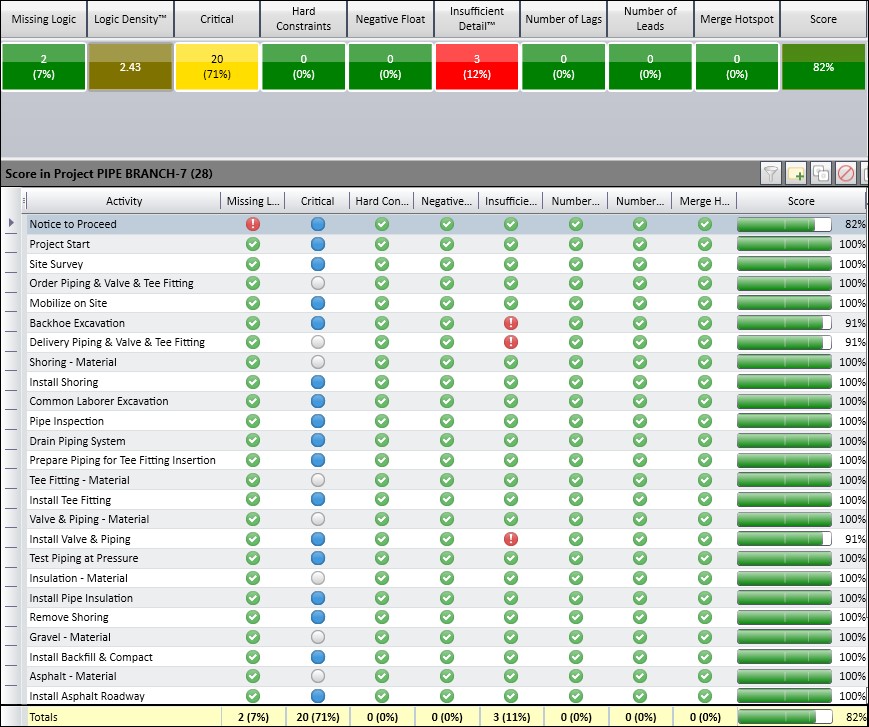
It is important to note at this juncture that the Acumen Options | User Interface is set to “record fails if 1 Metric fails”. This means that if an activity, which is a record, fails any one metric then it effectively has failed all metrics, and that task is given a failing score.
The breach of any single metric on an activity will prevent that activity from receiving a passing grade. This is a more stringent requirement than “Average of Metrics”, which calculates the quality score using an average of the metric scores. For all your fuse diagnostic analyzes we recommend the default setting “record fails if 1 Metric fails” as it provides a more conservative analysis of schedule quality.
When we examine the Schedule Quality results, using “record fails if 1 Metric fails”, we find our schedule receives an overall passing score of 82%. This is good. The Missing Logic metric had two tasks or records that failed. This is not a concern. The rule is every activity must have at least one predecessor and one successor. The exceptions to this rule are the first activity has no predecessor and the last activity has no successor.
Well, the flagged activities are Notice to Proceed the first activity and Project Complete the last activity. Logic density has a score of 2.43, which indicates more than two relationships per activity. A score of two means each activity has exactly two relationships. A score of 2.43 is acceptable. Note that logic density is not included in the overall schedule quality analysis score.
The schedule also has 20 critical activities. These critical activities are considered neutral and do not add or takeaway from the overall score. The main metric of concern is insufficient detail. Three activities failed this metric. Figure 12 lists each of the flagged insufficient detail activities.
Figure 12
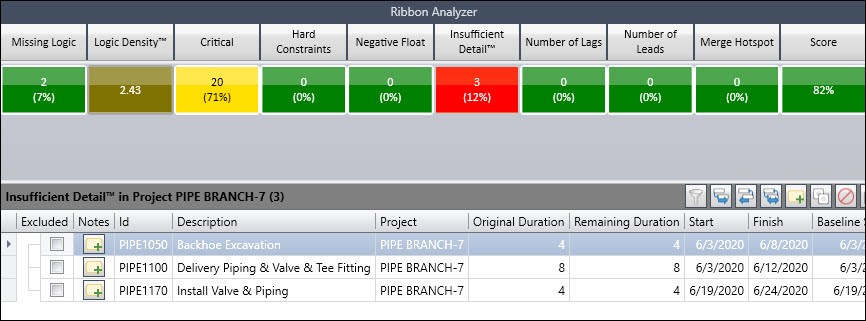
These activities are not that long, but because of the overall short duration of the project they raise a red flag.
So, the schedule receives an overall Schedule Quality metric group passing score of 82%. This provides us a degree of confidence when commencing the SRA. It is important to note that the Schedule Quality metric group has seven metrics that consider completed activities. Ideally, we want our schedule quality analysis to consider remaining work. Therefore, it may be good to inspect our schedule using a metric group that primarily looks at remaining work.
DCMA 14-Point Assessment Group
The Defense Contract Management Agency (DCMA) 14-Point Assessment has 14 metrics, and only three consider completed activities. The DCMA 14-Point Assessment therefore provides a good inspection of the remaining portion of the schedule. Acumen includes a “DCMA 14 Point” metric in the bottom metric groups ribbon.
We again click on S2 // Diagnostics, Figure 13.
Figure 13
We choose the “DCMA 14 Point” metric group in the bottom ribbon, Figure 14.
Figure 14

We then run a Fuse diagnostic analysis of “DCMA 14 Point” metric group, Figure 15.
Figure 15
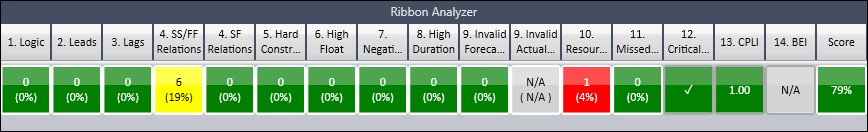
Our score comes in slightly lower for the “DCMA 14 Point”, but we still receive an overall passing score of 79%, Figure 16.
Figure 16
One of the warnings is for the “SS/FF relationships” metric, which flags six activities, Figure 17, that have Start-to-Start (SS) relationships.
Figure 17
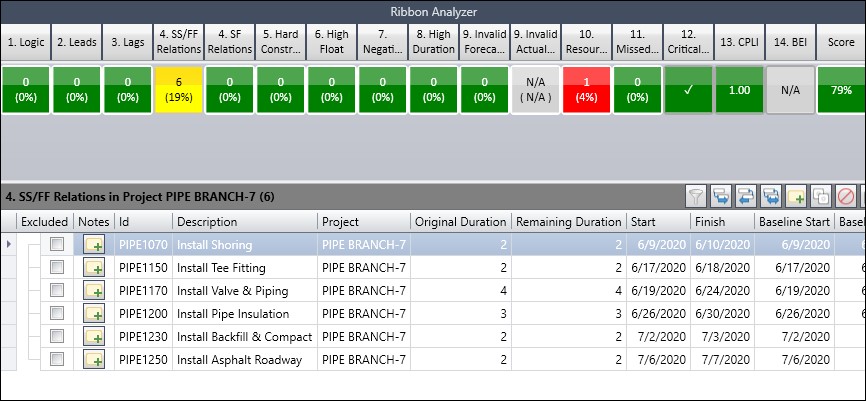
The “DCMA 14-Point Assessment” says 90% of activities should be Finish-to-Start (FS), and, therefore, only 10% should be SS and Finish-to-Finish (FF). One main reason FS relationships are preferred is because it is best to commence a successor activity based on a completed known scope of work; FS relationships are more conducive to this.
SS and FF relationships are acceptable, but FS relationships are favored. So, SS and FF relationships should be used sparingly.
The only red flag from our “DCMA 14 Point” analysis is the Resources metric. The DCMA 14-Point assessment does not require cost loaded activities, but if a schedule is cost loaded then it must be comprehensive; all activities in a cost loaded schedule must have cost. The ‘Delivery Piping & Valve & Tee Fitting’ activity, Figure 18, is not cost loaded. So, this task fails the metric.
Figure 18
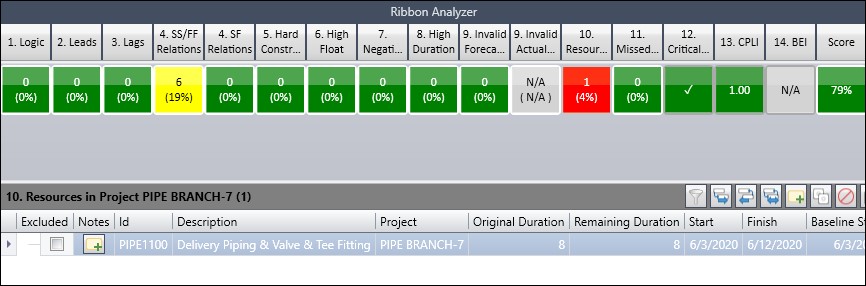
The reason we do not have a resource assigned to ‘Delivery Piping & Valve & Tee Fitting’ is because it is performed by an outside source. We could, however, provide a fixed price cost for the delivery expense.
Well, we examined the more stringent ‘DCMA 14 Point’ metric group that primarily considers incomplete tasks. We received a score of 79%, which, again, is a passing score. The ‘DCMA 14 Point’ metric group has several metrics that do not relate directly to SRA. We want to create a metric group that is solely important for SRA.
Core-Four SRA Metric Group
The below five metrics relate directly to SRA:
- Constraints
- Missing Logic
- Leads
- Lags
- Redundant Logic
The ‘Schedule Quality’ metric group and the ‘DCMA 14 Point’ metric group consider hard constraints, but not soft constraints. The ideal is to remove all constraints from the schedule, both hard and soft.
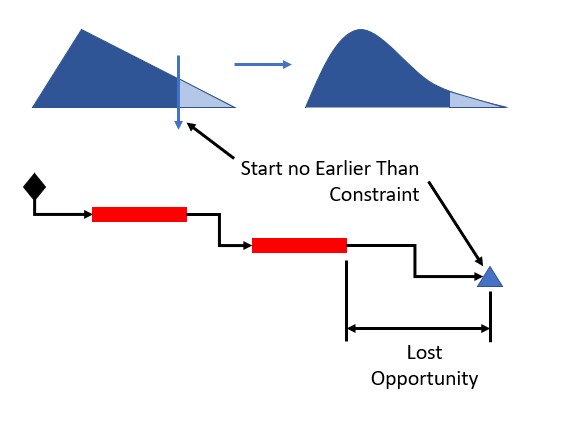
Constraints define important dates in the life of the project that are above and beyond the dates computed from duration estimates and network logic. All constraints are discouraged but soft constraints, such as Start On or After (SOOA), may be acceptable. In the SOOA soft constraint you have variability in the random number generation after the SOOA constraint date, but no leverage to generate random numbers earlier. By insertion of the SOOA constraint you lose the opportunity for random numbers earlier than the constraint date, Figure 19.
Figure 19
Note that the missing logic, leads, and lags all appear in both the ‘Schedule Quality’ and ‘DCMA 14 Point’ metric groups. Redundant logic does not have a metric group defined. It is good to note that Acumen can inspect schedule redundant logic in Acumen S2 // Logic.
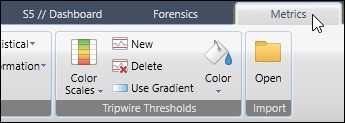
We want to create a metric group for our ‘Four Core SRA’ metrics: constraints, missing logic, leads, and lags. We begin by choosing the Metrics tab, Figure 20.
Figure 20
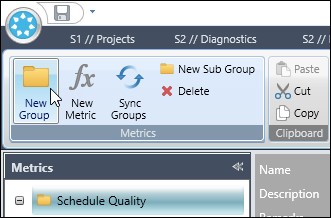
We then click New Group to create a new metric group, Figure 21.
Figure 21
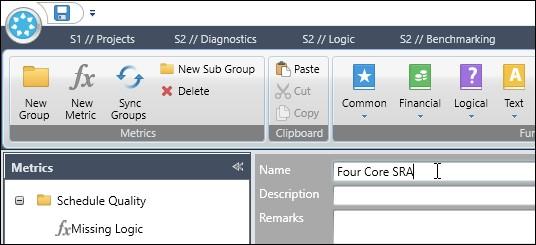
In the name field we enter the metric group name ‘Four Core SRA’, Figure 22.
Figure 22
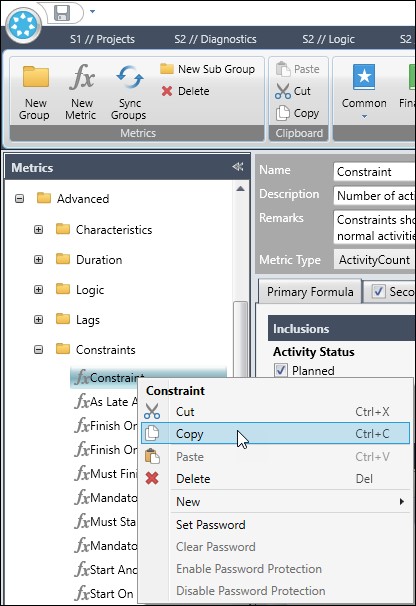
We then dive into the advanced metrics | constraints and right click and select copy from the popup menu, Figure 23.
Figure 23
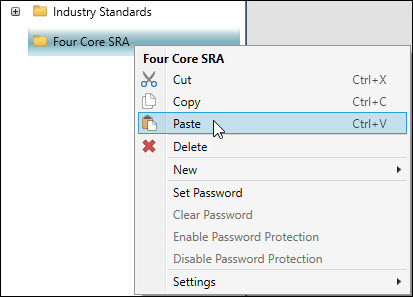
We then paste constraints into our new ‘Four Core SRA’ metric group, Figure 24.
Figure 24
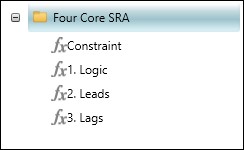
We then choose logic, leads, and lags from the ‘DCMA 14 Point’ group. We copied these metrics from the ‘DCMA 14 Point’ group because these ‘DCMA 14 Point’ metrics do not include completed activities in the analysis. The final ‘Four Core SRA’ metric group appears in Figure 25.
Figure 25
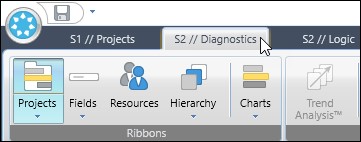
Continuing we dive into S2 // Diagnostics, Figure 26.
Figure 26
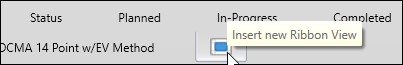
We choose to insert a new Ribbon View, Figure 27.
Figure 27
We right click on the new Ribbon View and select Rename from the popup menu, Figure 28.
Figure 28

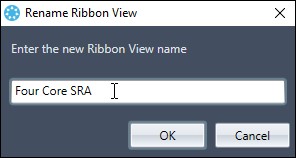
We enter the name in the rename ribbon view, Figure 29.
Figure 29
Then right click on each metric in ‘Four Core SRA’ and select ‘Add to All Analyzers’ in the popup menu, Figure 30.
Figure 30

Now we run a Acumen Fuse ‘Four Core SRA’ diagnostic analysis, Figure 31.
Figure 31
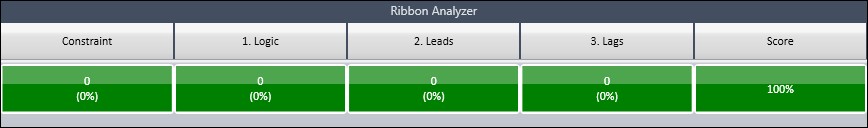
The results of the ‘Four Core SRA’ analysis is in Figure 32.
Figure 32
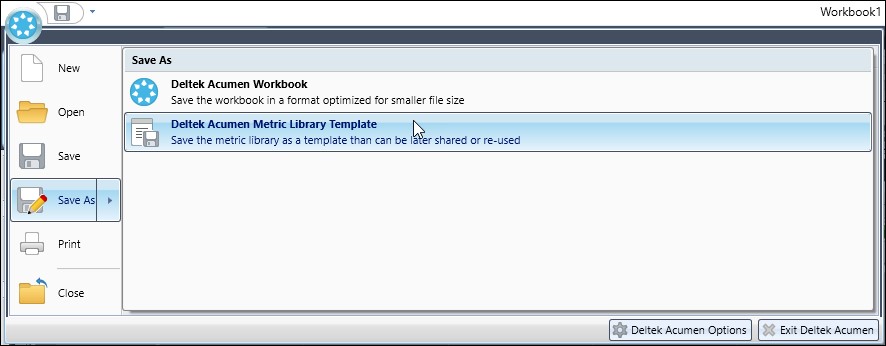
We then want to save template in the metric library to make it available to other workbooks, Figure 33.
Figure 33
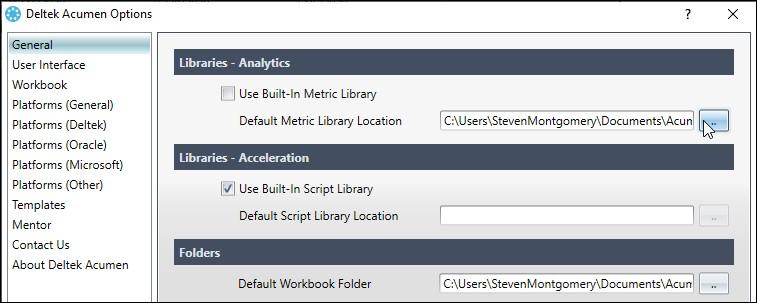
We continue and enter the Deltek Acumen Option dialog and choose General. Then we click on the Default Metric Library Location ellipse button, Figure 34.
Figure 34
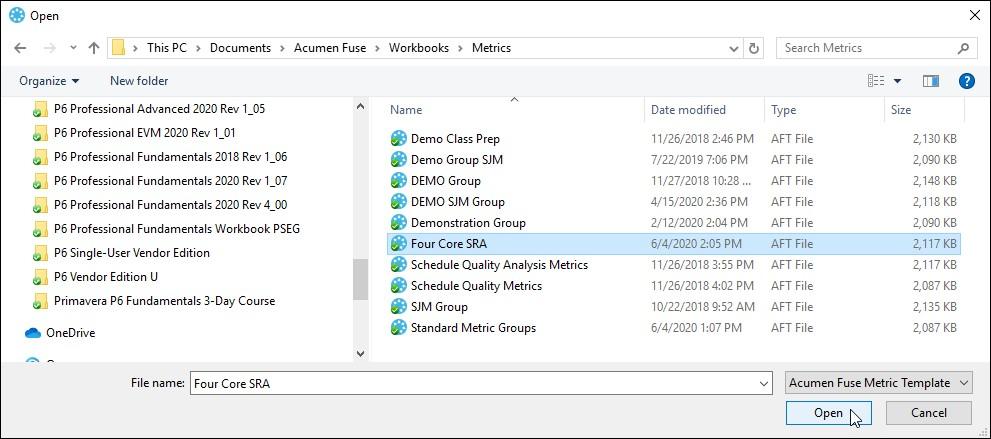
Finally, we find our ‘Four Core SRA.aft’ file and click open, Figure 35.
Figure 35
Now we can create a new workbook that will include the recently created ‘Four Core SRA’ metric group in the bottom ribbon, as displayed in Figure 36.
Figure 36

Summary
It is important to have a well-built schedule. This is particularly important if your goal is to create an Acumen Risk Analysis schedule. Deltek Acumen has an abundance of metrics (300+) to support inspecting the quality of your schedule. It is good to inspect your schedule using Acumen’s default Schedule Quality Analysis metric group and the ‘DCMA 14 Point’ metric group.
At bare minimum for SRA you should consider constraints, missing logic, leads, lags, and redundant logic. You can create your own personalized metric group in Acumen including constraints, missing logic, leads, and lags. Again, redundant logic can be inspected in Acumen’s logic feature.