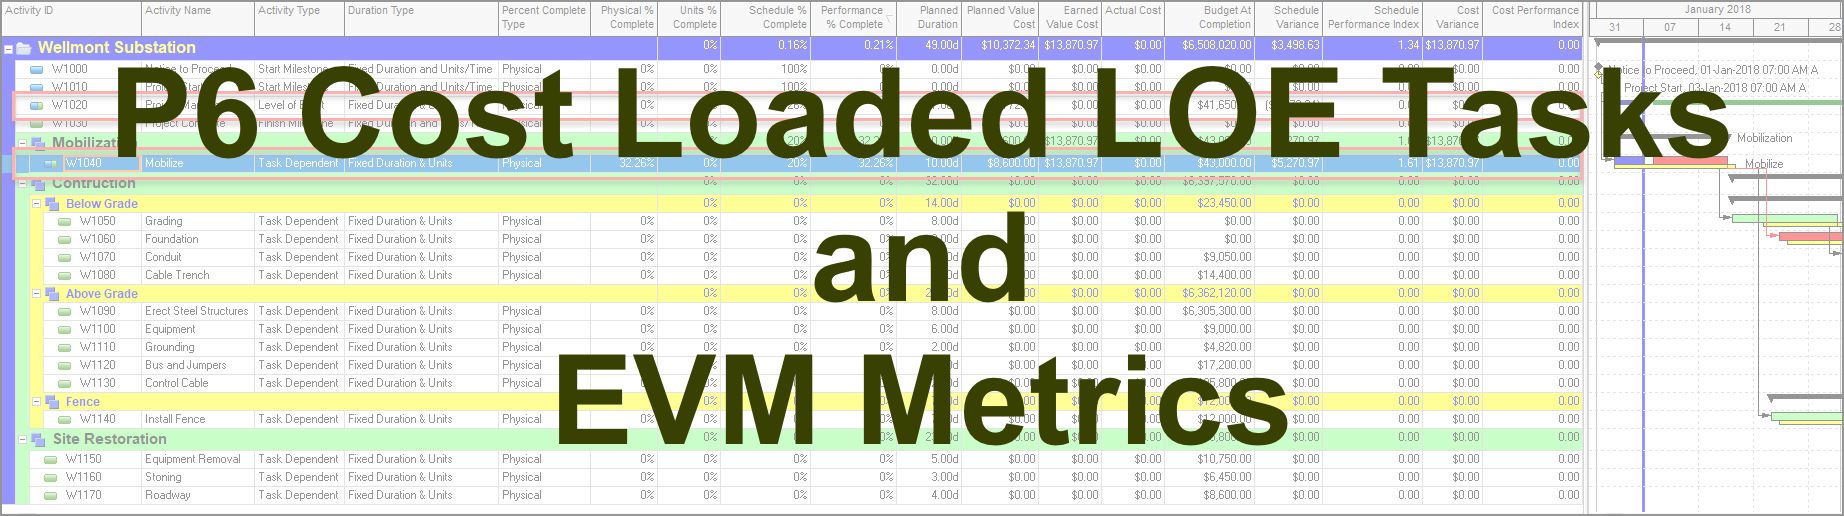
 We received the following question regarding P6 and Level of Effort (LOE) activities: “Will cost loaded LOE tasks still be allowed to be included in the Earned Value Management (EVM) metrics out of P6.” Let’s take a look at this.
There was a more a specific question that followed. Will the cost loaded LOE activities “count towards Schedule Performance Index (SPI) and Cost Performance Index (CPI) metrics?” In other words, will cost loaded LOE activities be included in calculations for EVM metrics? Answering these questions requires both an understanding of Primavera P6 and EVM guideline requirements.
This article explains whether cost loaded LOE tasks from P6 provide meaningful input to EVM metrics.
LOE task Definition
Let us first explain LOE tasks, their definition, according to Primavera P6, and their usage, in P6.
A LOE activity, as defined by Primavera P6, is a unique type of task that expends resources but does not produce a tangible deliverable. However, the LOE task makes an important contribution to the project. A good example of an LOE task is the project management effort. The project manager provides overarching guidance and control of the project. Yet the project manager effort does not directly correlate to any deliverable, i.e., a product or service.
Another good example is safety management. The safety manager does not produce anything but serves a critical function. The safety manager trains team members in safety protocol and confirms adherence to safety requirements during construction to ensure the well-being and safety of team members. So, the LOE task’s worth though intangible is of high value to the project.
Their intent or usage in P6 is to allow the scheduler a way of tracking efforts that, again, do not directly produce any deliverable. They have no discrete products, but, as explained above, they may nevertheless define important efforts in the life of the project. In P6 the scheduler can cost load LOE tasks and measure their progress in relation to their original duration.
P6 tracks the progress of LOE tasks, but their duration and start and finish dates are determined by the underlying activities. Figure 1 displays an LOE activity, which ties into the beginning and ending of a series of underlying dependent tasks.
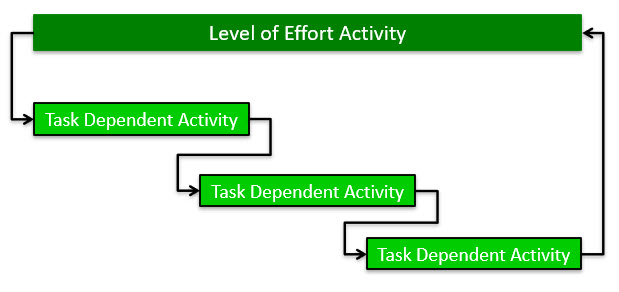 Figure 1
An LOE task typically ties into the first activity in the project or a phase like construction and the last activity in the schedule or respective phase. In Figure 2 we have a demonstration construction project schedule, which has two LOE tasks: Project Management and Safety Management.
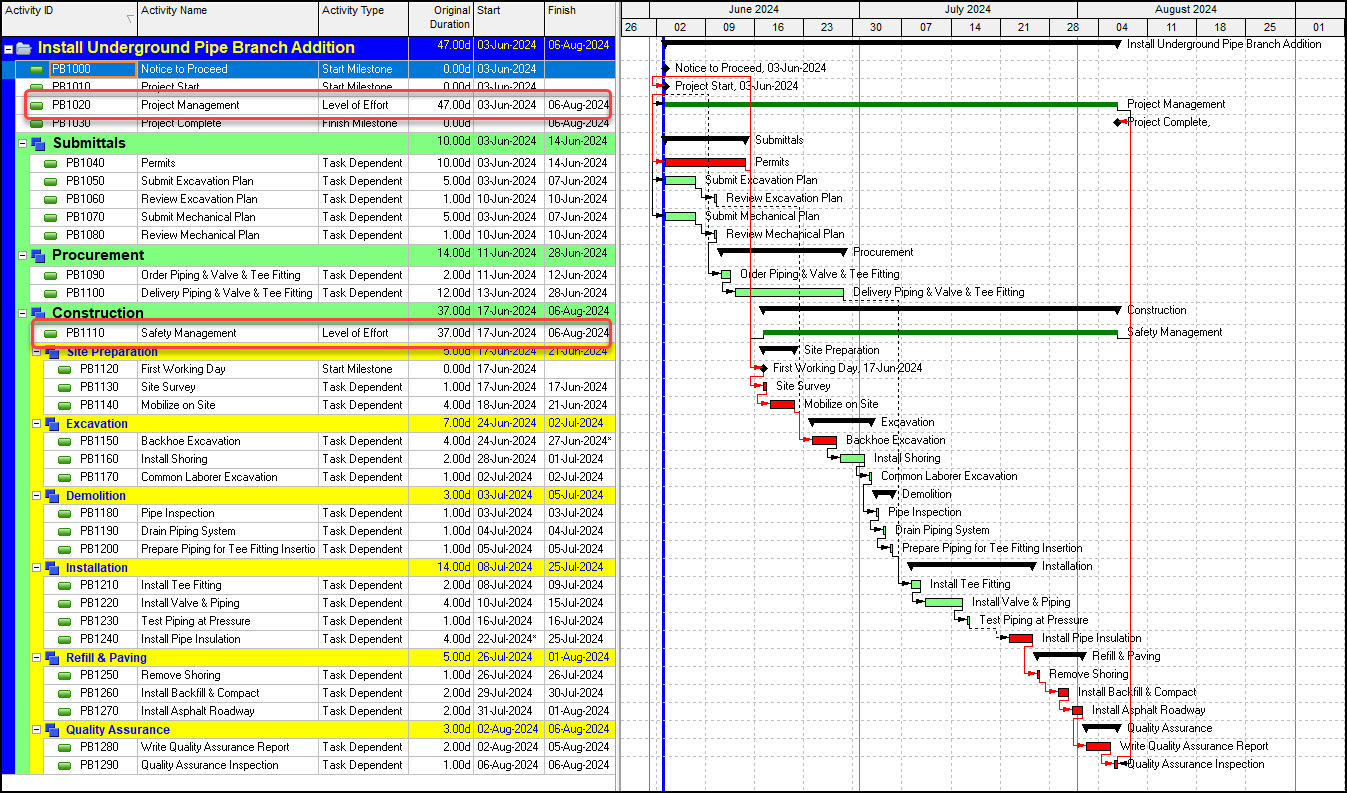 Figure 2
The Project Management LOE activity in Figure 2 ties into Project Start and Project Complete. It stretches the duration of the project. The Safety Management LOE task extends the length of a project phase, the Construction phase, Figure 2. It ties into First Working Day (a milestone) and Quality Assurance Inspection.
Understand that an LOE’s duration is dependent on its predecessor and successor tasks. An LOE task extends and shortens in direct relation to the extension and compression of its respective associated tasks. This means that LOE tasks are not driving activities. They do not determine the start and finish dates of successor activities nor the project conclusion. Again, its duration adjusts according to the ebb and flow of the underlying activities.
EVM Metrics
Let us consider EVM, which quantifies project progress. It compares actual progress to planned progress and funds spent. EVM quantifies schedule progress using three metrics. Before proceeding we need to define these EVM terms. Below are the three EVM variables used in measuring progress and in calculating metrics like SPI and CPI.
Budgeted Cost for Work Scheduled (BCWS) or Planned Value (PV) is the value of work planned.
Budgeted Cost for Work Performed (BCWP) or Earned Value (EV) is the value of work completed.
Actual Cost of Work Performed (ACWP) or Actual Cost (AC) is the funds spent.
LOE Contribution to EVM Metrics
Given, as stated above, that LOE tasks do not drive the schedule, the question then becomes do cost loaded LOE tasks make a meaningful contribution to EVM metrics, particularly, SPI and CPI?
Schedule EVM Metrics:
Let us first consider the Schedule Variance (SV) and SPI metrics. There are two ways to calculate both SV and SPI: 1) in economic units (dollars) using the time phased performance plan vertical axis and 2) in time units (days, weeks, months) using the horizontal axis. Figure 3 is a graph illustrating schedule variance of a time phased performance plan or PV plotted against AC and EV, and a monthly reporting period.
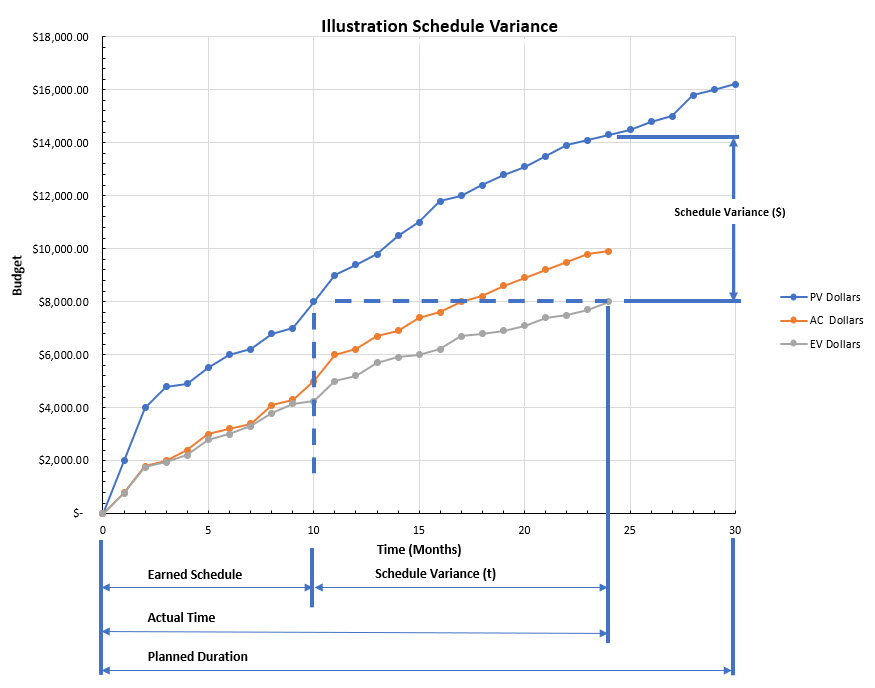 Figure 3
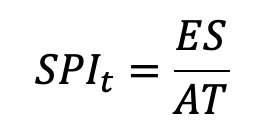
Note that the $ and t subscripts distinguish between SV on the vertical axis ($), and SV on the horizontal axis (t). From the horizontal axis you can measure the Earned Schedule (ES), the Actual Time (AT), and SVt. You can also compute the SVt using the ES and AT in the following equation:
![]()
Further, ES and AT parameters compute the SPIt using the ratio:
The traditional and universally understood schedule variance approach is from the vertical axis, the dollars method ($), and the calculation of this SV$ is as follows:
![]()
This type of schedule variance is not as obvious; it does not convey whether the difference is, perhaps, 1 week, 1 month, or more in time units. Instead, it provides a dollar amount for schedule delay, which is less intuitive than specifying a time variance. Only those familiar with EVM concepts would understand a project could fall behind by a dollar amount. But, as mentioned above, the dollars ($) approach is the standard way in EVM to measure and report schedule variance.
We proceed according to the standard dollarized practice, and the SPI$ computes as follows:
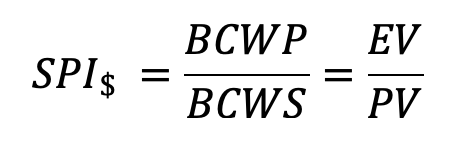 Regarding the second question, will the cost of LOE activities “count towards Schedule Performance Index (SPI)” metrics? Are they included in the SPI$ computation for the project? To answer these questions, we must investigate whether cost amounts, i.e., dollars, assigned to LOE activities, such as project management or safety management, are included in the overall SV$ and SPI$ calculations for P6 schedules?
We find when we look at PV, EV, and AC values for P6 LOE tasks that they roll-up their dollar values. In other words, the LOE task’s PV, EV, and AC are summed into the overall project level PV, EV, and AC values. It follows that they therefore are included in the project calculations of SV$ and SPI$. Cost loaded LOE activities therefore count towards project level EVM metrics. But are they meaningful? Let us consider government EVM requirements. Government guidelines like the Centers for Medicare and Medicaid Services (CMMS) EVM Best Practices report say to keep the LOE method to “a minimum portion of the project planned value to avoid distortion of the project level metrics.” So, the guideline indicates that the LOE method negatively affects the accuracy of project level schedule EVM metrics like SPI$. The guideline says to limit the size of the LOE method to avert this corruption.
Further, general industry consensus says, the “universally accepted standard definition and practice for calculating LOE earned value is to set the BCWP equal to the BCWS each performance reporting period.”
So, according to EVM theory, it is best to set LOE schedule EV equal to PV each reporting period. Further, the LOE method does not measure task schedule performance it simply acknowledges the passage of time. Thus, the LOE schedule variance (SV) is always zero.
Schedule variance visibility for these [LOE] types of tasks is basically irrelevant. If SV$ is zero then EV equals PV, and SPI$ equals one, which means that the project LOE task proceeds according to schedule.
This on time schedule performance, where the LOE task SPI$ equals one, will skew project SPI$ high when the summing tasks are behind and skew project SPI$ low when they are ahead. It is for this reason that, again, guidelines recommend the judicious and limited use of the LOE method. The more LOE tasks in the schedule the more the skew, and for each LOE task the larger the cost loading the more skew.
Therefore, again, as stated by the CMMS EVM report the “LOE method [both the number and size of cost Loaded LOEs] should be kept to a minimal portion of the project planned value.”
In P6, the scheduler must enter updates for the LOE activity in a particular fashion to progress the LOE according to plan when the underlying tasks are not to schedule. The steps are as follows:
- the LOE PV is computed when the schedule achievement is entered (at this stage no input is required for the LOE activity) and the schedule is calculated
- the scheduler then must manually enter a Physical % Complete value for the LOE task to generate the LOE task’s relevant EV
- finally, the AC comes from a units % complete field data input for the LOE.
The scheduler then has all the EVM values necessary to compute the LOE task’s SV$ and SPI$, which for each reporting period are zero and one, respectively.
Cost EVM Metrics:
LOE tasks behave like Task Dependent activities in terms of resource assignments and cost loading. As mentioned above, the PV, EV, and AC values of LOE tasks sum into the overall project level PV, EV, and AC values. These EVM values input to calculate cost variance (CV):
![]()
And the calculation for the CPI is below:
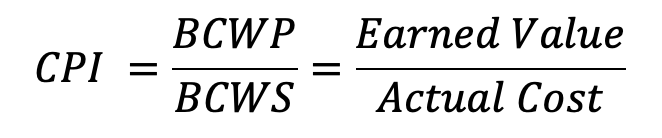 So, the LOE task costs contribute to CV and CPI metrics. But to what degree? And are they reliable? The extent is determined by the respective LOE cost. If the LOE costs are material, then we ask are they helpful indicators of project CV and CPI metric performance? Cost variance, however, is relevant and of value for early visibility. So yes, LOE task cost loadings contribute in a meaningful way to CV and CPI.
But be watchful that the LOE cost does not duplicate cost assignments in the activities that drive it. The cost assigned to the LOE must represent the LOE itself in terms of units and cost. Also, to compute the correct AC turn off “recalculate actual units and cost when duration % complete changes”.
If it is on when the LOE task EV is set equal to PV (as the universal practice for LOE tasks), then AC and EV will always be equivalent and the CPI will always compute to 1.0, which is not what you want. The AC comes from a units % complete field data input, which you specify.
P6 EVM Demonstration – Progressing an LOE Task
We want to demonstrate EVM metric computations in P6 when progressing the schedule. Further, we show how to properly progress the LOE task to achieve agreeable EVM metric results. And for our P6 EVM demonstration we will use the LOE task practice BCWP equals BCWS, i.e., EV equals PV, every performance reporting period.
Proceeding we have in Figure 4 a demonstration schedule that includes an LOE project management task, W1020.
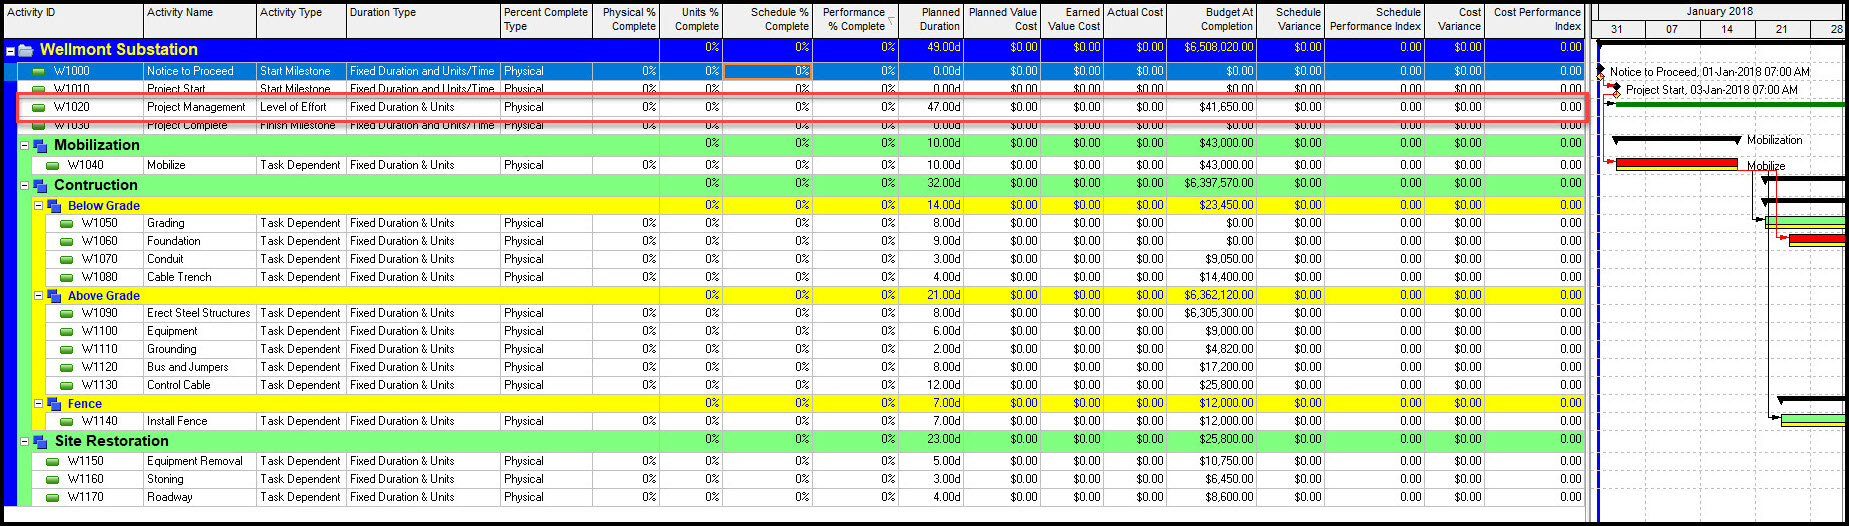 Figure 4
We note for our demonstration that the duration type of all activities except milestones is ‘Fixed Duration and Units’. This indicates that the schedule is time constrained, and cost constrained. Further, the percent complete type of the LOE is physical. The physical percent complete type requires the scheduler to enter a physical % complete value and a remaining duration or expected finish date. The physical percent complete type separates the work physically achieved from the expected remaining duration.
Before proceeding with the schedule progression, we adjust the calculations settings for the schedule, Figure 5.
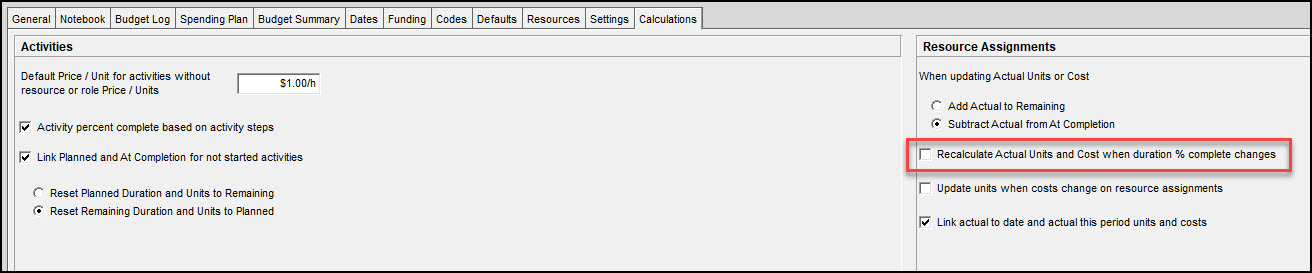 Figure 5
Make certain to turn off “recalculate actual units and cost when duration % complete changes”, Figure 5. We want to manually input the actual cost of the LOE activity.
We proceed and progress the schedule one week. We complete Notice to Proceed and Project Start tasks, Figure 6.
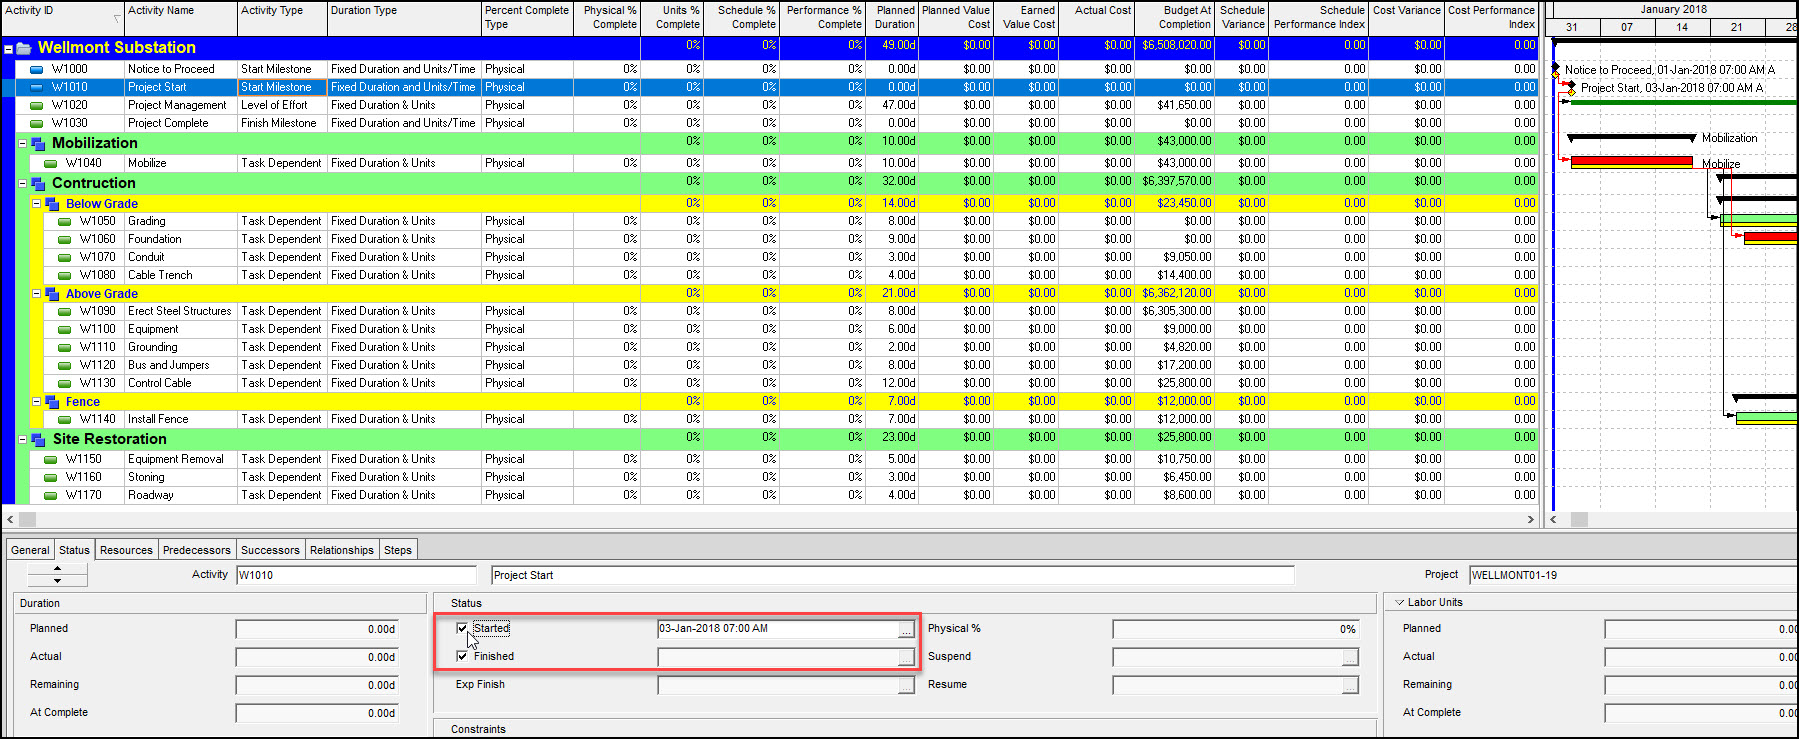 Figure 6
We do not need to progress the Project Management LOE task, as that computes PV automatically when the schedule is calculated. We continue and select Mobilize and in the steps tab bottom details and mark ‘Acquire Jobsite Trailer’ step complete for the Mobilize effort, Figure 7.
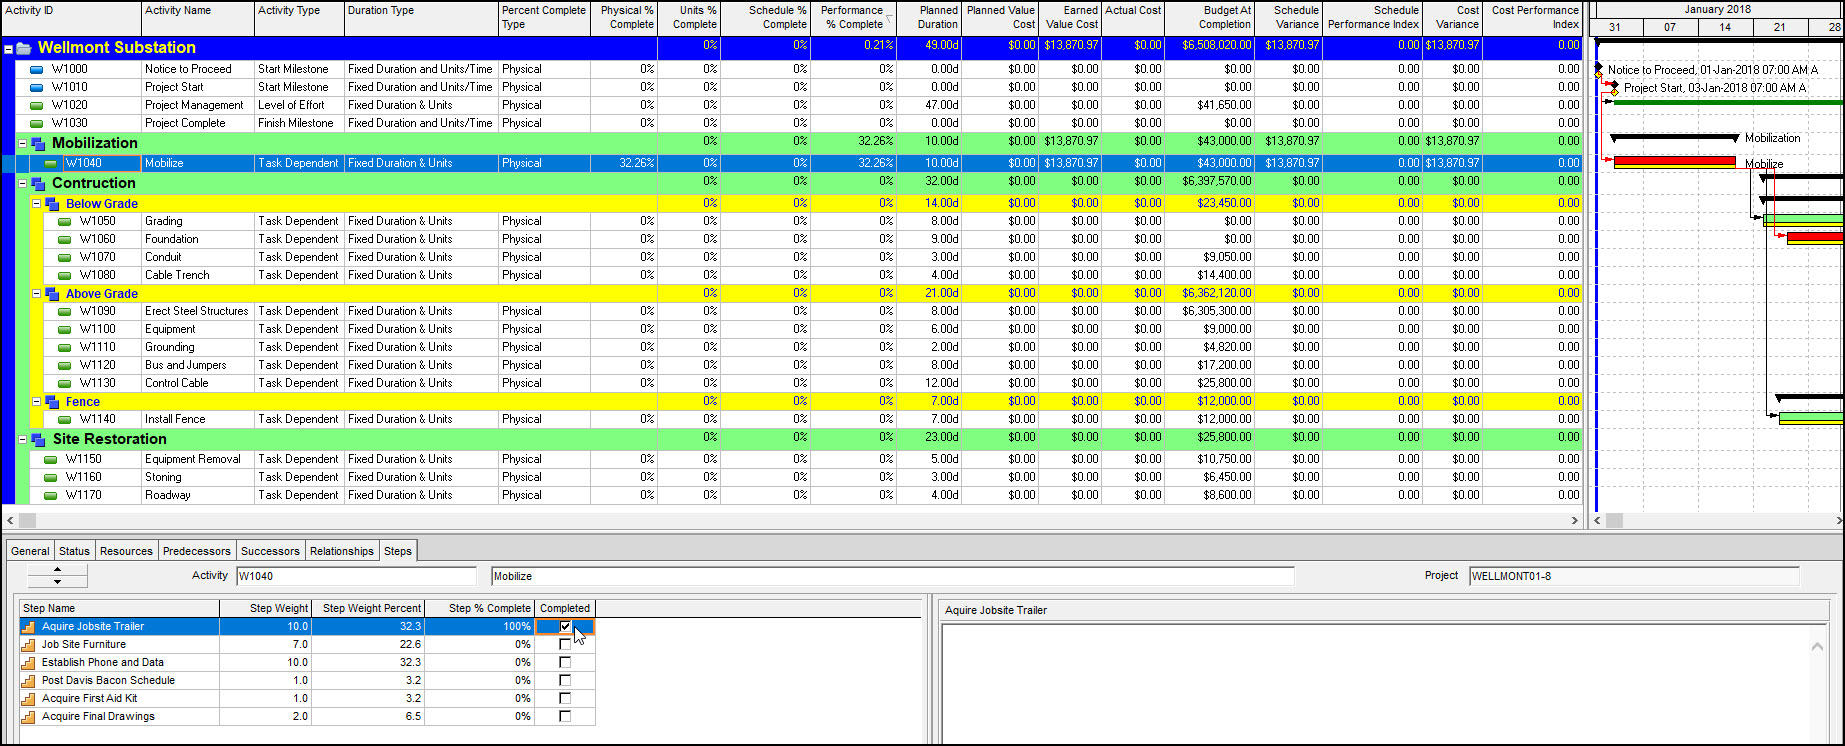 Figure 7
Then in the bottom details we select the Status tab and say Mobilize started as planned and its estimated remaining duration is 7-days, Figure 8.
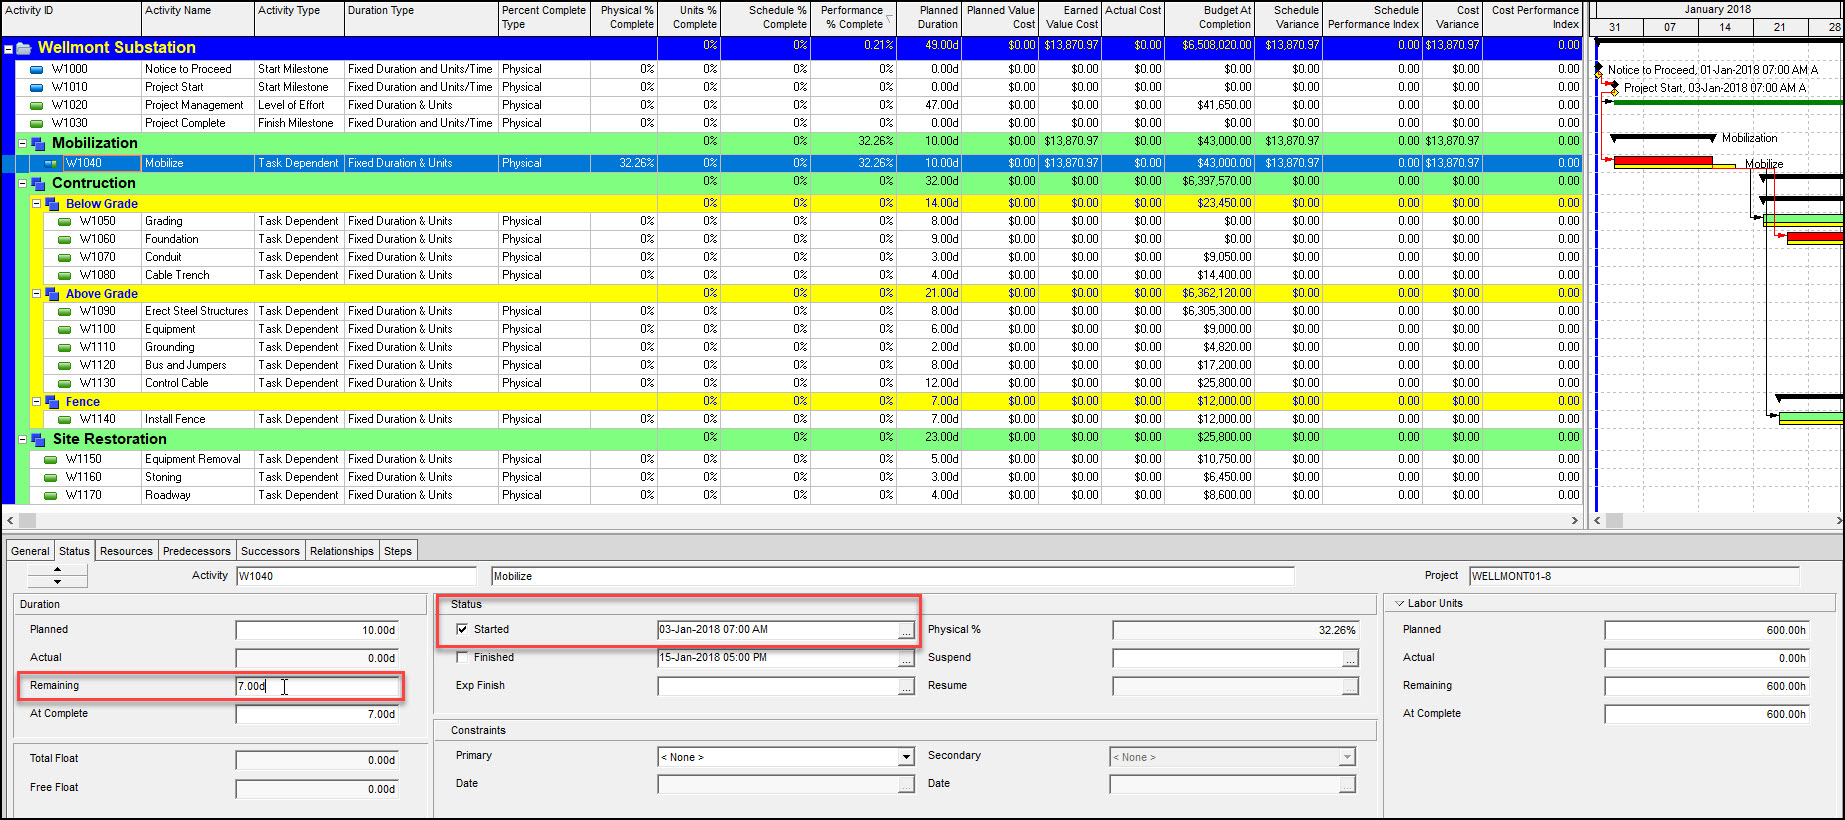 Figure 8
Great! That is all the input required for the enter status. Now we are ready to move the data date forward one week to the end of the reporting period and recalculate the schedule. Choose Tools | Schedule | Options, Figure 9, and set the data date to January 7th, 2022, which is the end of the first one week reporting period.
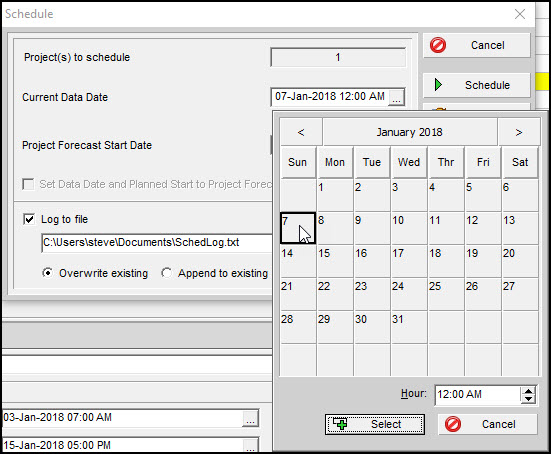 Figure 9
In Figure 10 we choose to recalculate the schedule.
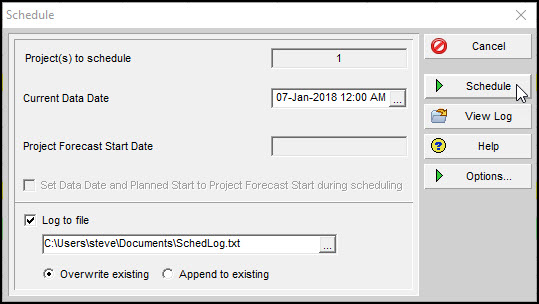 Figure 10
The resulting schedule appears in Figure 11.
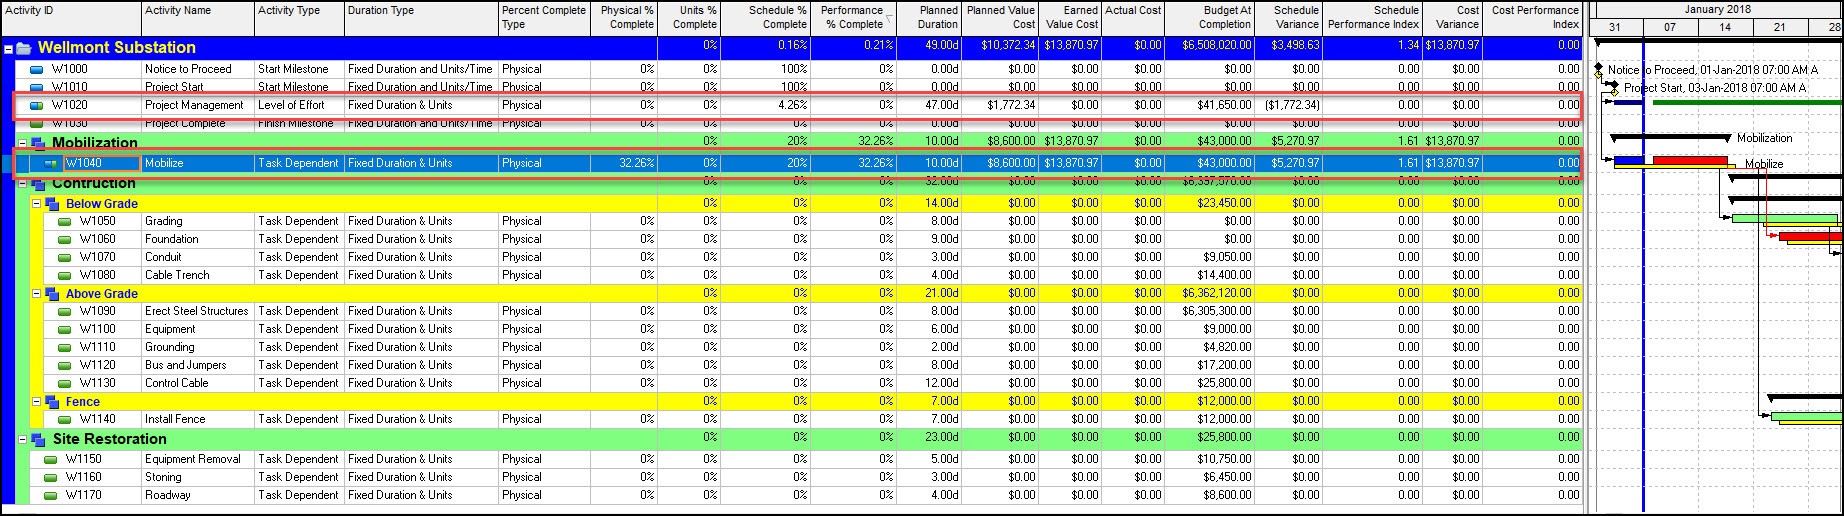 Figure 11
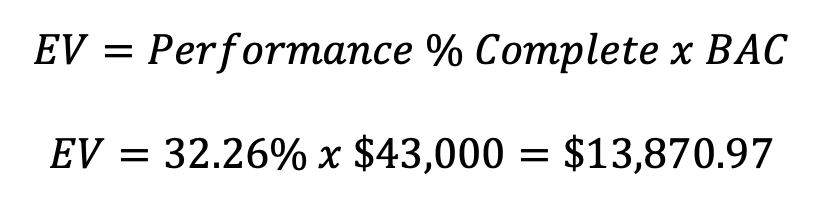
When the project schedules, the PV populates for the progressed activities. Note that Project Management does not have an EV. This is because we have not specified a physical % complete for project management. Mobilize has an EV of $13,870.97 based on its 32.26% physical % complete. This is calculated using the following equation:
 We need to specify a physical % complete for Project Management. We choose a Project Management physical % complete value so that its EV equals its PV, $1,772.34, as dictated by the LOE EVM practice standard. This LOE physical % complete value calculates:
 When we enter a Project Management Physical % Complete of 4.25532% the EV equals PV, and SV equals zero, as intended, Figure 12.
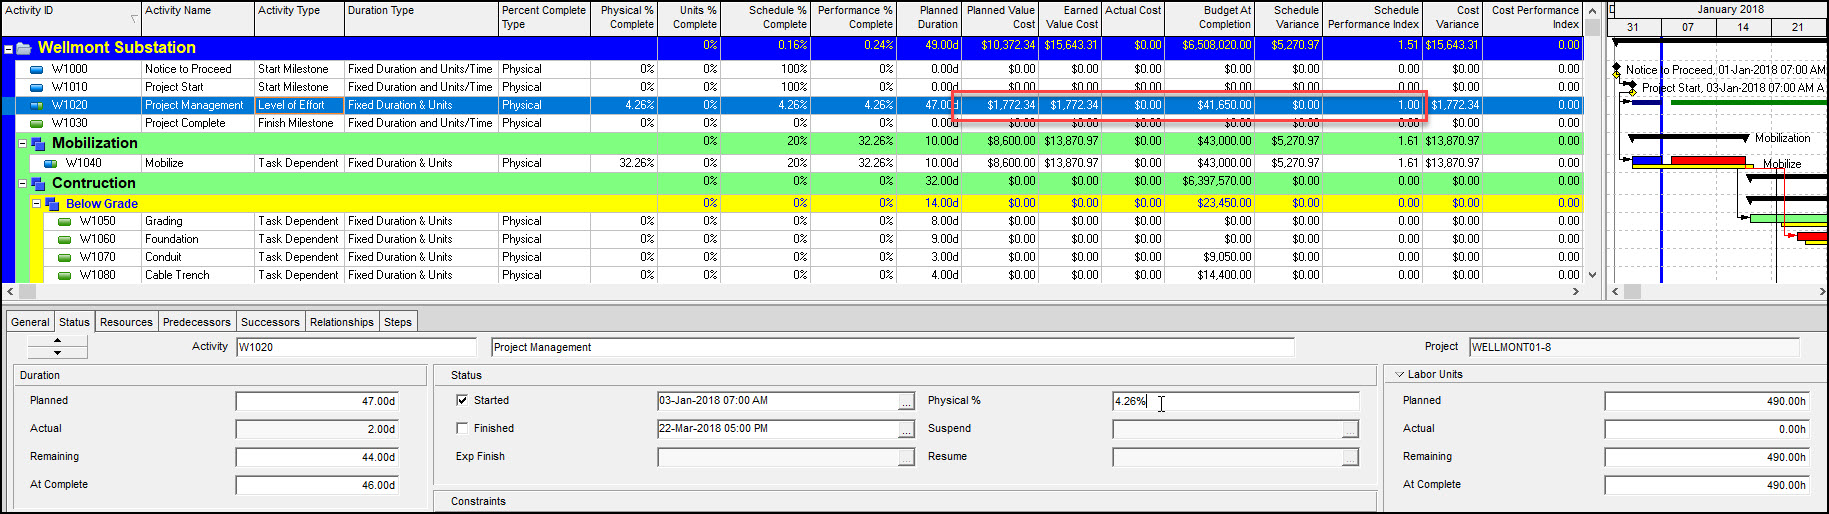 Figure 12
Now we need to insert actual costs values for both Project Management and Mobilize. This is achieved by entering a suitable units % complete value for each, Figure 13.
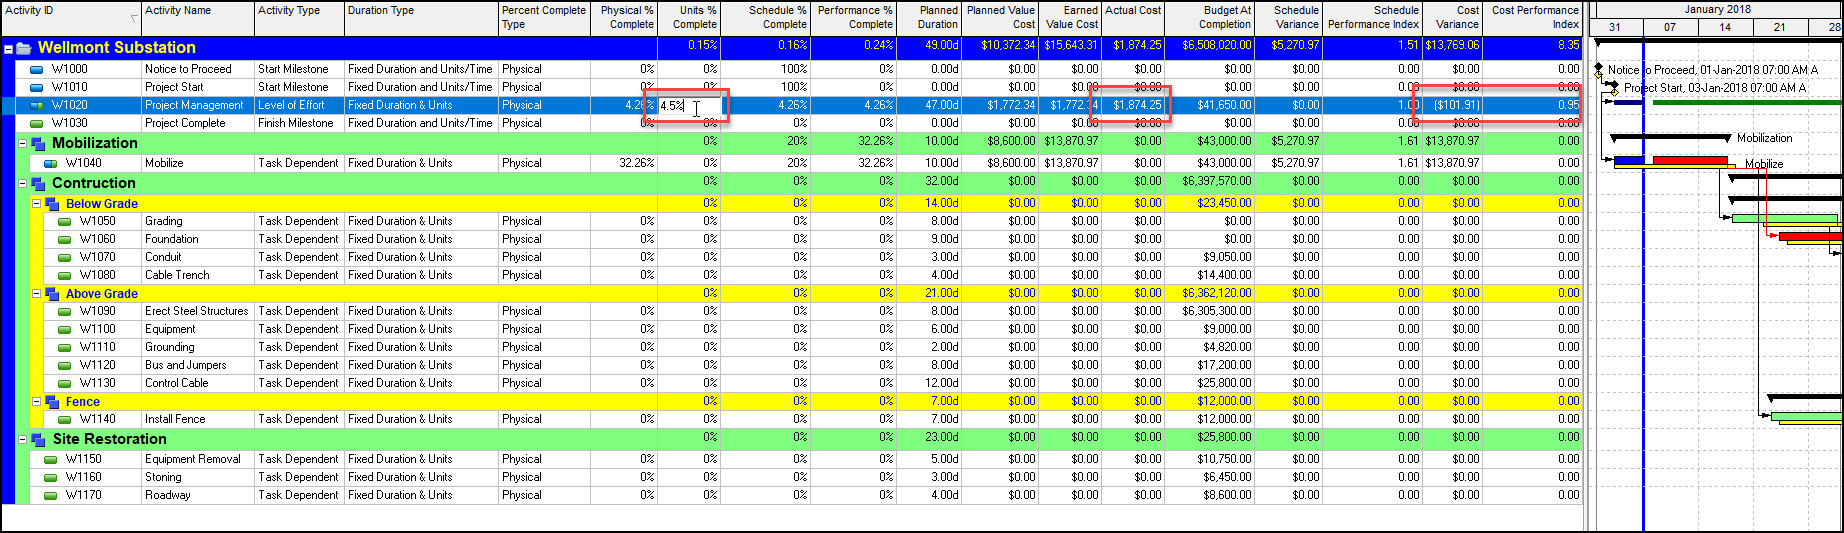 Figure 13
Note the units % complete field value is used to generate the AC. We enter a Project Management units % complete value of 4.5%. This is slightly above the Physical % Complete value, 4.26%, so the Project Management team is spending slightly above budget. Note AC $1,874.25 and CV -$101.91 and CPI 0.95. Continuing we specify a units % complete value for Mobilize, Figure 14.
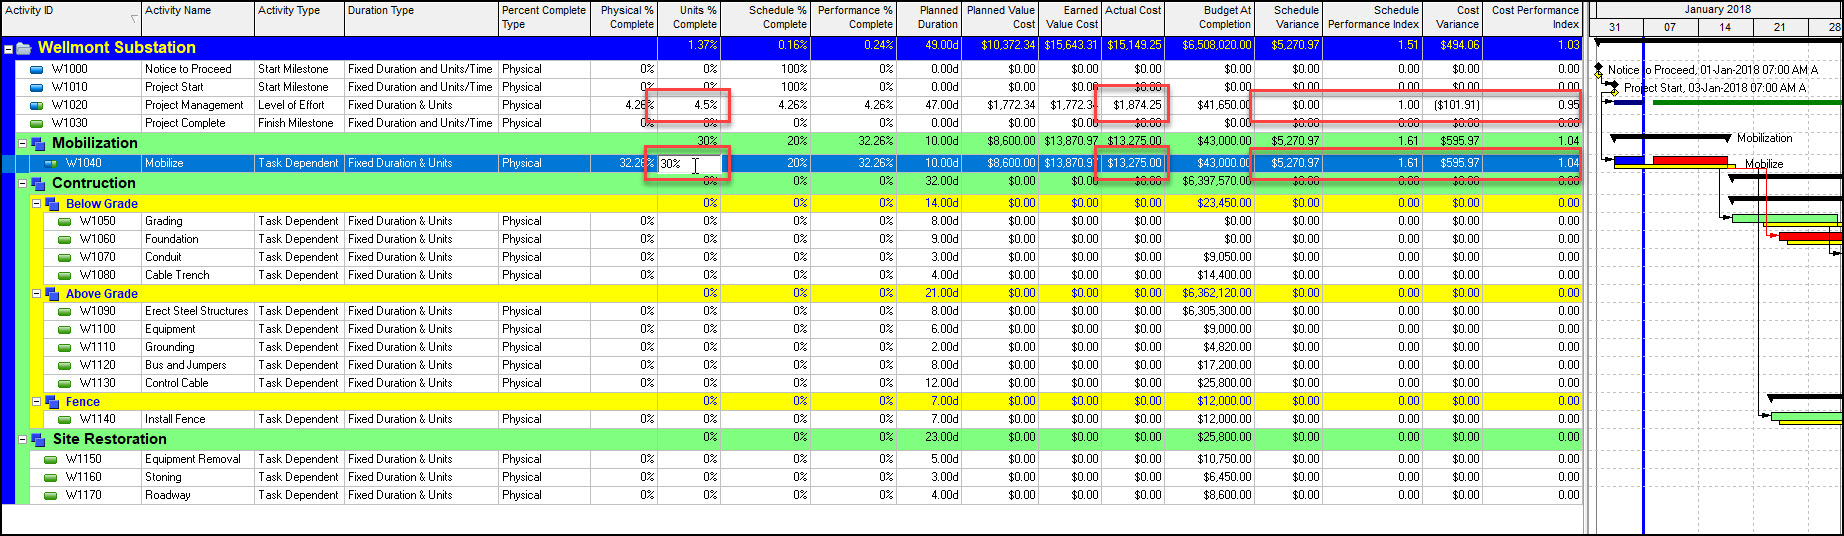 Figure 14
The Mobilize units % complete value is 30%. This is higher than the Schedule % Complete value of 20%, but lower than the Physical % Complete 32.28% value. Note AC $13,275.00 and CV $595.97 and CPI 1.04. Mobilize is underspending.
Summary
The standard practice for LOE tasks in EVM is to make the EV equal to the PV for each reporting period. The SV$ is therefore zero for all reporting periods. And the SPI$ becomes one for all reporting periods. It is neither behind nor ahead of schedule. To achieve this in P6 we must toggle off “recalculate actual units and cost when duration % complete changes”.
Then the steps to progress the LOE activity are:
- move the data forward and recalculate the schedule to find the LOE’s PV
- Enter a suitable physical % complete value to compute the LOE’s EV (choose a physical % complete so that the LOE EV equals PV)
- Enter a units % complete value to specify the LOE’s AC. Again, the resulting LOE task SV$ is zero and the SPI$ is one
As noted, the LOE method does not measure task schedule performance it simply acknowledges the passage of time. And, the LOE SPI$ does not compute an insightful value. The LOE cost EVM values, however, roll-up and sum into the project level PV, EV and AC, therefore, effecting the project SPI$.
For this reason, government EVM guidelines recommend limiting the LOE method portion of the schedule. The LOE cost loaded task also effects the project level CV and CPI, but it computes in a meaningful way. So, LOE EVM metrics are included in the P6 project level EVM metrics.
Conclusion
Cost loaded LOE activities count towards SPI$ and CPI metrics. CPI in a meaningful way, and SPI$ in a way that distorts the true project SPI$. Therefore, limit the number and size (i.e., dollars) of cost loaded LOE tasks to restrain inaccurate bias in project level SPI$ EVM analyses results.