Project progress does not always go according to plan. When a schedule slips you will want a fast way to monitor this schedule slippage in Microsoft Project.
The baseline is used as a measure of schedule progress. Microsoft Project has a few features to support monitoring schedule progress against the baseline. The slippage feature, in particular, displays a bar extending from the baseline start to task current start directly on the Gantt chart. This provides a graphical display of schedule slippage situation. It is also possible to tabulate slippage from the baseline on the task table.
This article demonstrates a quick tip on how to monitor schedule slippage in Microsoft Project.
We have in Figure 1 our demonstration project schedule.
 Figure 1
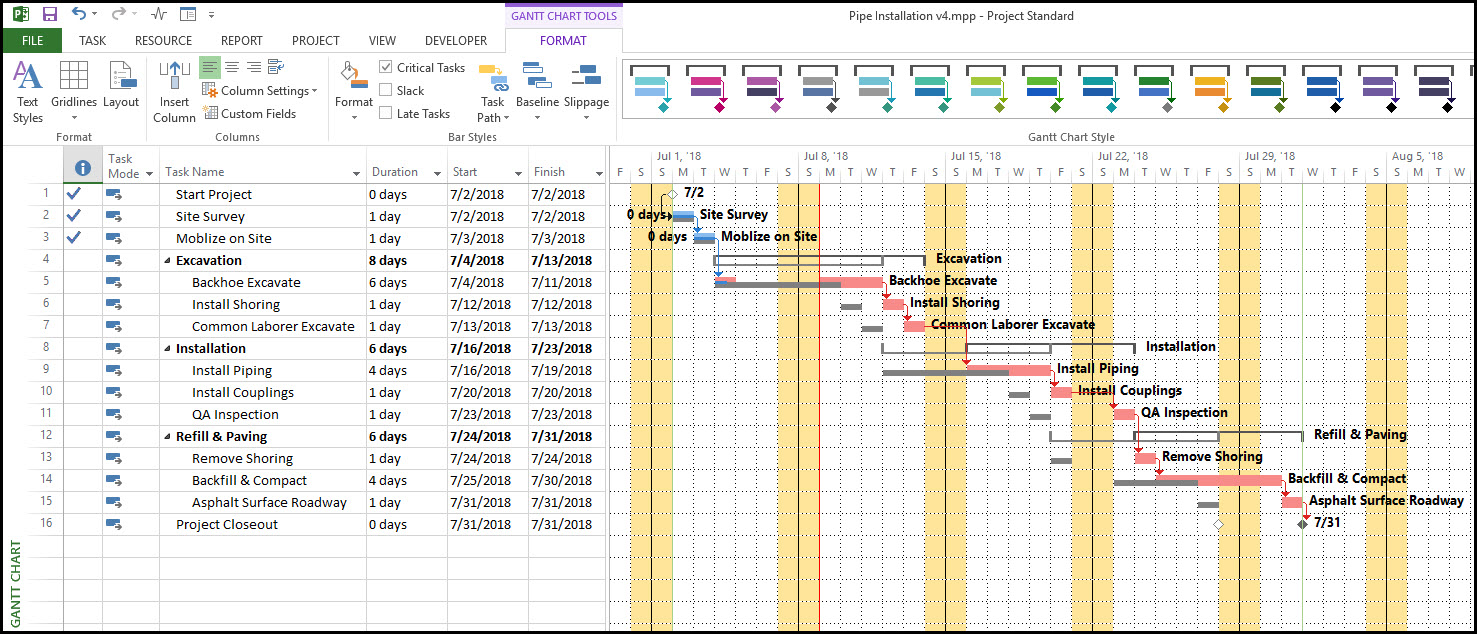
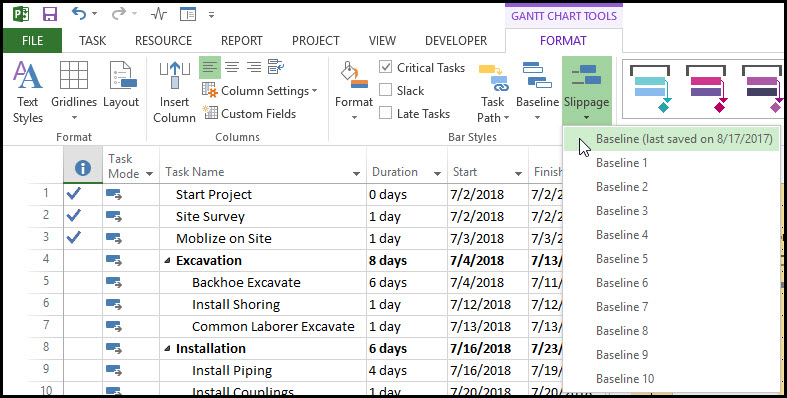
This schedule has progressed one week. It is possible to perceive the schedule slippage by comparing the baseline to the task current start on the Gantt chart. Microsoft Project also has a schedule slippage feature to swiftly monitor slippage on the Gantt chart. To display a slippage bar on the Gantt chart select the Format tab, Bar Styles ribbon group, and slippage. Select the saved baseline, Figure 2.
Figure 2
Let’s now select format tab, bar styles ribbon group, format drop down menu, and bar styles to look at the definition of the slippage bar in the bar styles dialog, Figure 3.
Figure 3

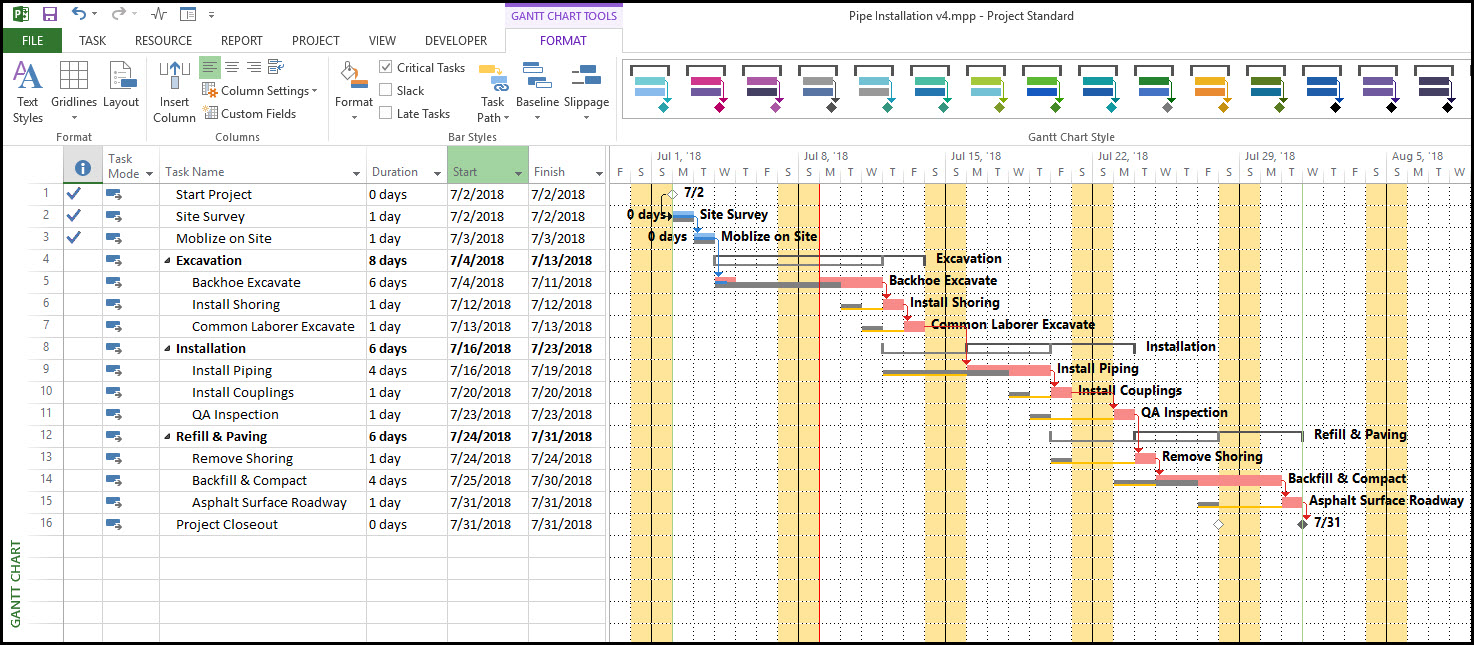
We select a suitable orange color. Observe that the bar extends from the baseline start to the task start. Select OK in the bar styles dialog, Figure 3. Now with our active slippage bar we are able to quickly monitor the schedule slippage, Figure 4.
Figure 4
If you want to monitor tabulated slippage values add the start variance column to the task table, Figure 5.
Figure 5
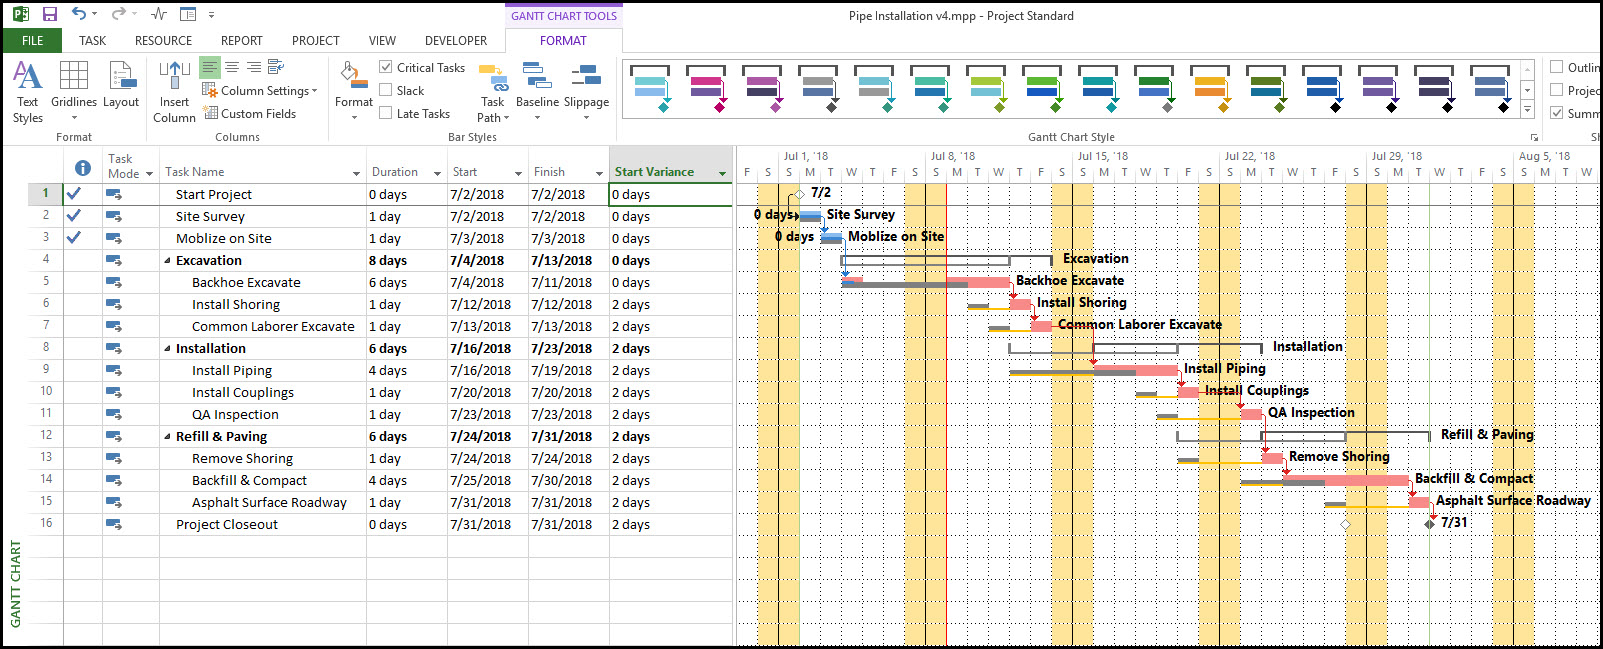
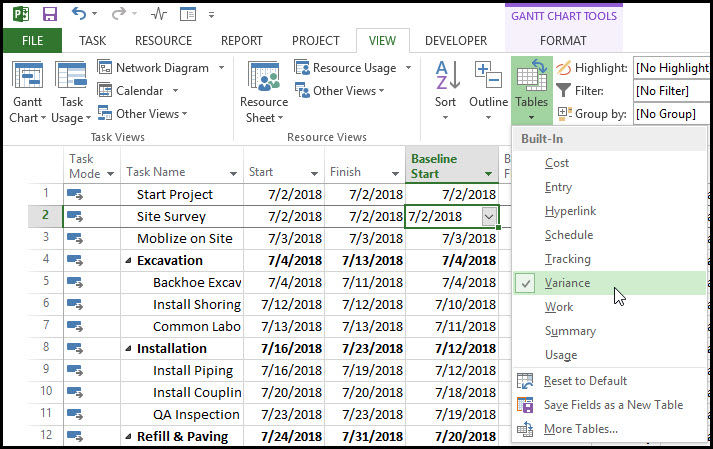
Interpret the tabulated values as follows: negative values indicate ahead of schedule, zero values on schedule, and positive values behind schedule. Microsoft Project also has a variance table for quick monitoring of tabulated baseline data. Select the view tab, Data ribbon group, tables drop down menu, and variance, Figure 6.
Figure 6
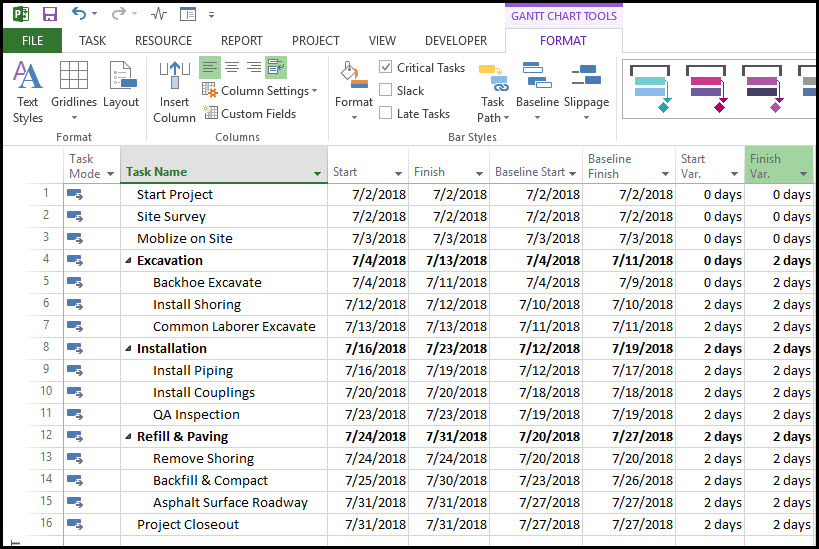
The resulting variance table is displayed in Figure 7.
Figure 7
Summary
Quick monitoring of graphical and tabulated schedule baseline data is possible in Microsoft Project. The slippage format feature displays a slippage bar on the Gantt chart. The variance table also supports quick review of baseline and current status.
Note that the start variance and finish variance values are computed based on the baseline data stored in the baseline field. So if you want to display the start variance in relation to baseline1 you must save this data to the baseline data field.