 We recently received a question asking if Logic Density calculations include milestone activities? Here we’re going to take a look at this and its computation.
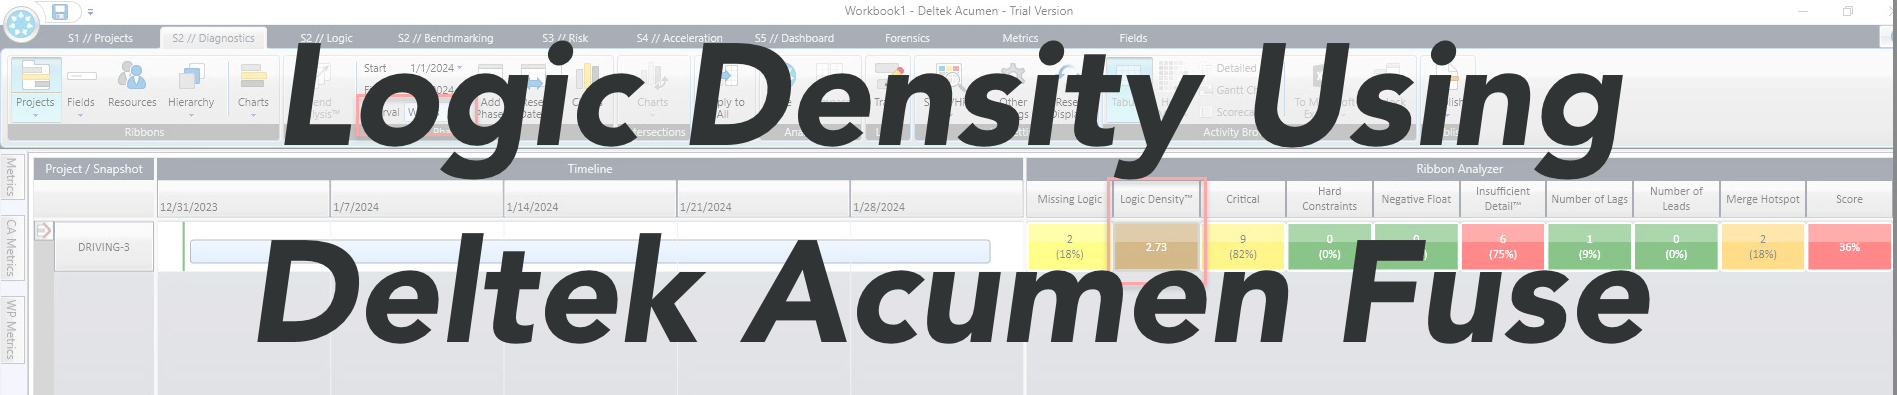
Logic Density is a metric that computes the average number of relationships per activity in the schedule. In theory this should be two or more, as a Logic Density value less than two warns of missing logic. Each activity should have at least one predecessor and one successor.
On the other side, a Logic Density of four and above is an indicator of redundant logic. Schedules with excessively low or high Logic Density scores are flagged for further review. Schedulers can inspect the missing logic metric for Logic Density’s less than two. The Redundancy Index Logic Check pinpoints duplicate relationships for Logic Density scores exceeding four.
This article explains and demonstrates the Logic Density metric calculation in Deltek Acumen Fuse.
The equation Deltek Acumen Fuse uses to compute this is as follows:
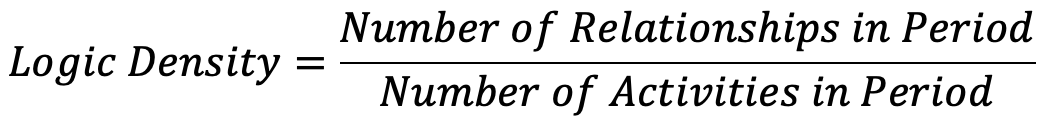 Logic density computes for the project duration or a specified interval. Note that Summary activities and Level of Effort (LOE) activities and their relationships are not included in this calculation. However, all other activity types, including milestones, are included in the computation. Further, all relationships associated with non-LOE tasks are included, even if they connect to LOE activities.
In Figure 1 below, we have our demonstration P6 schedule.
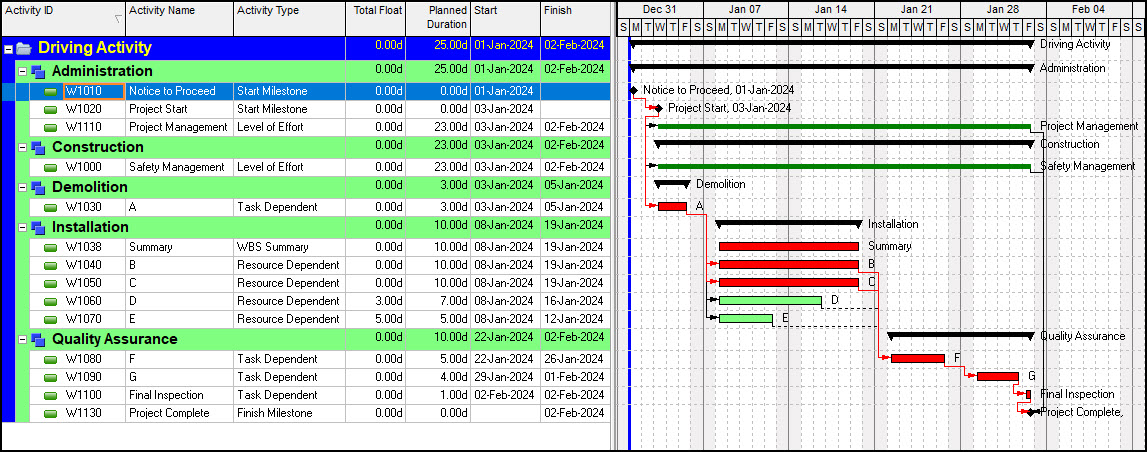 Figure 1
This schedule has two level of effort activities: Project Management and Safety Management, each with two relationships. Remember neither the LOE tasks nor their predecessor/successor relationships are included in the Logic Density calculation. Further, the WBS Summary activity does not add to the activity sum for the Logic Density equation.
Let’s proceed and import this P6 schedule into Deltek Acumen Fuse. In the S1 // Projects tab and the ‘Get External Data From’ ribbon group choose the Oracle Primavera | Single Project from a P6 XER file, Figure 2.
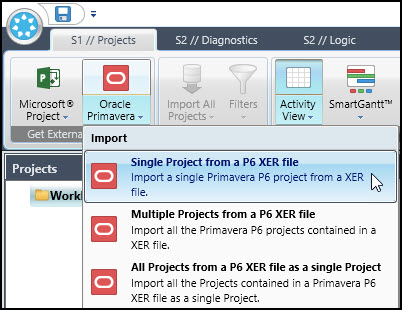 Figure 2
We locate the schedule Driving-3.xer in our file system and click to open. Another dialog appears, Figure 3, asking you to choose the P6 project to import from the Driving-3.xer file.
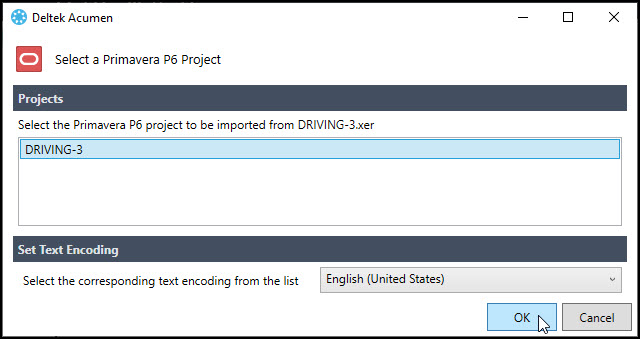 Figure 3
Again, select the Driving-3.xer file and choose OK. This links the Driving-3.xer file to the workbook, Workbook1. Note the schedule has not been imported yet. It is merely linked to the Workbook1, as indicated. Let us continue and import the schedule by clicking on Import All Projects, Figure 4.
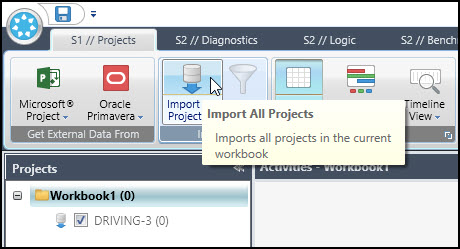 Figure 4
After the schedule imports it appears in the navigator pane with the P6 icon in Workbook1. Proceed and select the Driving-3 schedule and choose Activity View | Grouping | Display Level and set the slider to level 3, Figure 5.
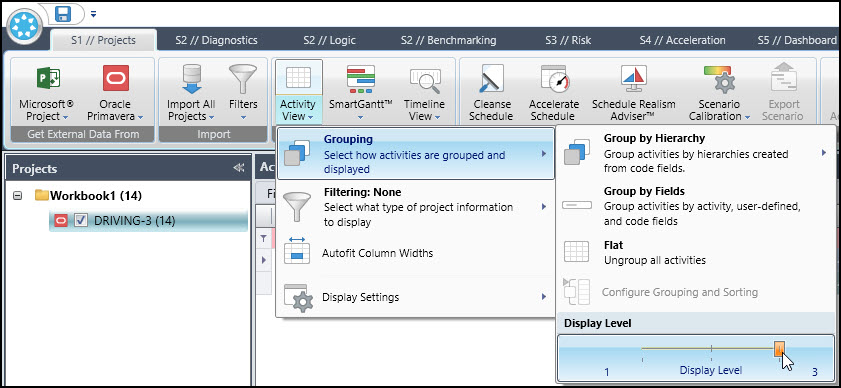 Figure 5
The schedule then appears in Acumen as below, Figure 6, so we can confirm that it imported as planned.
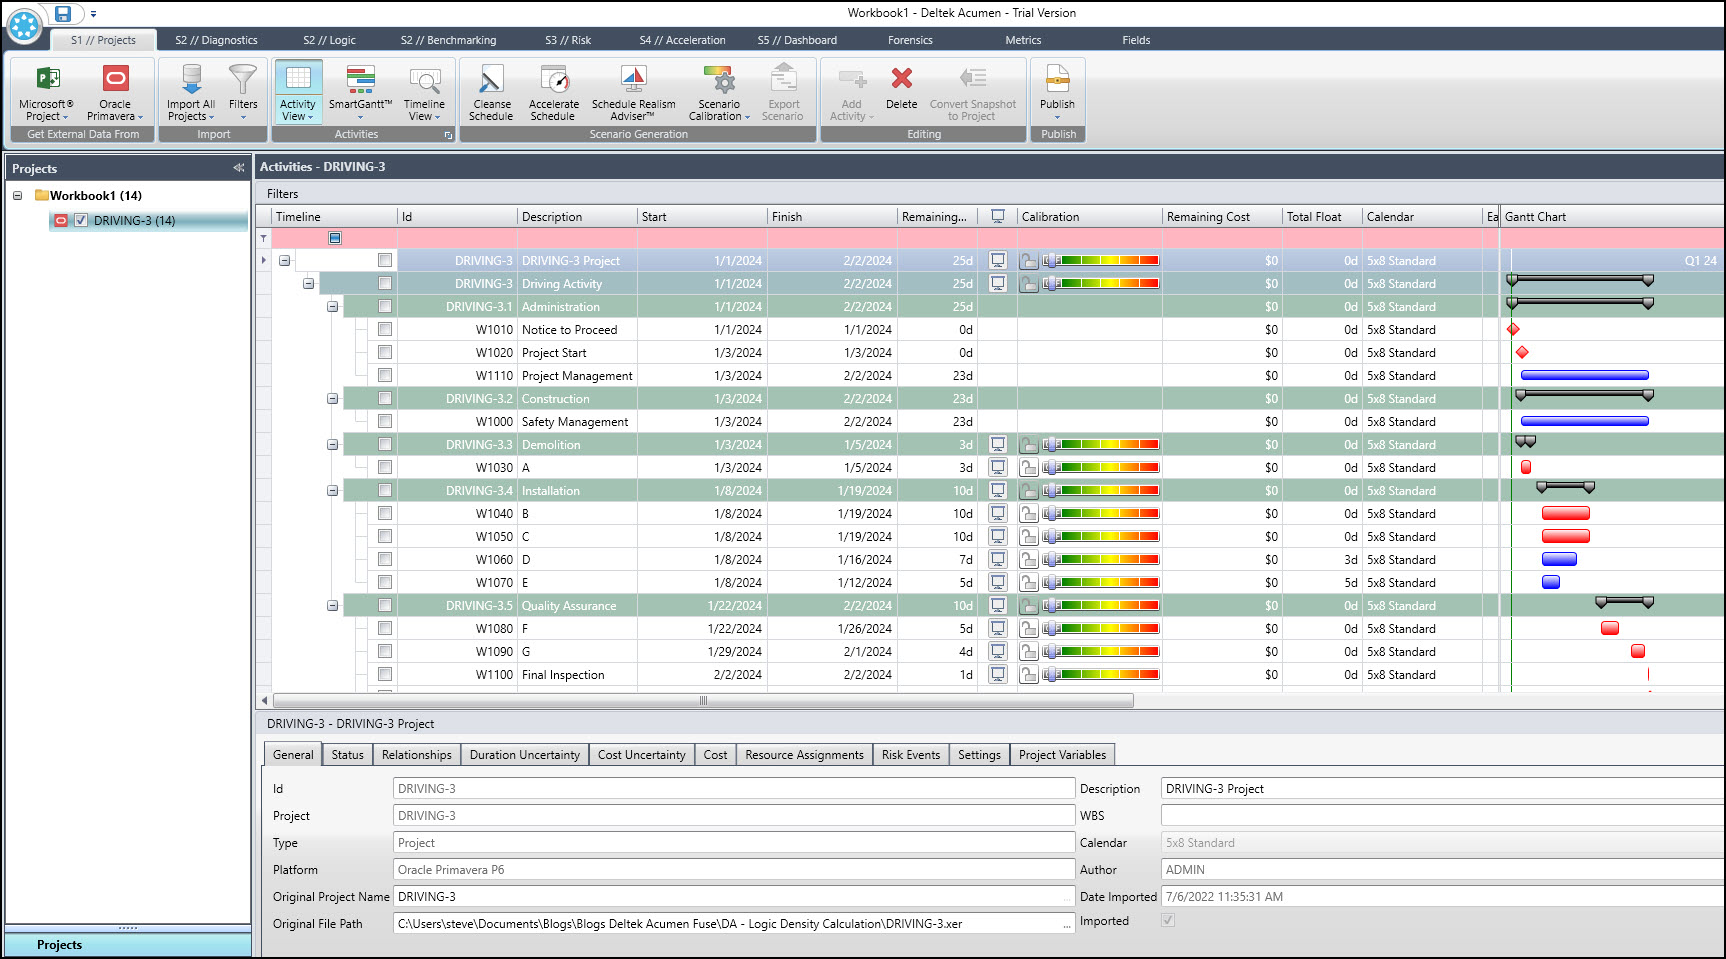 Figure 6
We continue to S2 // Diagnostics and confirm Schedule Quality is the current selection in the bottom playlist then click Fuse in the Analyze ribbon group to perform the analysis, Figure 7.
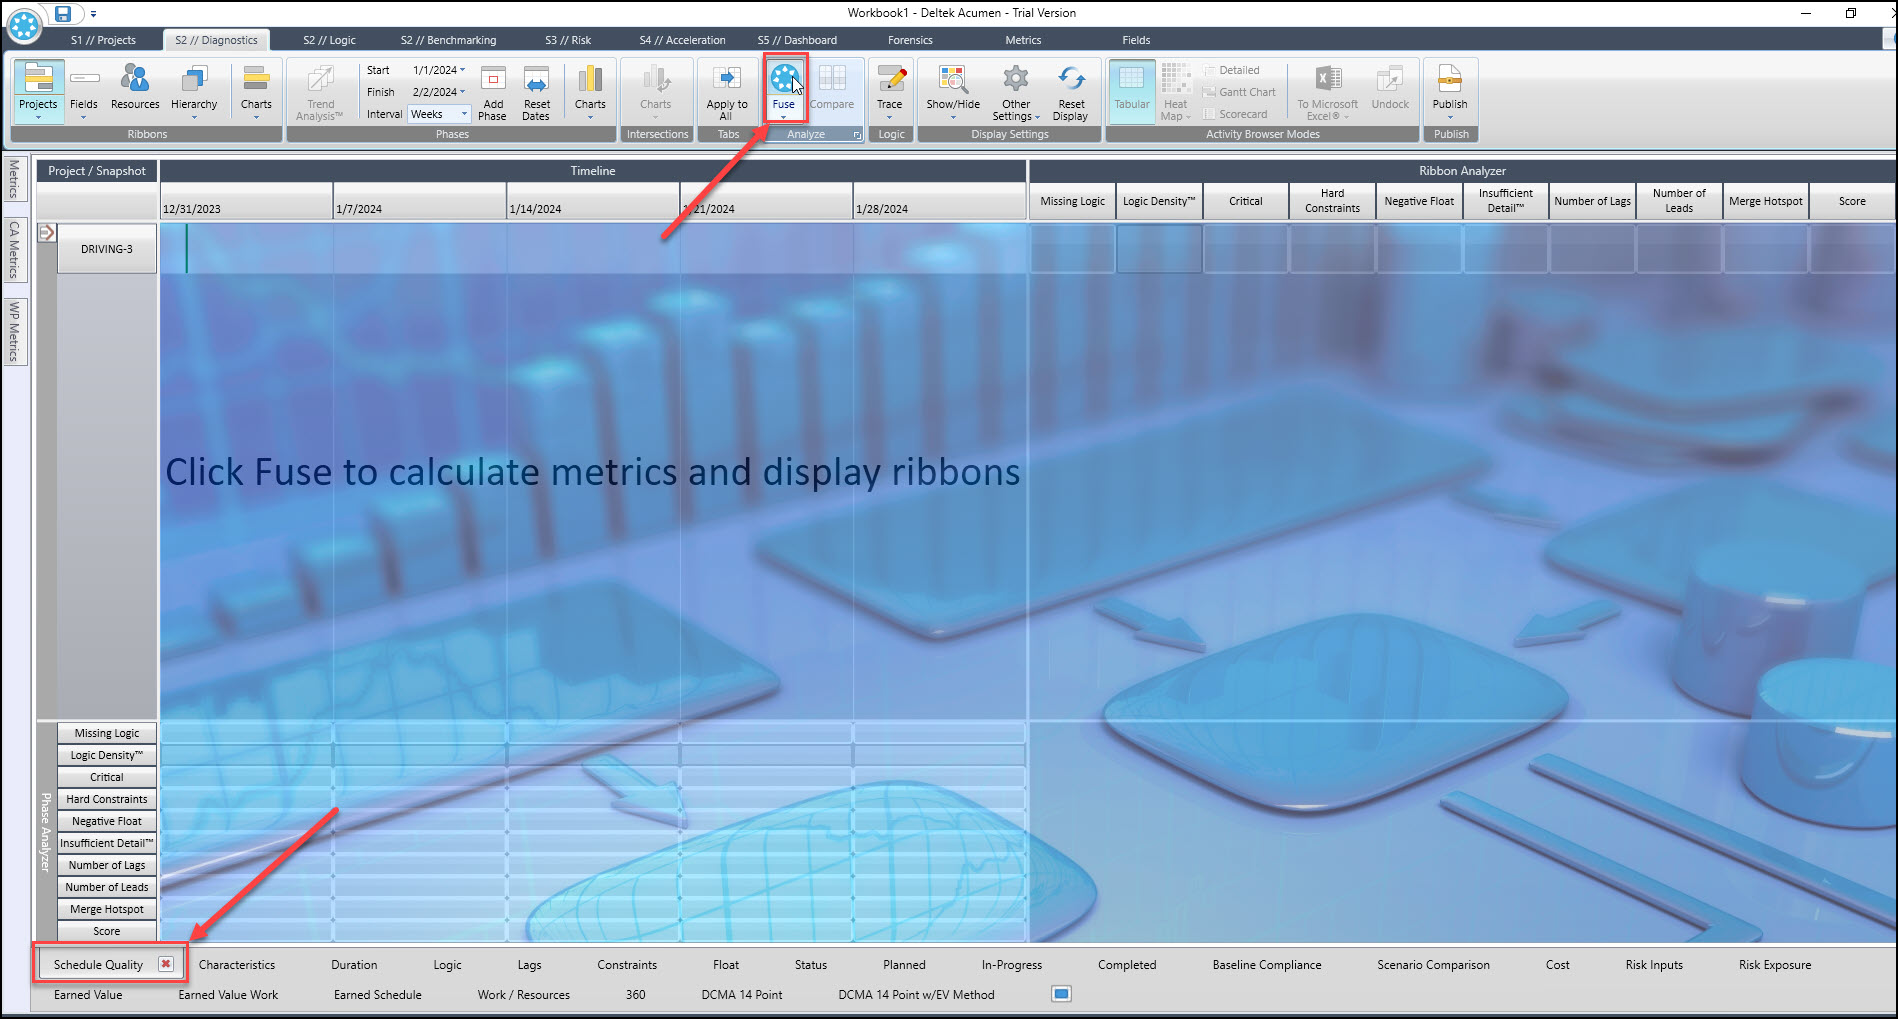 Figure 7
The Schedule Quality metric results appear in Figure 8.
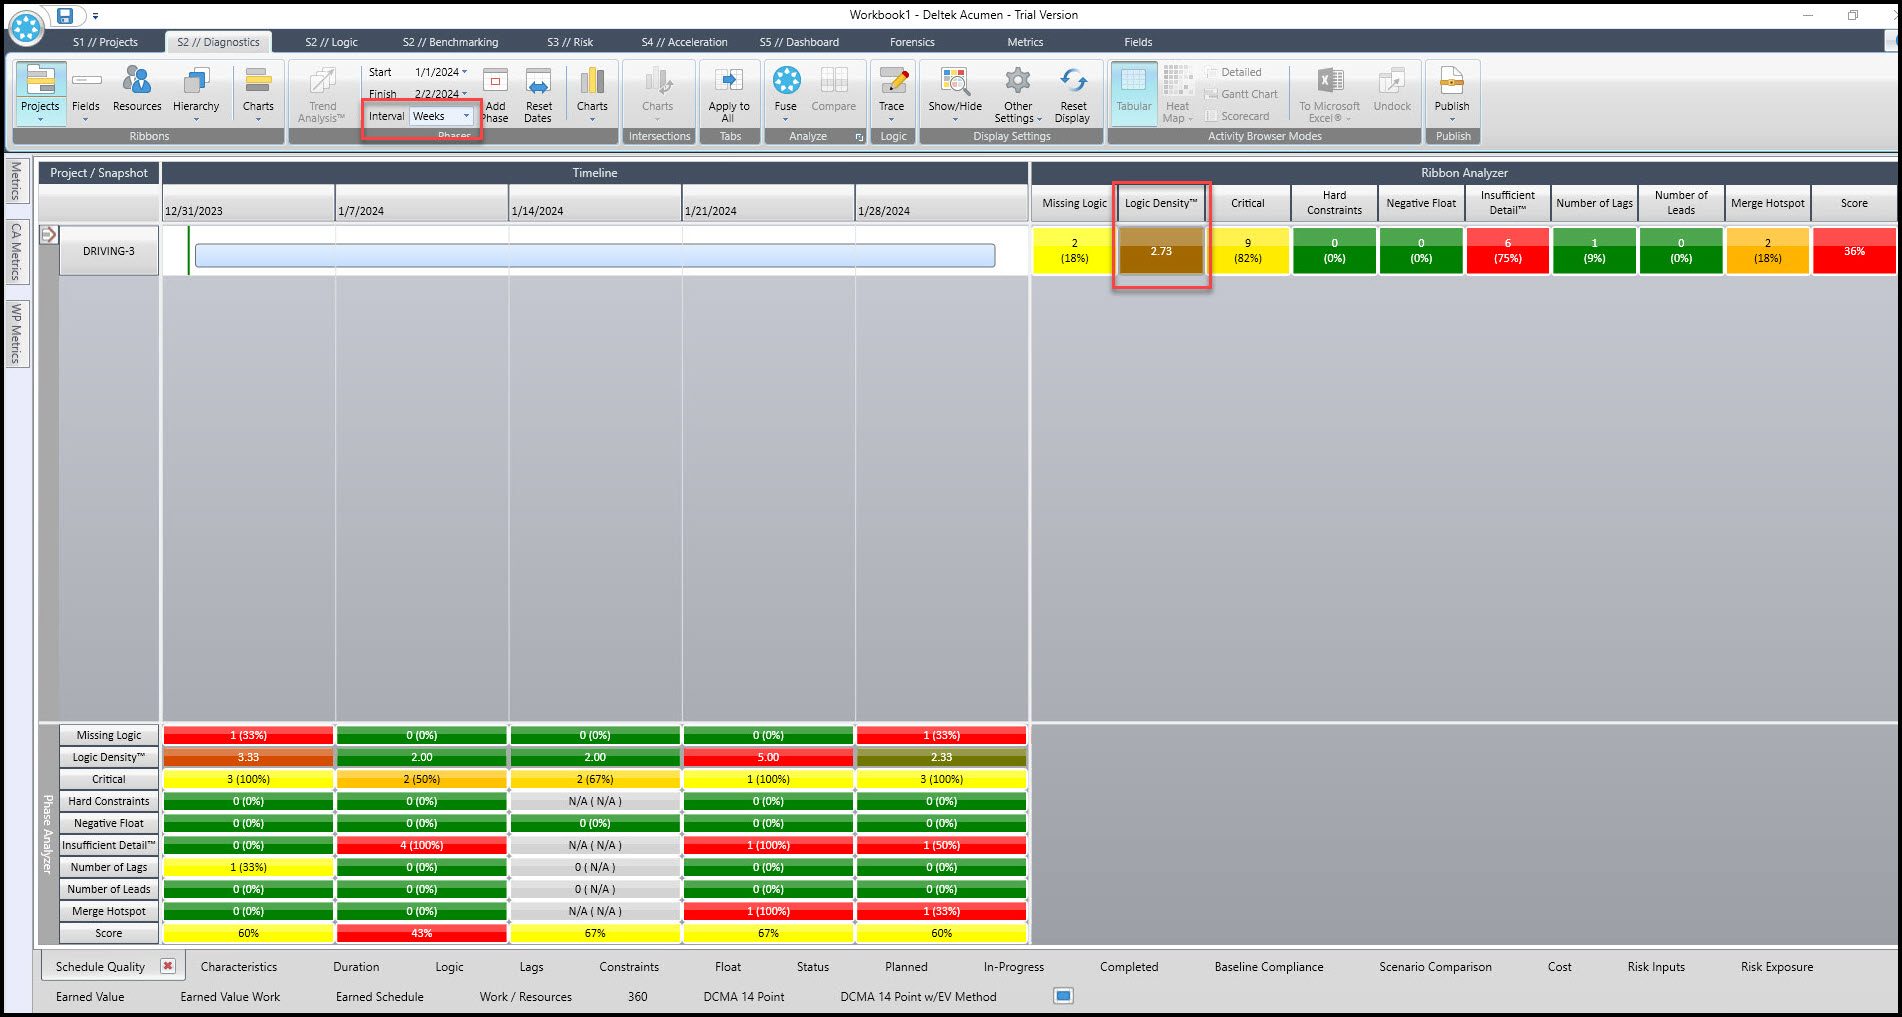 Figure 8
In the upper right are metric results for the life of the project and in the lower right are metric results for each phase in the schedule, which are broken into weekly reports, as the analyses’ current interval is weeks. The Logic Density for the project duration is 2.73, Figure 8, which is agreeable, and indicates neither missing logic nor redundant logic.
We want to further isolate results for the Logic Density metric for each week in the project life. To achieve these results we need to display the intersection analyzer. We proceed and hoover the mouse over the Metrics tab in the upper left corner of the screen, Figure 9.
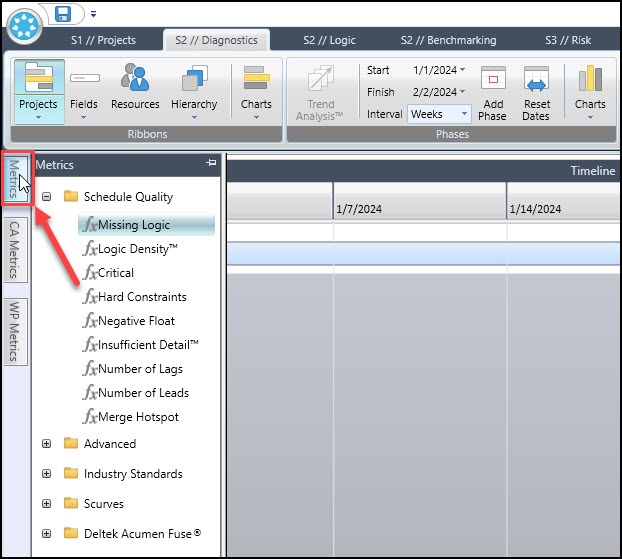 Figure 9
Drill down to the Advanced | Logic | Logic Density metric and right click on it and in the resulting popup menu choose ‘Add to intersection Analyzer’, Figure 10.
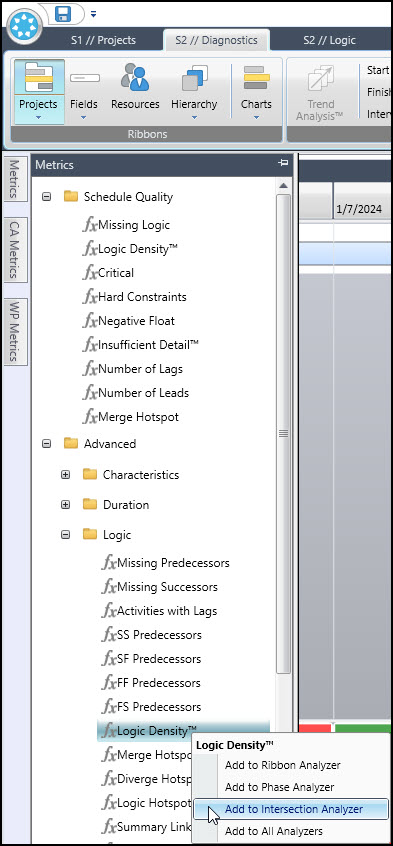 Figure 10
Again, click the Fuse button, Figure 11.
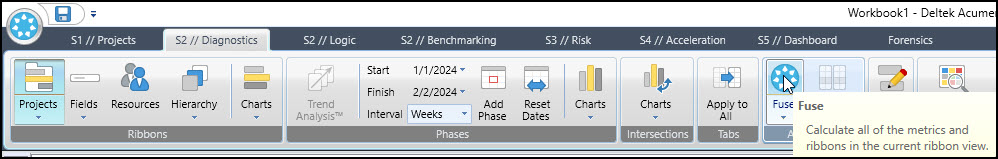 Figure 11
The results for each weekly interval are displayed in Figure 12.
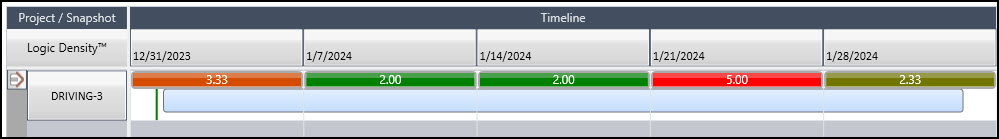 Figure 12
Table 1 – Logic Density Each Week, for our demonstration Driving-3 schedule, tabulates the number of relationships connecting to respective activities, each week, and the number of activities, each week, then lists the Logic Density calculation from these weekly values.
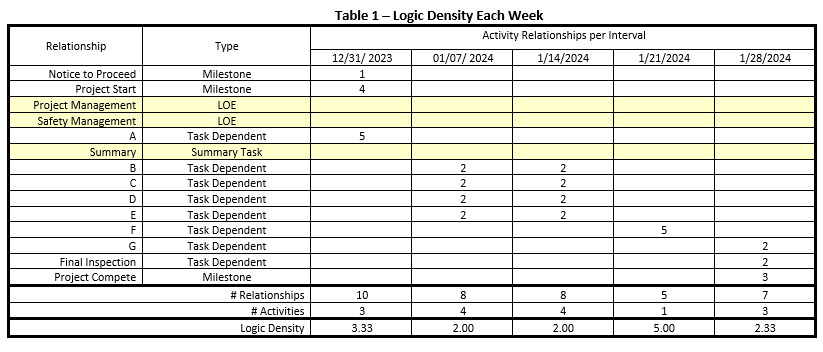 Remember that Summary Task and LOE activities are excluded along with their relationships. Thus, the Project Management, Safety Management, and Summary activities are excluded from the activity and relationship count tabulations, Table 1. However, all relationships associated with Milestone and Task Dependent activities are summed, regardless of the Task Type they connect to.
Reviewing the Logic Density for each interval in the project we find that the Logic Density for the week of January 21st, a value of five, may indicate redundant logic. To investigate we go to S2 // Logic and the Logic Checks ribbon group then click on Redundancy Index, Figure 13.
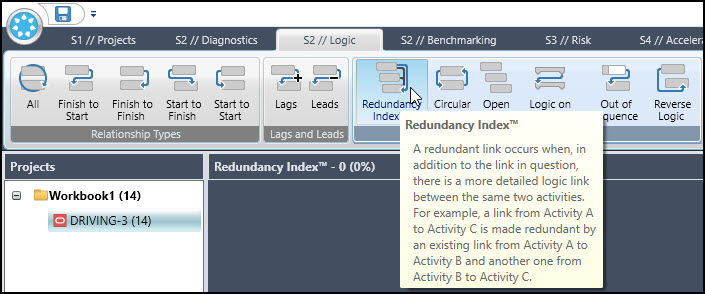 Figure 13
Acumen Fuse reports that there is no redundant logic in the schedule. So, the Logic Density value of five for the week of January 21st was a false warning. And considering that the project Logic Density is 2.73, redundant logic does not appear to be an issue in this schedule.
Summary
The Logic Density metric in Deltek Acumen Fuse is an indicator to warn when a respective activity may have either missing logic or redundant logic. Only milestone and task dependent activities are counted, and only relationships coming from these tasks are included.
Keep in mind that all relationships connecting to milestone and task dependent activities are counted, regardless of the predecessor/successor task the relationship connects to. The logic density metric, thus, is a beacon to warn when a deeper Acumen Fuse investigation of either missing logic or redundant logic is warranted.