Generating Schedule Tornado Plots in Acumen Risk
Dr. Dan Patterson, founder of the Acumen Company subsequently bought by Deltek, says “risk models do not need to be complicated to be meaningful.” This is the intent of tornado plots, so here we take a look at them.
When it comes to risk reporting, the mantra keep it simple is important to remember. Patterson continues “the true key to a successful risk analysis is not the cleverness of the risk model, but the accurate interpretation of the results”. Risk analysis needs to be understood to be relevant. It is therefore imperative that the presentation of the risk analysis be as understandable as possible.
How to Generate Tornado Plots in Acumen Risk
This article demonstrates how to generate tornado plots in Acumen Risk to present an understandable and helpful analysis of key risk drivers.
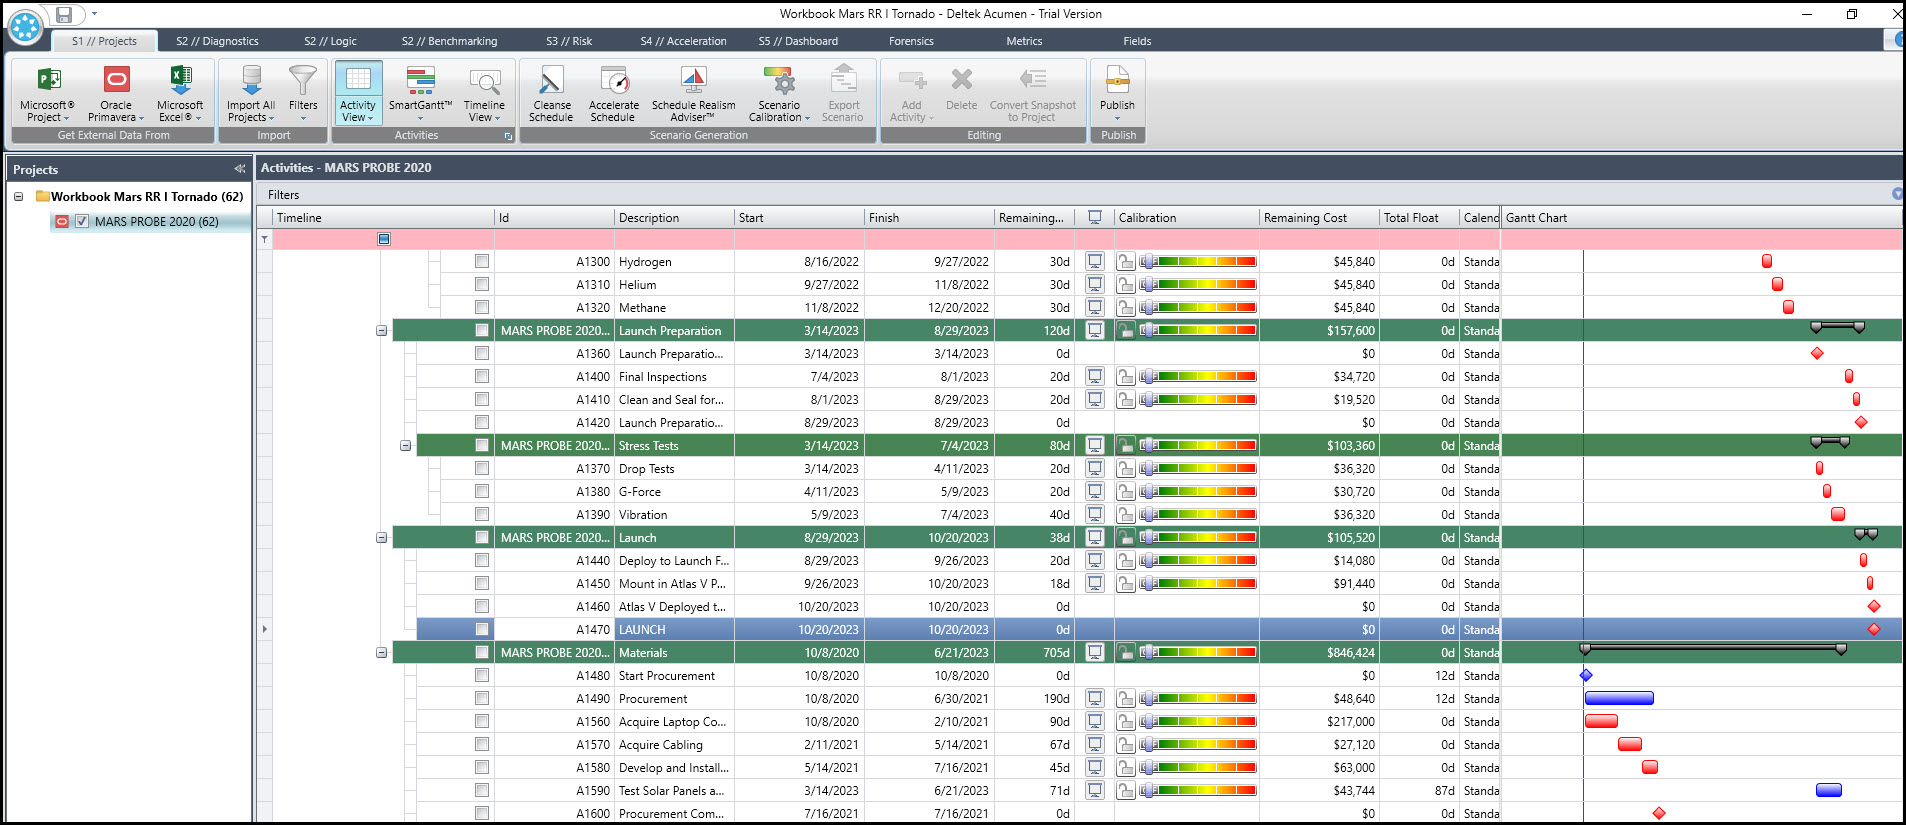
We have in Figure 1 a Primavera P6 project schedule that was imported to Deltek Acumen Risk.
 Figure 1
In Figure 2 we run a schedule quality diagnostic analysis of the schedule.
Figure 2
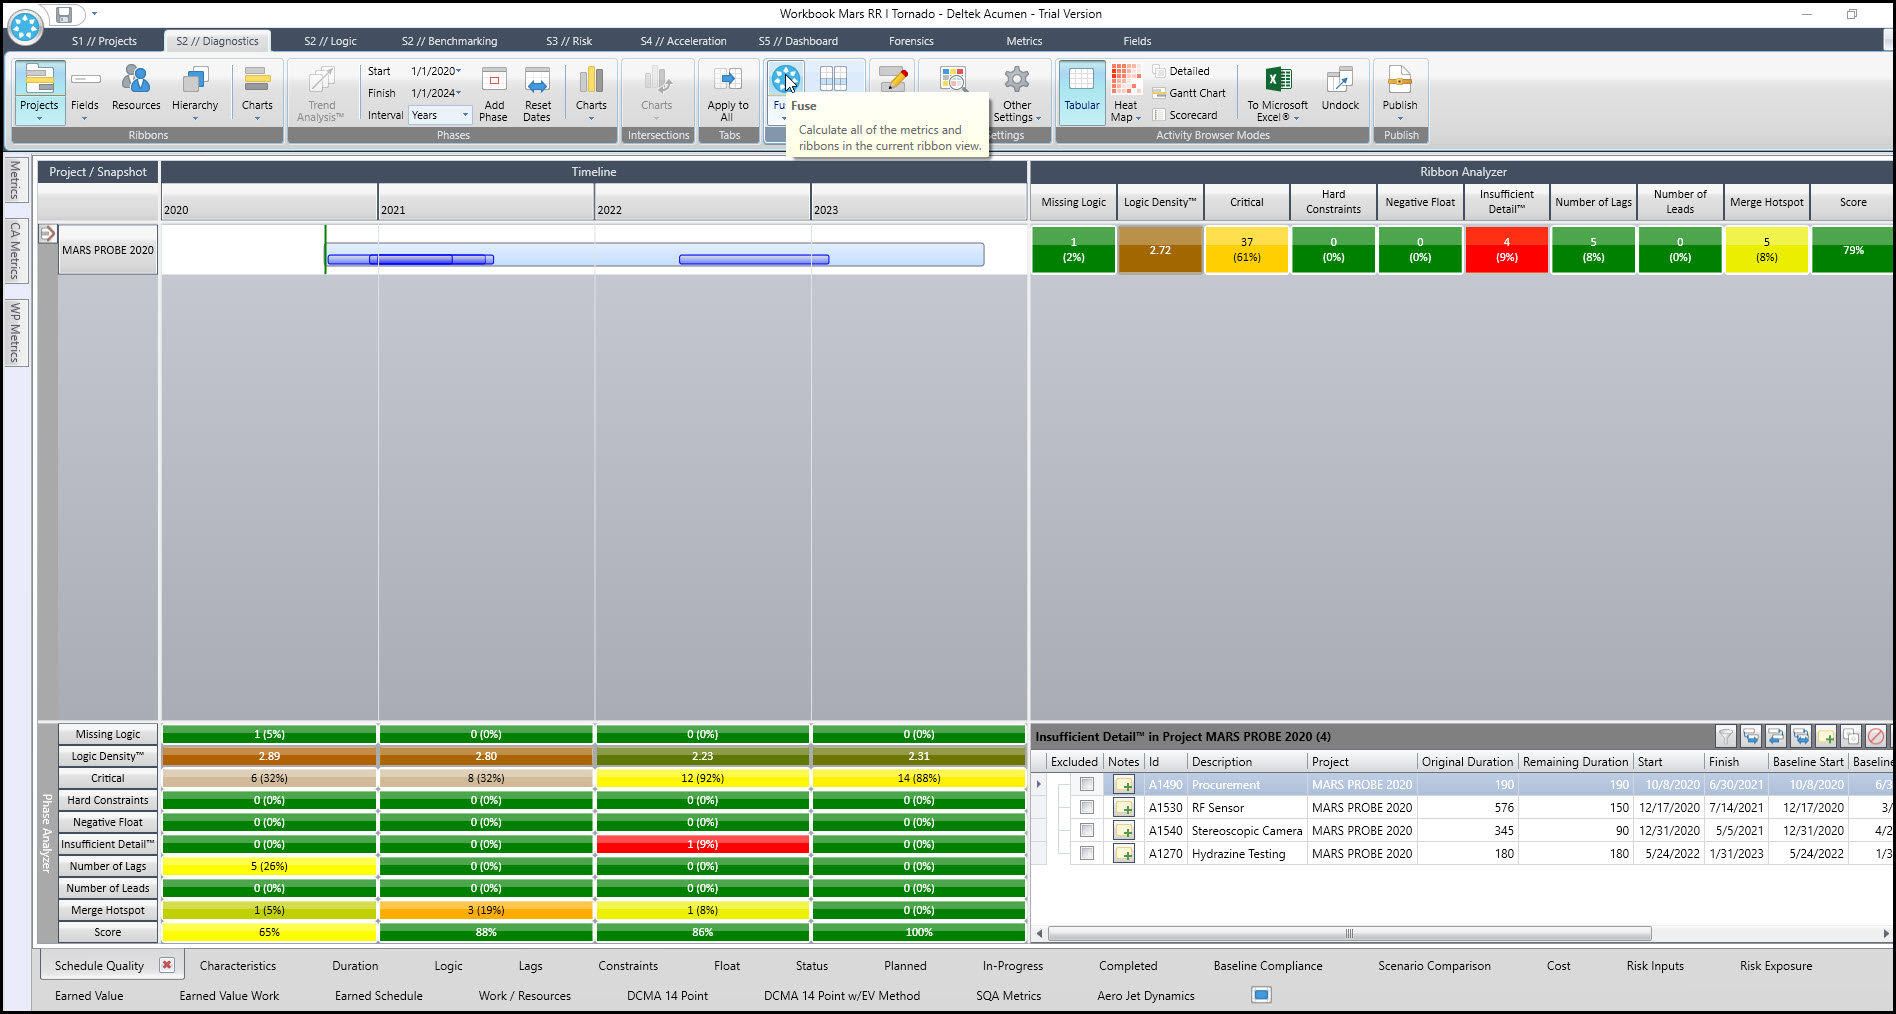
The diagnostic results in Figure 2 indicate that we have four activities with insufficient detail. We ideally would want to investigate shortening the duration of these activities to provide more detail on the effort taking place.
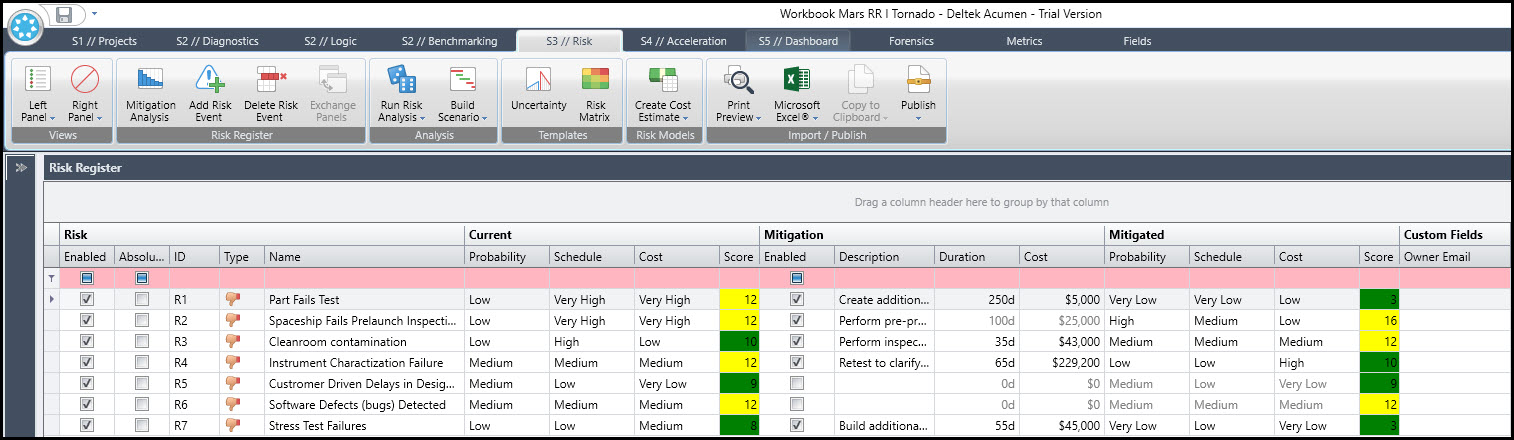
Despite the poor score in insufficient detail the overall score of 79% provides a degree of confidence to proceed with the Monte Carlo risk analysis. In Figure 3 we have our risk register that has several risk events or threats and mitigation efforts.
Figure 3
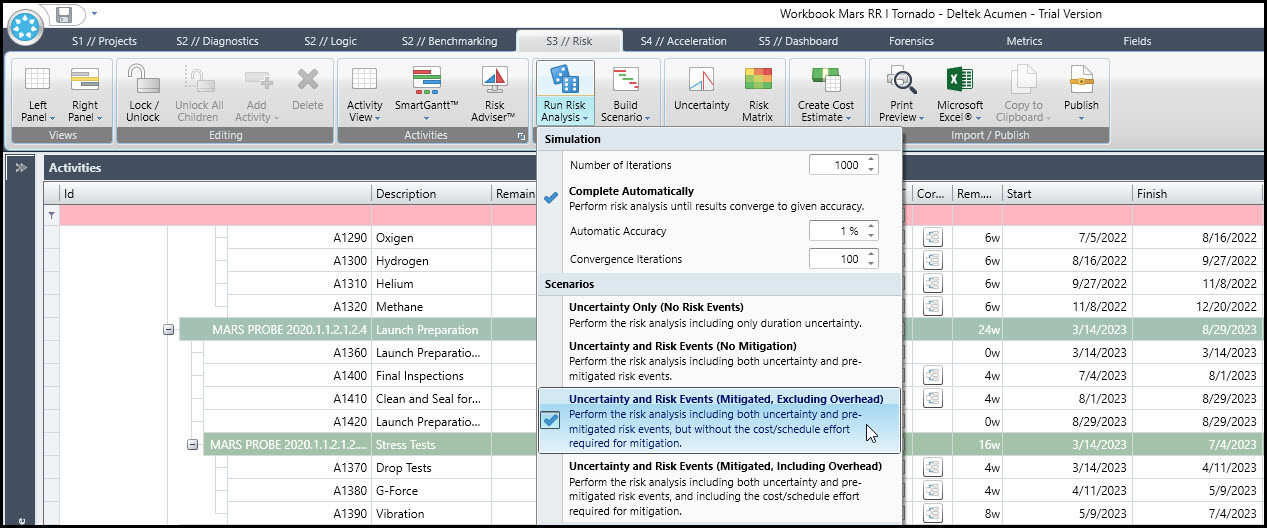
In Figure 4 we set the analysis to consider duration uncertainty, risk events, and mitigation.
Figure 4
In Figure 5 we have our histogram results of the Monte Carlo analysis.
Figure 5
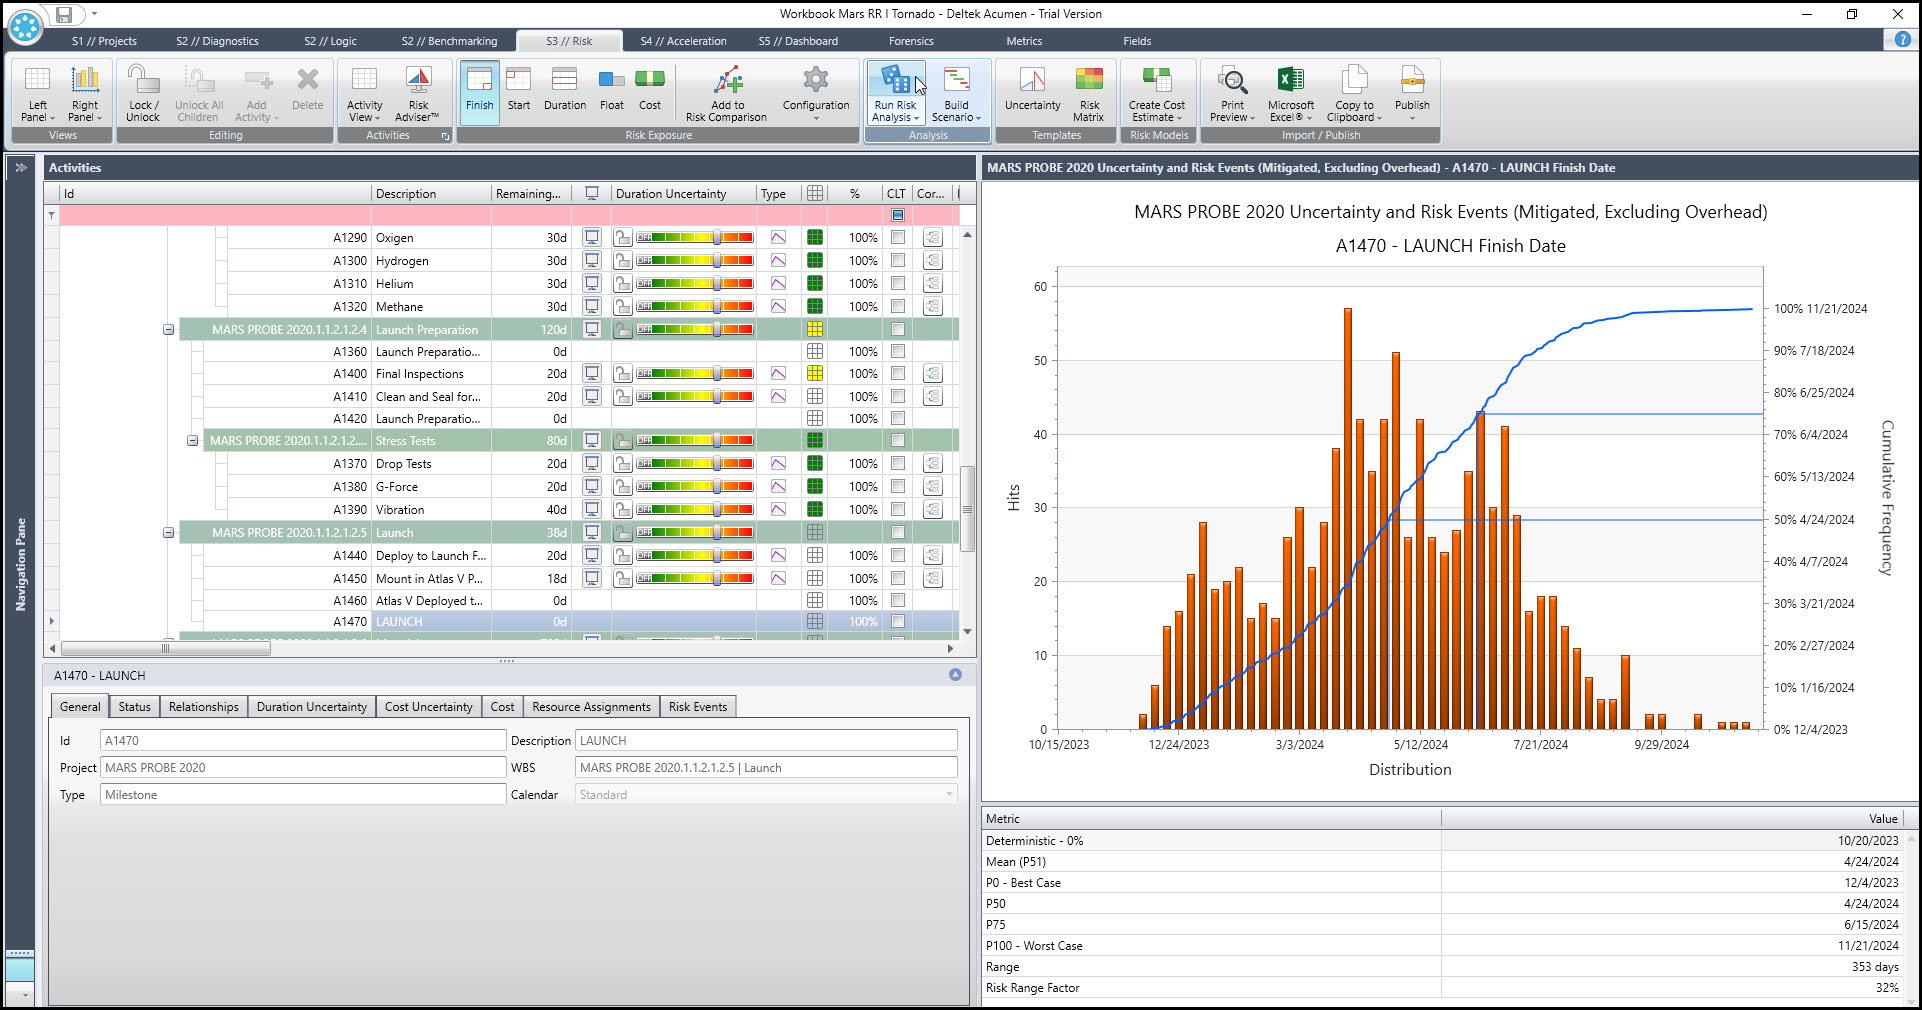
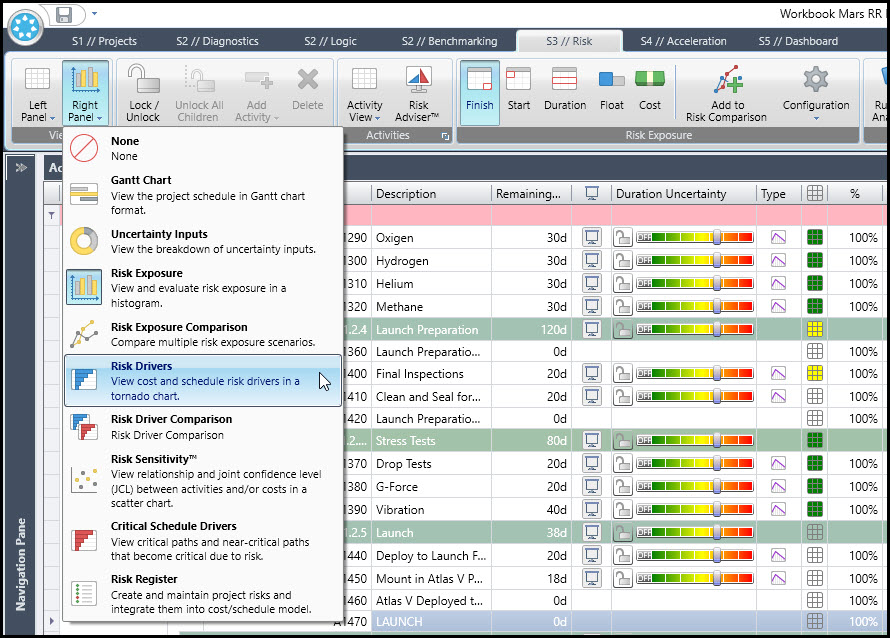
These results are based on an aggressive duration uncertainty, which indicates we expect to miss duration estimates. This histogram provides insightful information about the schedule situation, but we want to generate a tornado plot that prioritizes risk by schedule impact. In Figure 6 we choose right panel | risk drivers to create a tornado plot.
Figure 6
In Figure 7 we have our tornado plot.
Figure 7
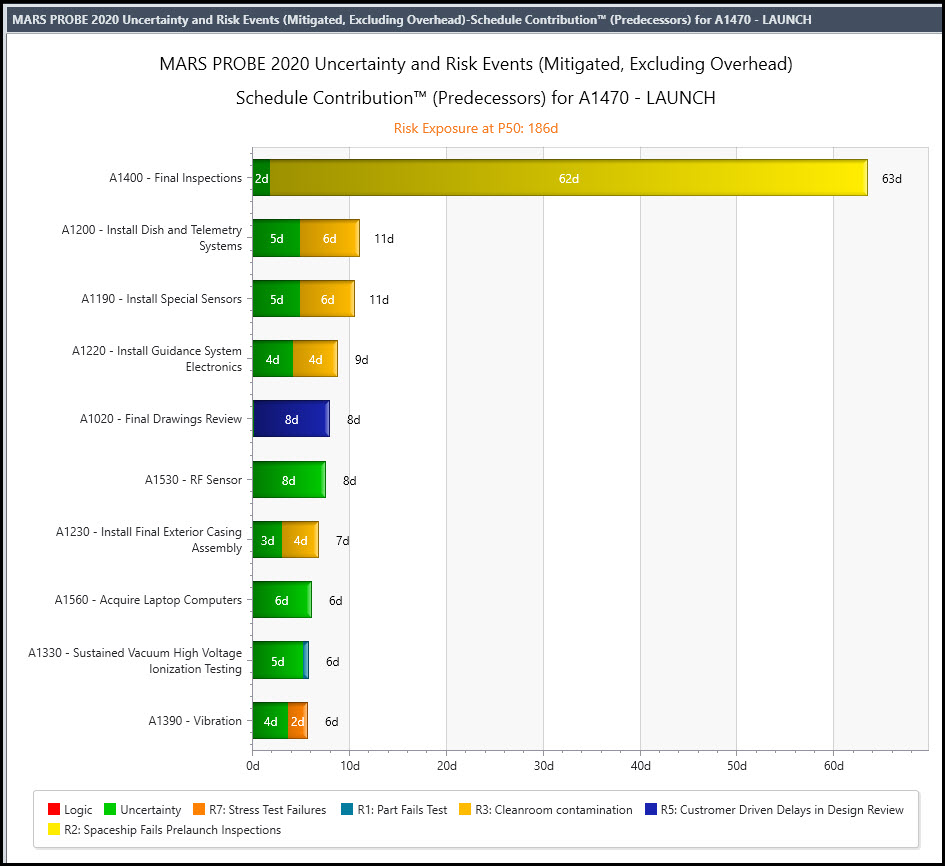
As expected the aggressive duration uncertainty lengthens the durations of the respective activities. The major risk is final inspections, which makes sense. We have several efforts coming together at final inspections. Any one of these efforts could delay final inspections. The tornado plots clearly displays the impact of duration uncertainty and risk events. From this plot we find that increasing duration accuracy would not have a significant effect on the schedule outcome. Instead we should focus our attention on risk events, and, in particular the final inspections risk event.
Summary
Tornado plots in Acumen Risk are a way to prioritize activities that could easily delay the project schedule. Deltek Acumen Risk displays the impact of duration uncertainty and respective risk events. In this way, tornado plots in Acumen Risk provides a helpful plot displaying the major causes of potential activity delays.