 Variance analysis is part of earned value management analysis and a way of gaining data for decision-making. A variance is simply a difference between what was planned and what actually happened.
As you can imagine, very few projects deliver exactly to plan – have you ever worked on one where the original project schedule baseline and original cost baseline were met exactly? Given that we don’t have crystal balls as project managers, it’s unlikely that any project is going to proceed perfectly to plan, so variance is normal and expected.
Different types of variance
There are two main types of variance considered in projects using earned value analysis:
- Schedule variance (SV)
- Cost variance (CV).
Both of these help the project management team learn about performance in a data-driven way, taking out the ‘best guesses’ and gut feelings about how the project is going. SV and CV provide data to help project leaders make the best choices about what needs to happen next and what project performance might look like in the future.
How to work out variances
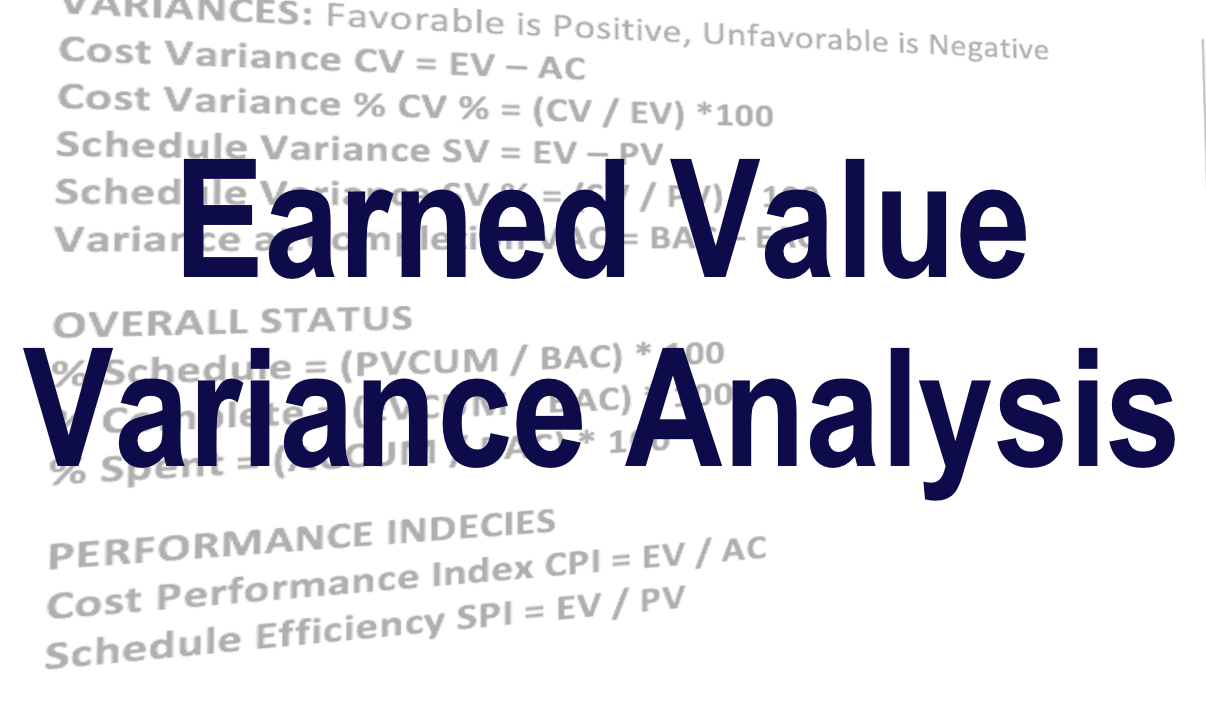
The earned value variance analysis calculations are pretty easy. Schedule variance is calculated by comparing the actual work against the planned work, or, to use earned value terminology, it’s earned value minus planned value (PV).
Cost variance is worked out in the same way. Compare what you planned to spend (the planned cost) with what was actually spent and the variance is the difference between the two. In earned value terms, that’s earned value minus actual cost.
The time period for the calculations can make a difference to the results, so make sure everyone is clear on what time period the SV and/or CV is being calculated for. The calculation is valid for a given point, but it’s time-driven data so it’s important the dates are taken into consideration for the analysis. That also makes it easier to compare project status from month to month.
Fortunately, project leaders don’t have to do a lot of manually project performance calculations to find out the variance. Variance reporting in Primavera P6 Professional can do all the heavy lifting for you, taking the data sources and presenting the team with the project performance information you need to make smart choices about what corrective action might be required.
Read next: How to write a good variance analysis
What the variances mean
A positive variance is normally a good thing, although not always – it’s context dependent.
A positive schedule variance means more work was done that you had planned to do, so theoretically the team is working at a higher velocity and tasks are being completed faster than expected. It’s always worth understanding the context because this result could also mean that the estimates were poor at the beginning, or that someone worked a lot of unpaid, untracked overtime and they may not be prepared to continue doing so as the project progresses.
Unsurprisingly, a negative schedule variance means less work was done than planned.
A positive cost variance means the actual costs are lower than what was expected given the value of the work completed. Again, that might sound good as a headline on a report, but it is worth digging in to the reason behind the numbers. Perhaps the procurement team got a great deal on equipment, or perhaps less work was carried out than planned so the money didn’t need to be spent.
It’s no surprise to learn that a negative cost variance means that costs incurred were higher for the period than planned costs.
As you can see, there is a relationship between SV and CV that together provide useful information about how the project is going.
The Variance Analysis Report
Your earned value management system may produce variance analysis reports, or the project manager may have to take the data and create the reports themselves, merging the variance information with other, contextual data and root cause analysis to present the whole picture.
A report typically includes:
- Some basic header information such as the date, project or program name, the control account or work package that the report relates to, and the name of the project manager, control account manager or other key resources.
- The variances themselves, normally laid out in a table or another format that’s easy to understand at a glance, sometimes simply copied and pasted from your earned value management system if that gives you what you need.
- A narrative description that explains the data.
The variances themselves aren’t that helpful alone. It’s interesting to know that last month’s project progress was not as good as expected, but you can’t change the past. Therefore, it’s important to know what to do with the earned value variance analysis information.
What to do with earned value variance analysis information
Once you have the earned value variances, the project team can start to analyze the data. What caused the difference? Do you know the root cause? Is that likely to be the same next month? If not, why not? What will be different?
If nothing will be different – if the project performance will not correct itself or if there are not already corrective actions in place – it may be prudent to assess estimates, staffing levels, and other root causes to understand how and why project performance played out the way it did. We have some tips to help you identify the primary drivers of variances.
Once that information is known, you can create a corrective action plan to manage project performance to a level which is more in line with the plan, putting forward any changes required to bring the project back to a controlled performance level.
Project control relies on earned value management variance analysis so if this is a critical area of your project performance management, we would recommend getting some EVMS variance analysis training to support your teams in understanding this complex area.