In Primavera P6, it is possible to easily display both the free float and total float of activities on the activities table. However, displaying free float and total float on the Gantt Chart bars in Primavera P6 makes it significantly easier to perceive how much flexibility an activity really has. Here we step through the process of creating free float and total float Gantt Chart bars in Primavera P6.
Total float is the amount of time an activity can be delayed without prolonging the entire schedule. Free float is not as common in vernacular, but free float, never-the-less, is simply the amount of time an activity can be postponed without delaying a successor activity. Both total float and free float provide insight into the schedule situation. It is also handy to display both on the Gantt Chart.
This article provides step by step instructions on displaying total float and free float on the Gantt Chart bars in Primavera P6. We begin with our demonstration project, Figure 1.
 Figure 1
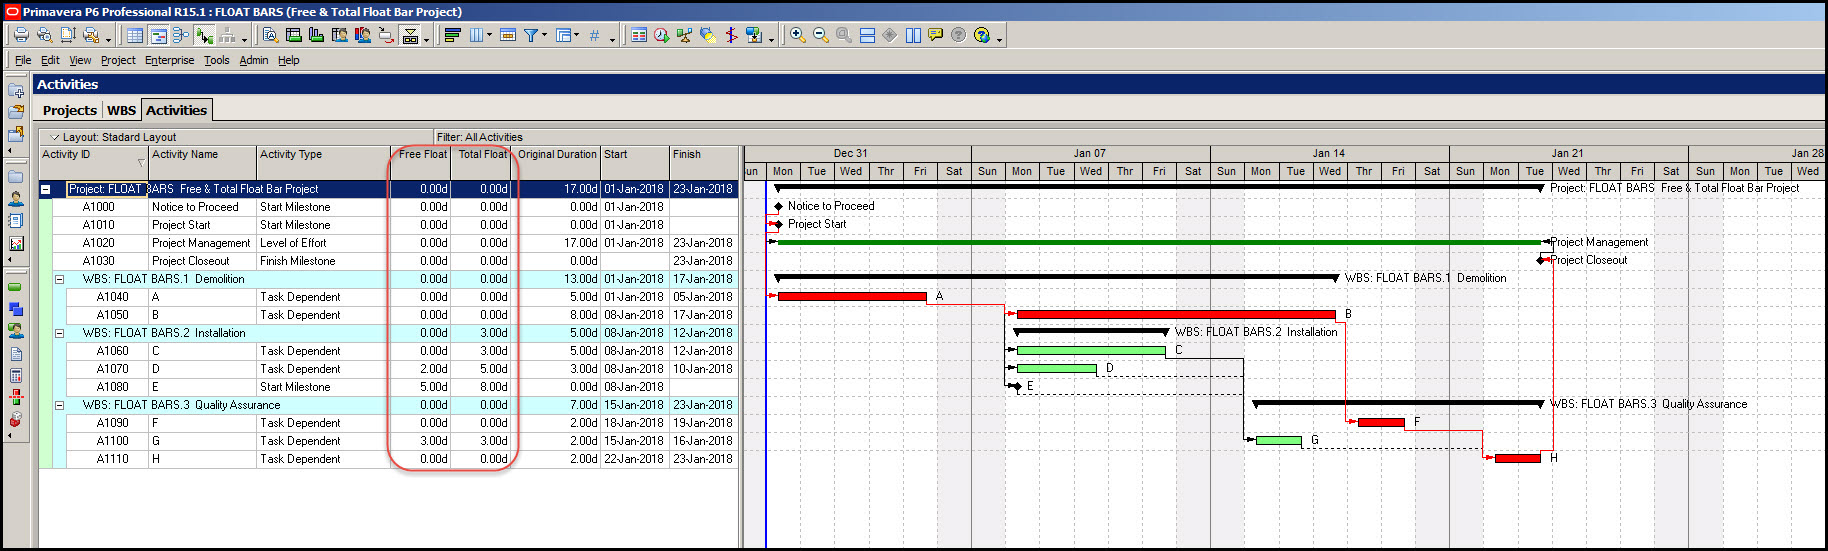
The activities table in this demonstration displays free float and total float. The Gantt Chart, however, does not. Yes, it would provide us a better overall perspective of the schedule, if we display Gantt Chart bars for free float and total float. Displaying float bars on the Gantt Chart is a three step process: create User Defined Fields (UDF), create global change routines, and create the associated Gantt Chart bars in Primavera P6.
Step One
We begin by creating UDFs for both the free float and total float, as shown in Figure 2.
Figure 2
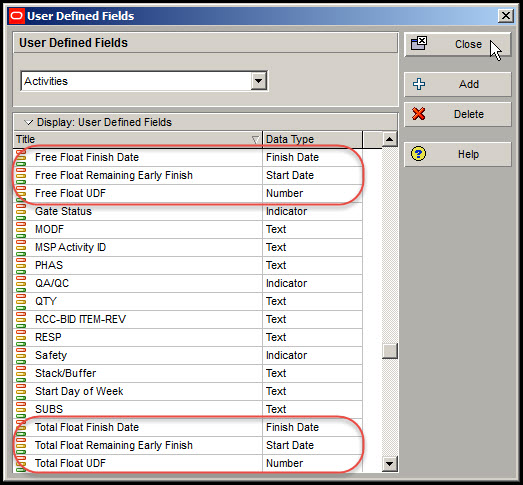
Make sure you use the appropriate data type for the respective UDF. Note that ‘Free Float Remaining Early Finish’ and/or ‘Total Float Remaining Early Finish’ are the start dates of the float bars. It also is the early finish of the associated activity.
Step Two
In step two we create a global change routine to generate the start and finish date values for the Gantt Chart float bars definitions, Figure 3.
Figure 3
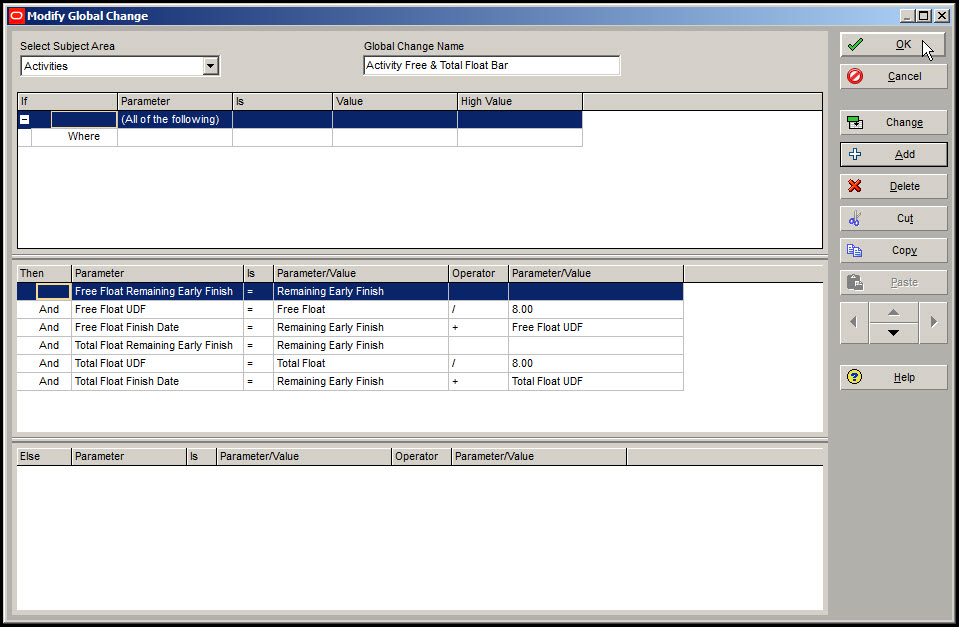
Note that this global change routine is relevant for all activities. ‘Free Float Remaining Early Finish’ is assigned ‘Remaining Early Finish’. We also make ‘Total Float Remaining Early Finish’ equal to ‘Remaining Early Finish’. Free float is divided by 8 and total float is divided by 8.
This is done because we are implementing an 8-hour a day five weekday calendar, where every eight hour period of our schedule calendar is considered 1-day. This 8-hour period is noted in the Hours/Day field of the Hours per Time Period dialog, Figure 4.
Figure 4
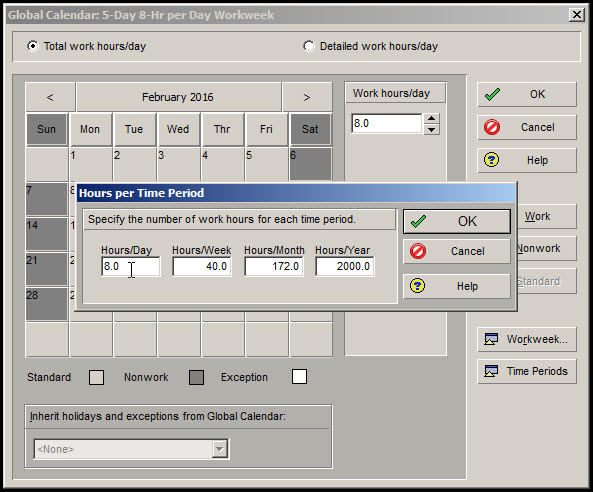
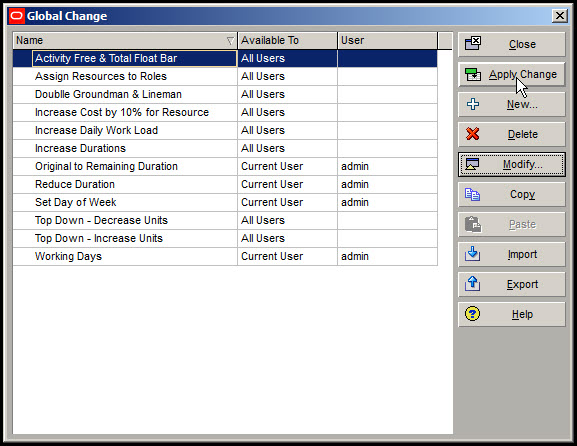
Had our calendar been a 10-hour a day four weekday calendar and our Hours/Day field been 10-hours than we would divide the float by 10. We compute the float Gantt Chart bar finish dates by adding the respective float to the remaining early finish of the associated activity, Figure 3. Click OK and then Apply Change, Figure 5, to compute the start and finish dates of the Gantt Chart float bars.
Figure 5
Step Three
Our last major step is to create the Gantt Chart bar definitions for both the free float bars and total float bars, Figure 6.
Figure 6
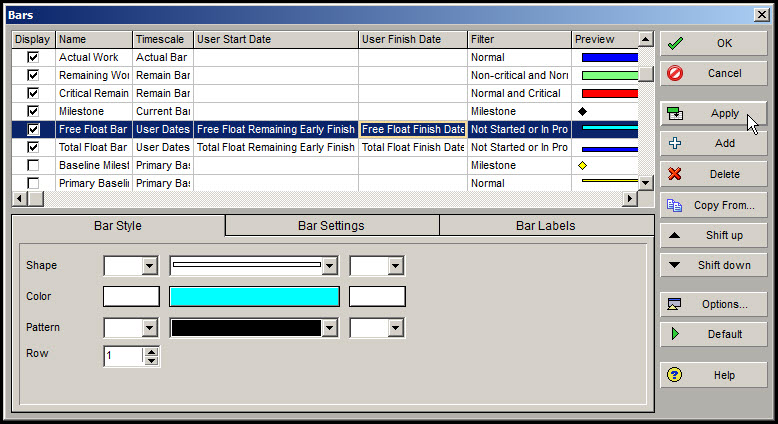
Name the bars ‘Free Float Bar’ and ‘Total Float Bar’, Figure 6. Select User Dates for the timescale of each bar. In the user start date column choose the respective float remaining early finish variables. Enter the appropriate float finish date in the user finish date column. Set the filter to ‘Not Started’ or ‘In Progress’, Figure 7.
Figure 7
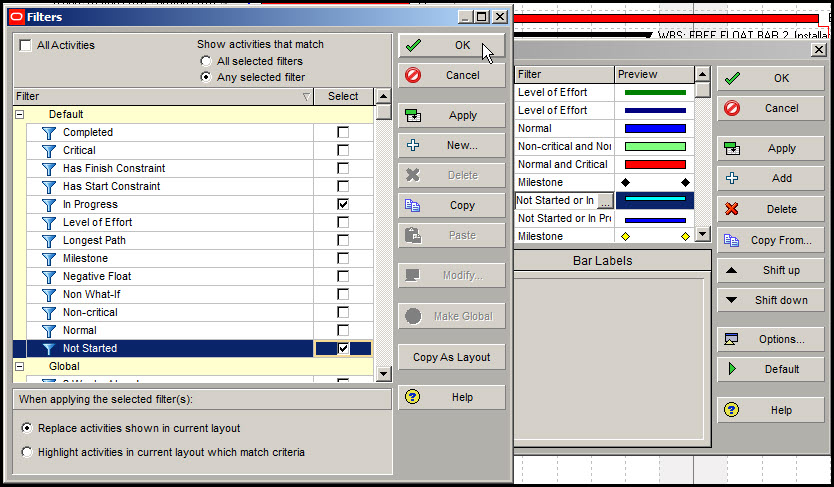
This filtering will capture all normal activities and milestones. It excludes level of effort activities, as they have no float. It also omits completed activities, which also have no float.
Finally, select a preferred Gantt Chart bar color and shape for each float bar. Make the shape of each float bar thin. Also, select a bar style shape to ensure that the float bars are not overlaid on top of each other; we want both bars to be visible for the same activity and time period.
Click apply in the Bars dialog, and our demonstration schedule is as displayed in Figure 8.
Figure 8
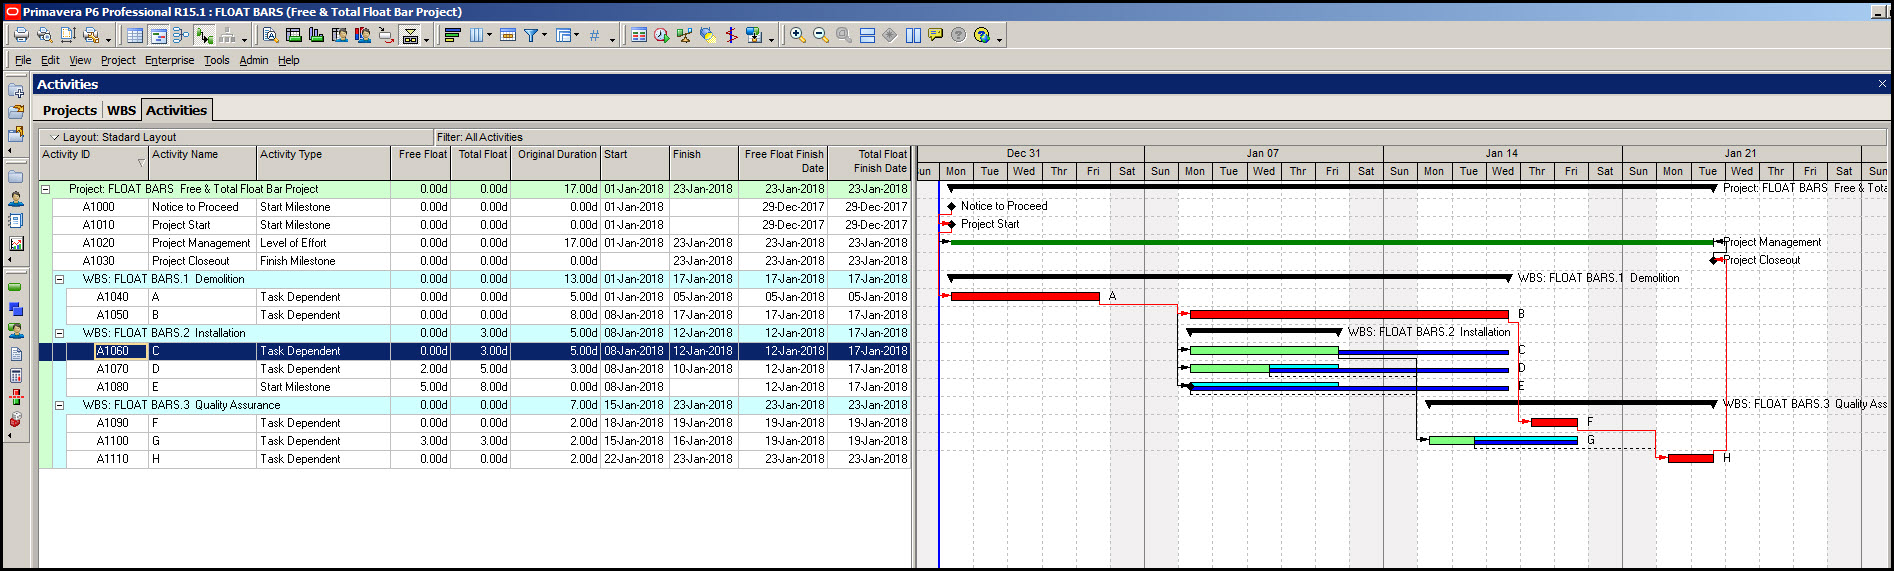
Note that the light blue bars show the free float and the dark blue bars the total float. Activity C has only total float. Whereas, activities D, E, and G all have both free and total float. The milestone E has the most flexibility both in free float and total float.
This milestone can be delayed 5-days without affecting the start date of its successor. It can also be postponed 8-days without causing a project delay. As you can see from the Gantt Chart displaying free float and total float Gantt Chart bars in P6 makes it much easier to analyze activity flexibility.
Summary
The three step process to display free float and/ or total float on the Gantt Chart bars in P6 is well worth the effort. The Gantt Chart float bars make analysis and comparison of activity flexibility significantly more insightful. Note, however, if your activity original durations have changed and your schedule recalculated you will need to recalculate your global change routine.
You may be aware that the Bars dialog has a ‘Float Bar’ Timescale. This refers to total float and can be used to create a total float Gantt Chart bar without having to enter a user start date and user end date. Refer to the blog for this approach Primavera P6 – Displaying Total Float of Activities on the Gantt Chart
This float Timescale technique was not used in our current demonstration primarily because the total float bar associated with a start milestone would then complete at the Start Of Business (SOB) day and not the Close Of Business (COB) the previous day.
This is a nuance, but, never-the-less, for conformity it is recommended you use a similar technique for creation of free float and total float Gantt Chart bars. Note also that there is no Bars Timescale ‘Free Float Bar’, so our three step process is essential for displaying the free float Gantt Chart bar.