Deltek Acumen Risk allows you to enter a list of risks against your project using two primary methods, namely Risk Events and Duration Uncertainty. In this article we will we enter a risk event in to the Acumen Risk Register.
The Acumen Risk Register
When you ready to enter risks into your project and have also run your schedule through the Schedule Quality analysis process in Acumen Risk, you have a couple of ways to enter a risk event into the Acumen Risk Register.
The simplest method is to enter a risk event directly into Acumen Risk using the Risk Register tool. Entries into this register are referred to as risk events. Here’s how to enter a risk event.
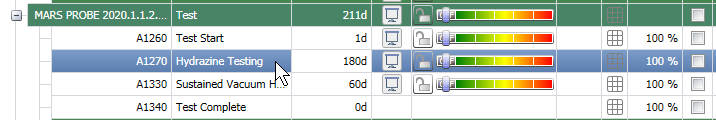
In the S3 // Risks tab, drill down into your project structure to locate the specific activities or group of summary activities that will be affected by the risk event. In this example we will choose the Hydrazine Testing activity.
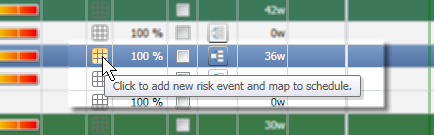
To add a risk event, we use the hatch icon to the right. Hovering over this will give us the following prompt:
In the right half of the screen the Risk Register will open.
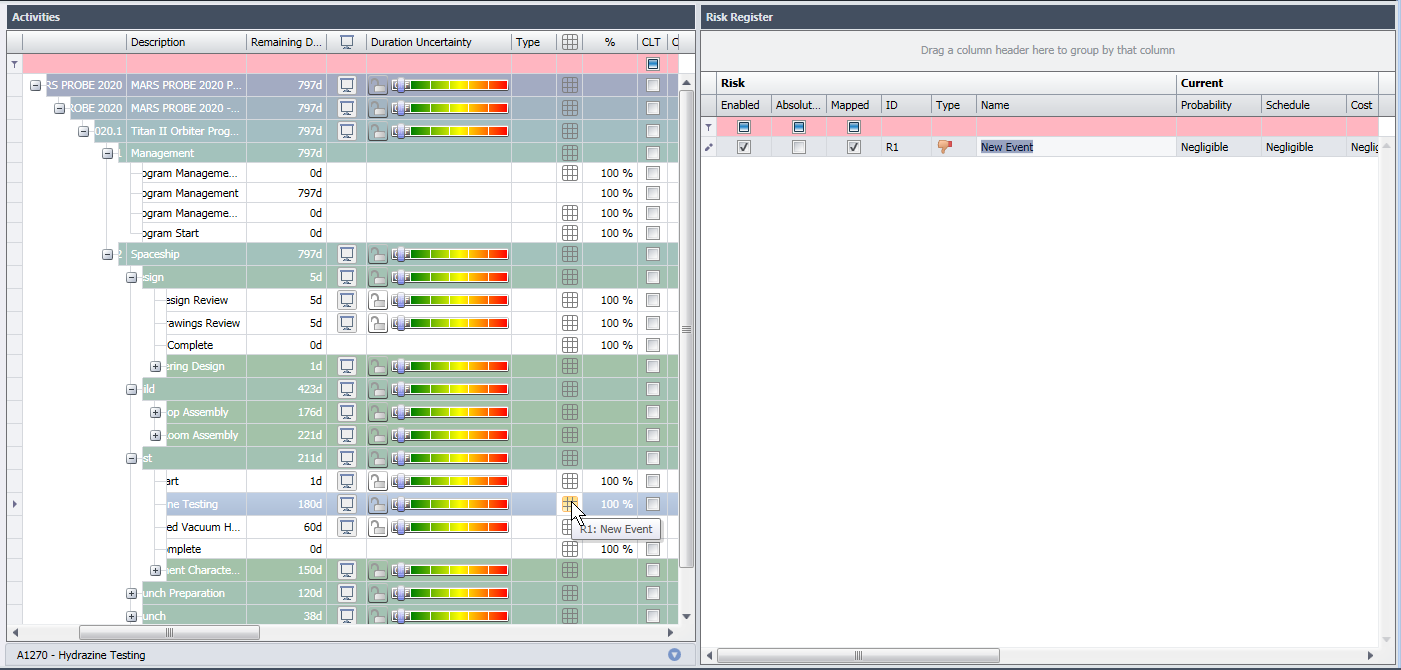
You can now enter a name for the risk. In this example we want to highlight the possibility that parts could be damaged by the Hydrazine.
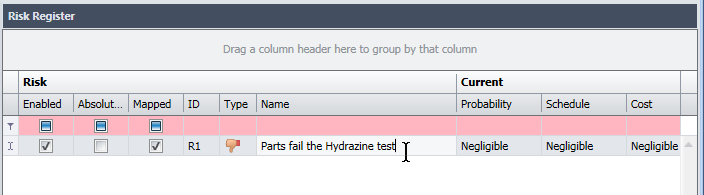
Next you enter the Probability, Schedule and Cost fields to give Acumen a range in which to work when you run the Risk Analysis process.
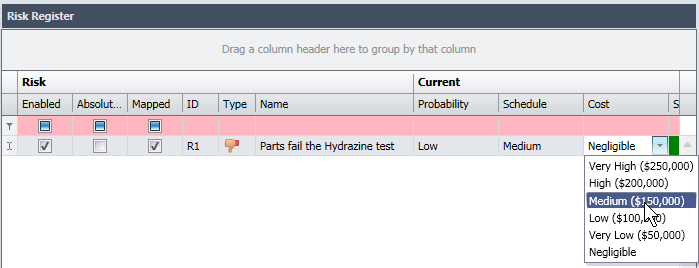
In this example we have selected a ‘Low (10% – 25%)’ probability that the parts will fail the test. Should this occur, the impact on the schedule is considered ‘Medium (60d)’ delay potential, and a ‘Medium ($150,000) cost impact. This is how you inform Acumen Risk the “Loss multiplied by Likelihood” potential for a risk that will in turn control how the duration of the activity is treated by the various iterations of the Monte Carlo risk analysis process that will be performed on this activity.
Risk Mitigation
To complete the risk picture for this event, you can also enter your plan for mitigation to help offset the impact of the risk. This is an optional step because not all risks can be mitigated. For example, a customer sign off delay is a risk to the completion of some activities. However, if they delay in giving you sign off, there isn’t much you can do about it except put it in your monthly report and explain the variance. Whereas you could mitigate equipment failure by having redundant additional equipment standing by. It will cost you, but it will save you days of lost productivity while the failed equipment is repaired or replaced.
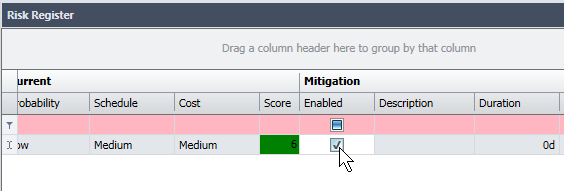
The first step here is to check the Enabled option in the Mitigation section of the tool.
You can then enter the Description, Duration, and Cost of the activity as it would be if the mitigation is executed. In this case the plan is to order additional redundant parts and to record the duration of the activity post mitigation and the likely cost. In this case we’ve set the duration to the current duration for the activity, as mitigation will not shorten the test. However the extra parts will cost more.
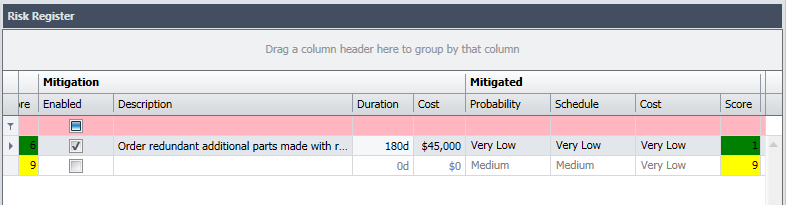
The final step is to enter the mitigated Probability, Schedule, and Cost assuming the mitigation plan is put in place. This may entail additional cost that would be financed from Management Reserve.
Assigning a Risk Event to Other Activities
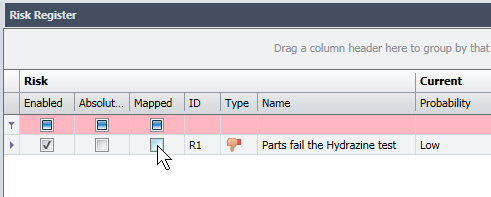
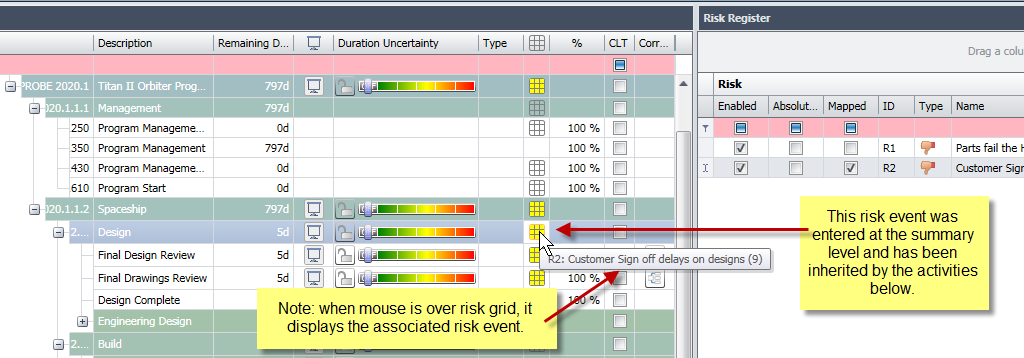
You can assign a risk event to other activities by selecting them in the Gantt chart area, and then clicking the ‘Mapped’ option against the appropriate risk.
You can also add risk event to multiple activities by applying the event at the summary level.
Once all our risk events are in the Risk Register, we can create a scenario and then run Risk Analysis to see the outcome.
Run Risk Analysis
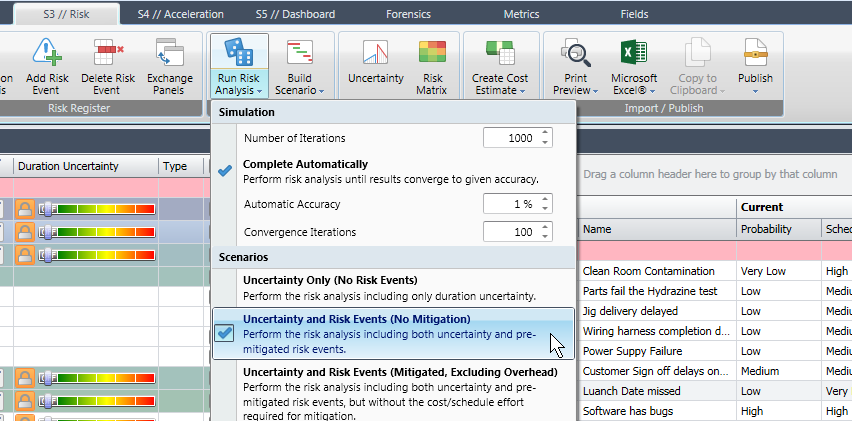
To run risk analysis, we click on the lower half of the Run Risk Analysis button on the tool ribbon. From this list we need to choose the most appropriate options. We’ll go with 1000 iterations and the ‘Uncertainty and Risk Events (No Mitigation).
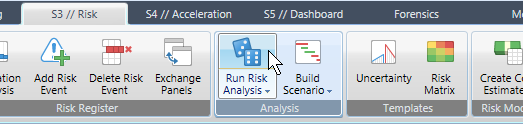
Having chosen our desired settings, we click the upper –half of the Run Risk Analysis button.
Acumen Risk will generate a graph showing the statistical chances of you hitting certain dates based upon your inputs.
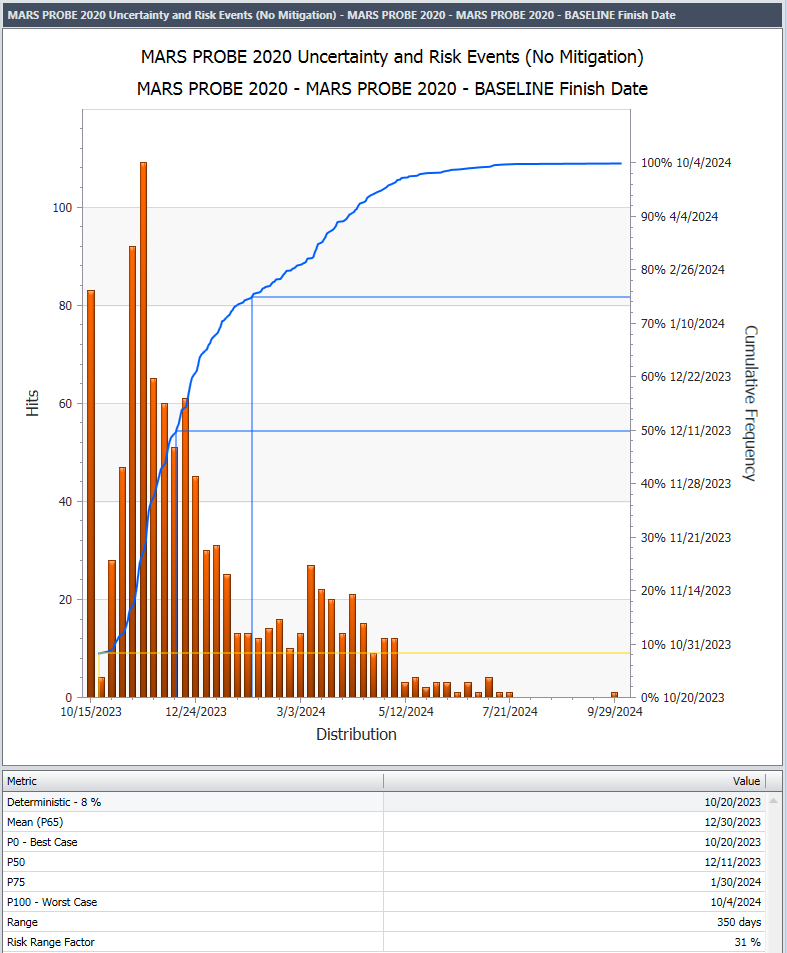
Using this graph and the Metric and Value columns below, you can see a range of dates and your statistical likelihood of achieving them based upon this 1000 iteration analysis.