Great! Your Deltek Acumen risk exposure histogram graph displays the probability of completing the project by a specific date. But which activities then should be risk mitigated to shorten the schedule? For this information look to the tornado plot.
Schedule risk analysis first and foremost is communicated in a histogram risk exposure graph. This graph provides the level of confidence of completing the project by a specific date. The graph includes both a histogram of project simulations and a curve of cumulative values across time up to a 100% confidence level.
This exposure histogram provides an efficient means of examining the project finish date. But to dive down further and analyze which specific activities are the main contributors to project risk turn to the tornado plot.
This article briefly introduces the tornado plot as an efficient mechanism for analyzing which tasks have the most to project risk associated with them.
We have in Figure 1 a histogram graph of a project.
 Figure 1
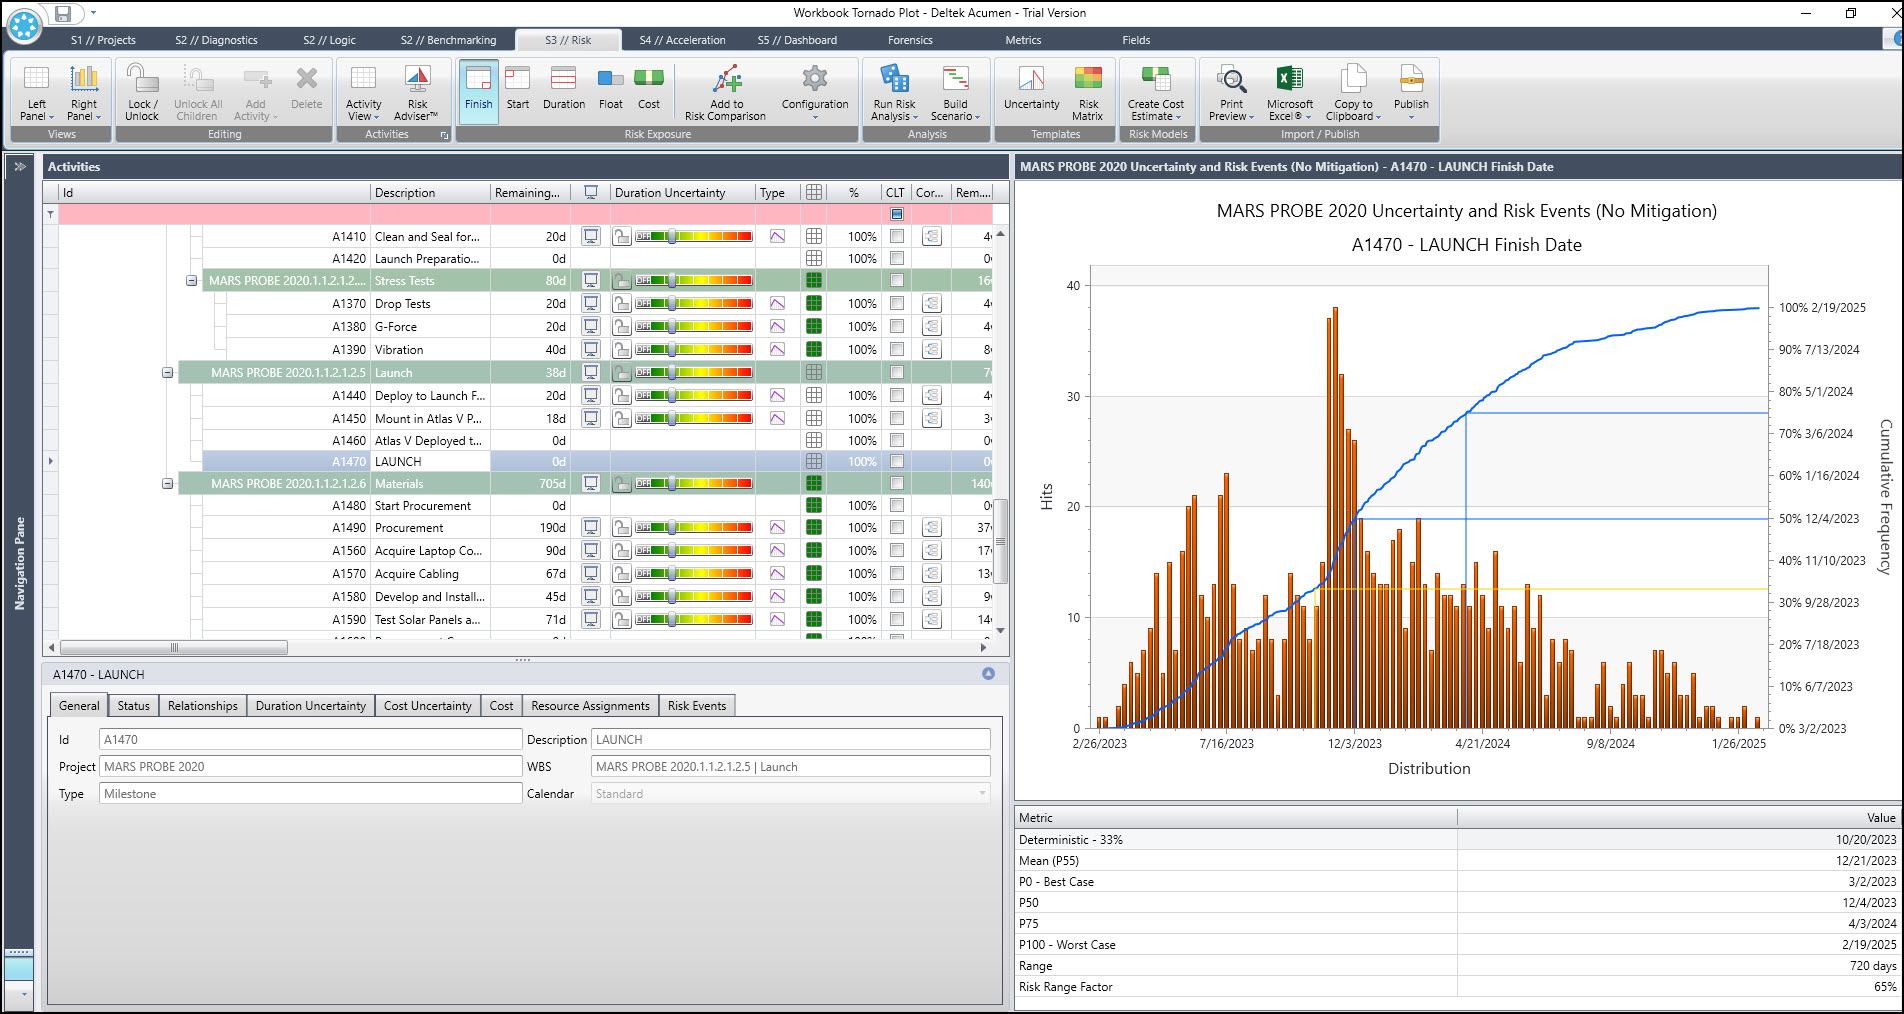
From this histogram graph we find the project finish date for a respective confidence level. This is critical information about the project, but the tornado plot goes further and prioritizes task project risk contributors affecting that project finish date. In Figure 2 we have an example tornado plot for a schedule.
Figure 2
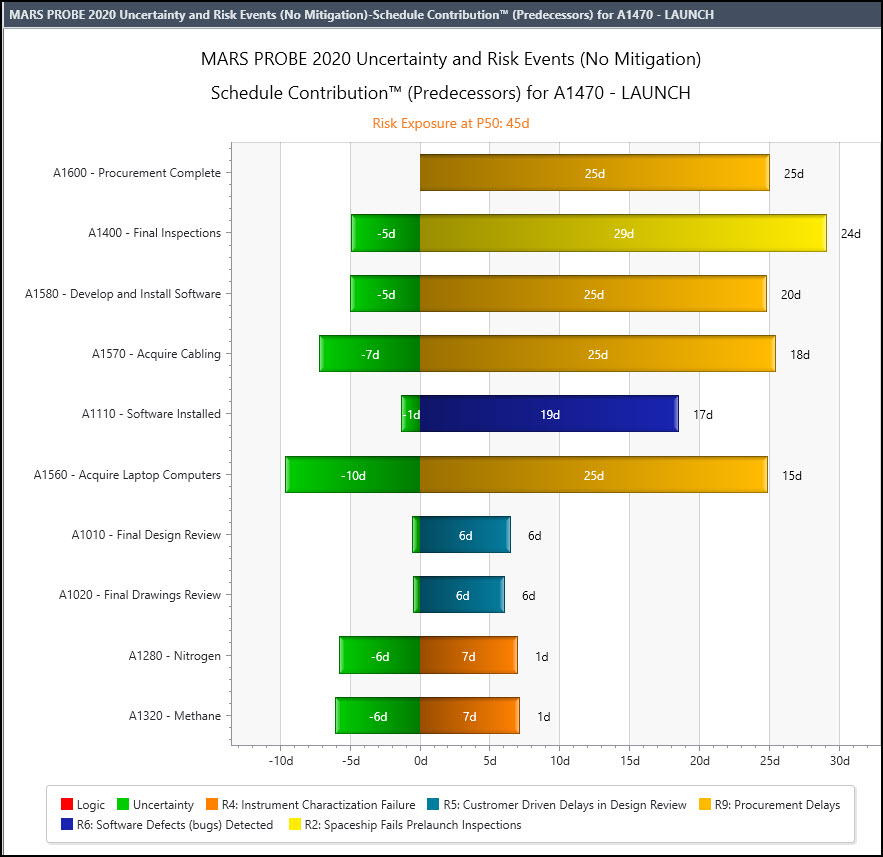
This tornado plot presents a concise analysis of the project risk contributors associated with the respective tasks. This plot prioritizes the major contributors to project schedule risk. Included are both the impact of duration uncertainty and risk events for each task arranged from most influential to least.
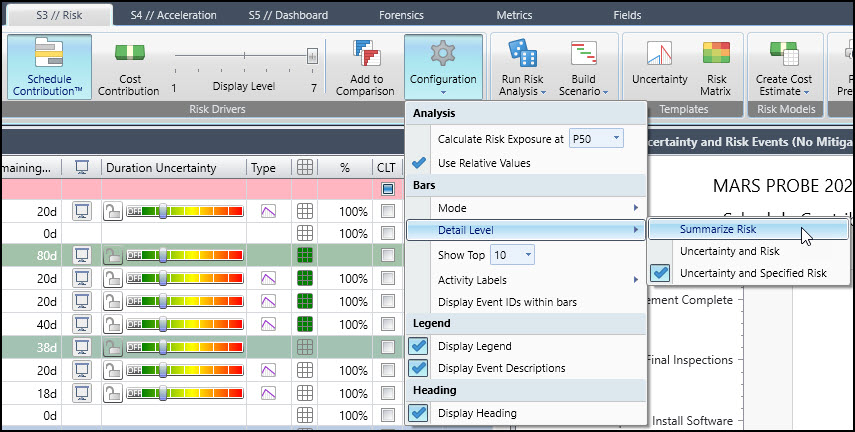
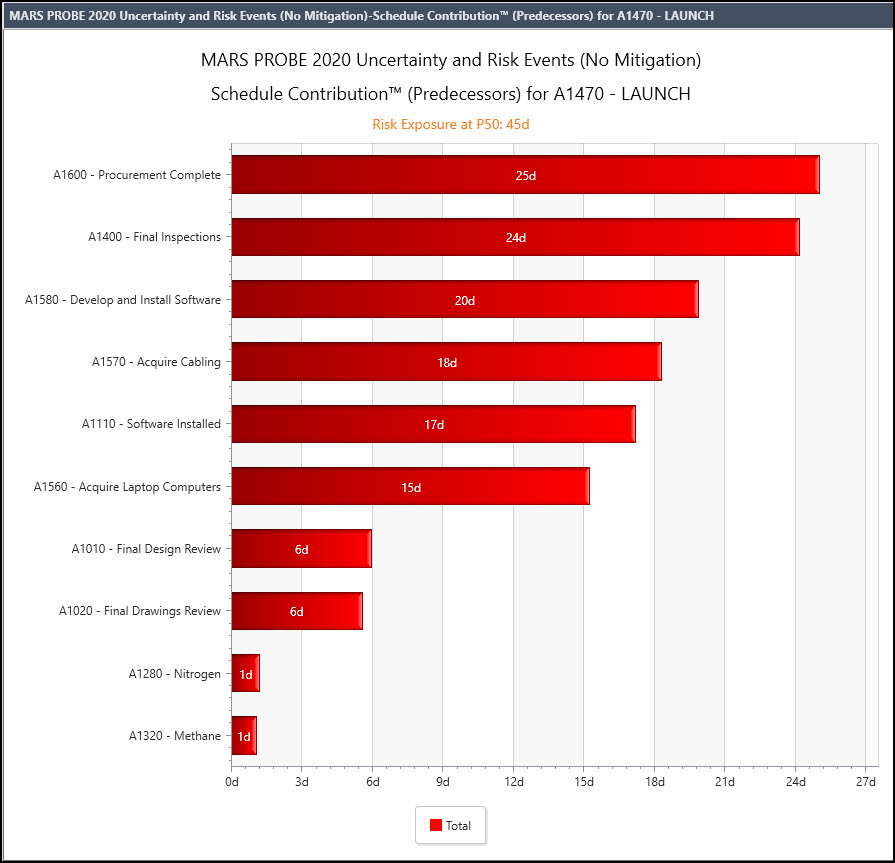
Note that duration uncertainty in this sample graph has a negative impact on schedule risk. This is because the duration estimates were very conservative. If they were aggressive their contribution would be positive. In Figure 3 we set the display level to summarize risk.
Figure 3
We then get the classic looking tornado plot in Figure 4.
Figure 4
We can further set the analysis to calculate risk exposure for specific confidence levels. In Figure 5 we set the probability to 80%.
Figure 5
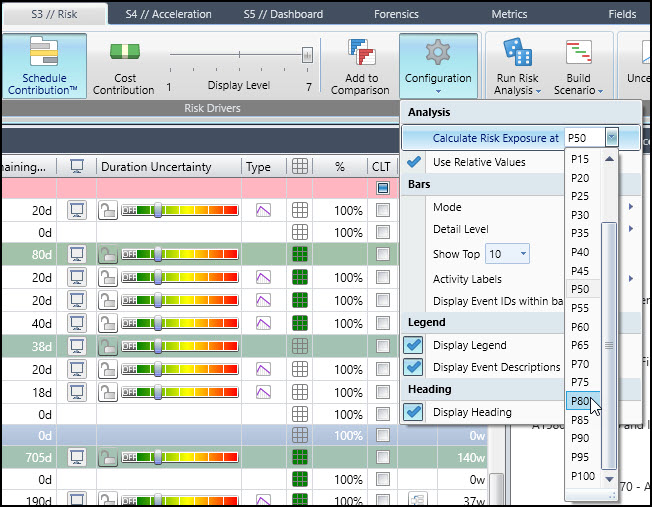
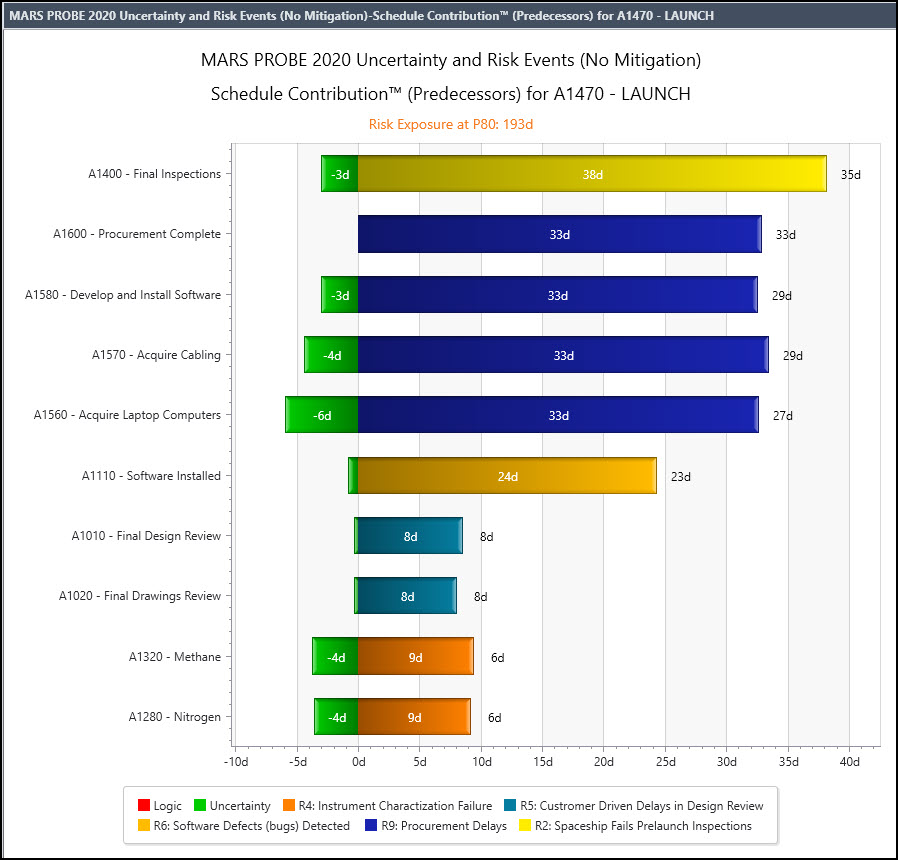
Figure 6 plots the task schedule risk contributors for an 80% confidence level.
Figure 6
Summary
The intent of schedule risk analysis tools is to identify schedule risk and implement effective measures to minimize the schedule impact. Deltek Acumen provides the tornado plot to efficiently analyze and prioritize task related schedule risk due to duration uncertainty and specific events.
The risk duration uncertainty and events may combine in a summary graph shaped very similar to a tornado. In this way, the scheduler may efficiently inspect tasks that are the major contributors of project risk. And this helps drive the effort to mitigate project risk.