Deltek Acumen Fuse diagnostics include a wealth of schedule custom metrics and standard metric groups. But you can also create and customize your own metric groups suited to your schedule analysis requirements. Deltek Acumen Fuse provides an abundance of project analysis and diagnostics tools to inspect and improve the quality of your schedule. Acumen comes with standard metric groups, including the Schedule Quality group, helpful for confirming the quality of your schedule before performing a Monte Carlo analysis for example.
It also comes with the Defense Contract Management Agency (DCMA) 14 Point group for reviewing the overall health of your project to the DCMA’s standards. Additionally, Acumen has features to support customizing your own group for a more personalized analysis of your schedule.
This article briefly explains the process of creating your own customized metrics group in Deltek Acumen Fuse.
Deltek Acumen Fuse Diagnostics
Below in Figure 1 is our demonstration project schedule imported to Acumen Fuse.
 Figure 1
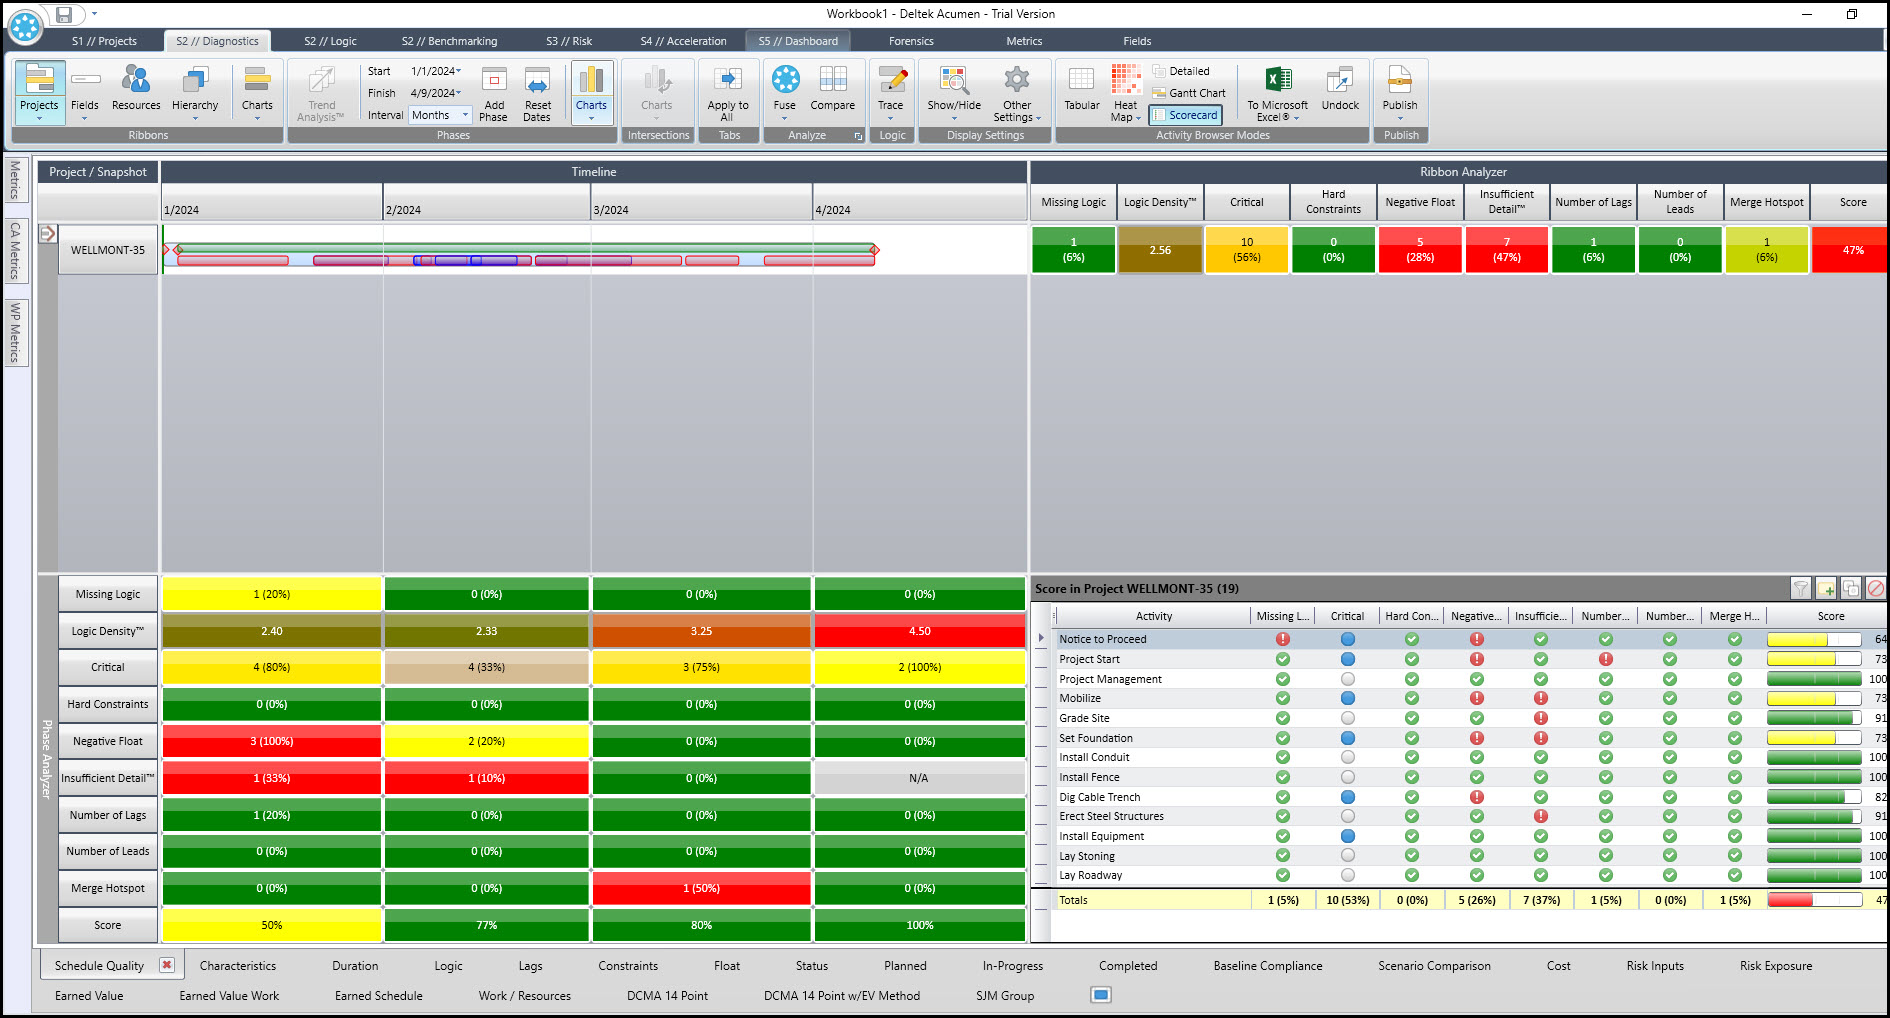
This figure displays the schedule in the S2 // Diagnostics tab after running a fuse Schedule Quality metric group. The Schedule Quality group provides a good overall review of schedule quality. But we want a group of metrics to specifically diagnose float issues in our schedule. There is no Float Diagnostics group in Acumen, so we have to create our own. So let’s proceed and create our own customized Float Diagnostics group.
We begin on the lower ribbon and select the icon that looks like a blue outlined rectangle, Figure 2.
Figure 2

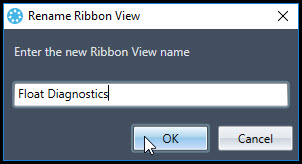
This creates a new ribbon view, Ribbon View ##. Right click on this view and select rename to enter a suitable title for this group, Figure 3.
Figure 3

We enter the appropriate title, Float Diagnostics, Figure 4.
Figure 4
The process now is to locate and add metrics to this Float Diagnostics group. On the upper left portion of the screen click Metrics, Figure 5.
Figure 5

The folder schedule quality includes all the metrics in the Schedule Quality group. Find and right click on ƒx Critical. In the popup menu, Figure 6, select add to all analyzers to include this metric in the ribbon analyzer and phase analyzer.
Figure 6

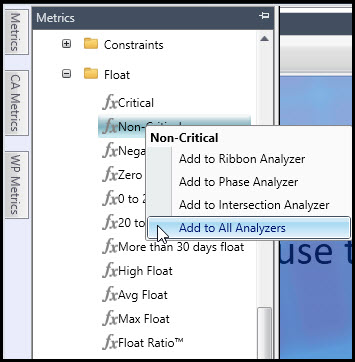
Continue and locate the ƒx Non-Critical metric. Again, right click and select add to all analyzers in the popup menu, Figure 7.
Figure 7
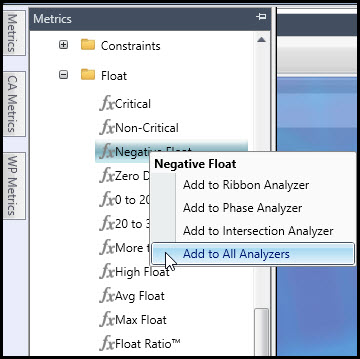
Additionally, find and add ƒx Negative Float metric to all analyzers, Figure 8.
Figure 8
Proceed and add several other suitable float diagnostics metrics. Finally, locate ƒx Constraint in the metrics constraint folder. Again, add this constraint metric to all analyzers, Figure 9.
Figure 9

After inserting all metrics for our Float Diagnostics group select the Float Diagnostics group in the bottom ribbon and run fuse. The Float Diagnostics analysis of our schedule displays in Figure 10.
Figure 10

Looks good, but we want to relocate the constraint metric. Hoover the cursor over the constraint metric in the ribbon analyzer, Figure 11, and left click and drag to a more suitable location.
Figure 11
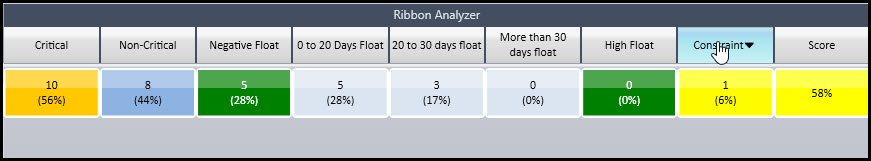
The final Float Diagnostics analysis is exhibited in Figure 12.
Figure 12
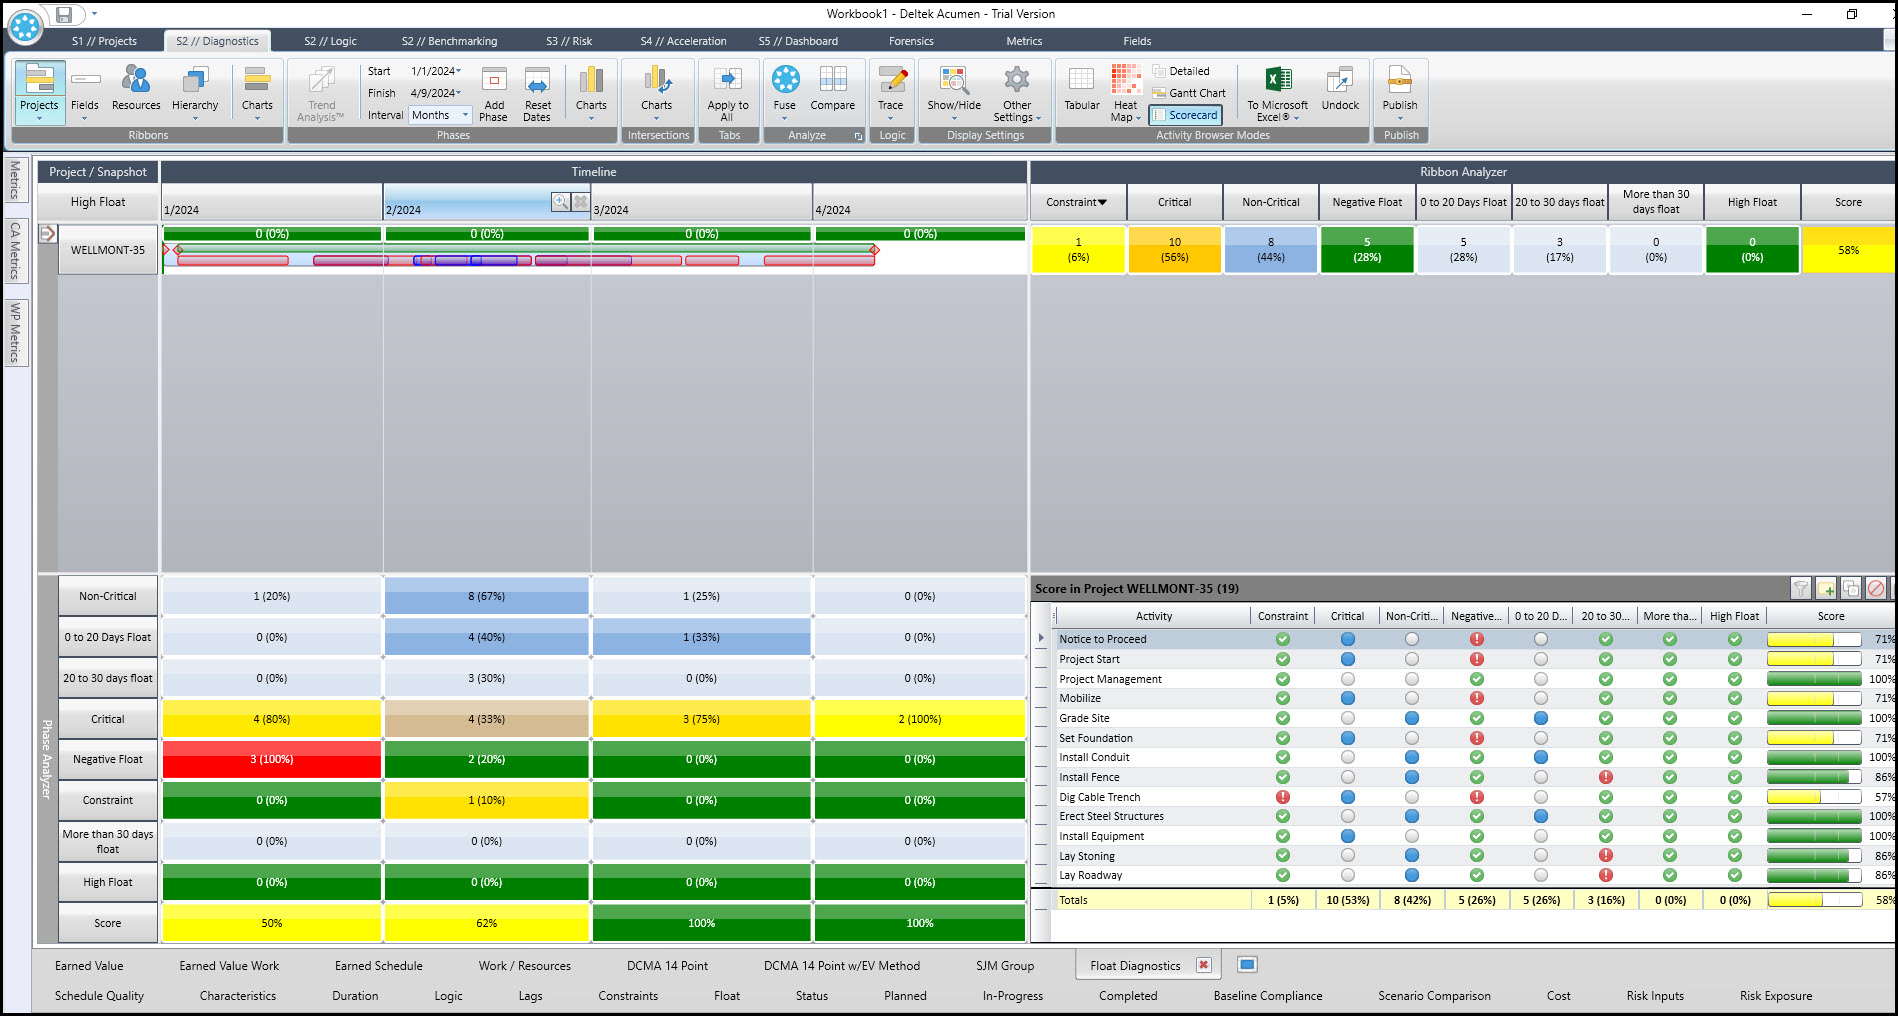
Left click on the score value to generate the lower score report displayed in Figure 12.
Summary
Deltek Acumen Fuse diagnostics comes with many metrics to analyze all aspects of schedule quality. This includes both the Schedule Quality and DCMA 14 Point metric groups, and a range of other Industry Standards such as GAO and NASA Health Check.
Additionally, Acumen Fuse has features to support customization of a personalized metric group. In this way schedulers can analyze and report on specific schedule quality metrics suited to their unique requirements.