Wouldn’t it be great to be able to compare your project schedule to a wealth of historical schedules in a database? This is possible using the Deltek Acumen benchmarking feature.
Ever wondered how the quality of your organization’s project schedules stacks up against other companies in your industry? Deltek Acumen Fuse has the option to check your schedule against a wide selection of other similar project schedules with its unique Acumen benchmarking feature. In this way schedulers can examine a schedule’s probability of success based on comparison to a wealth of historical schedule data.
This article introduces the Acumen benchmarking feature to help gauge a schedule’s potential for success.
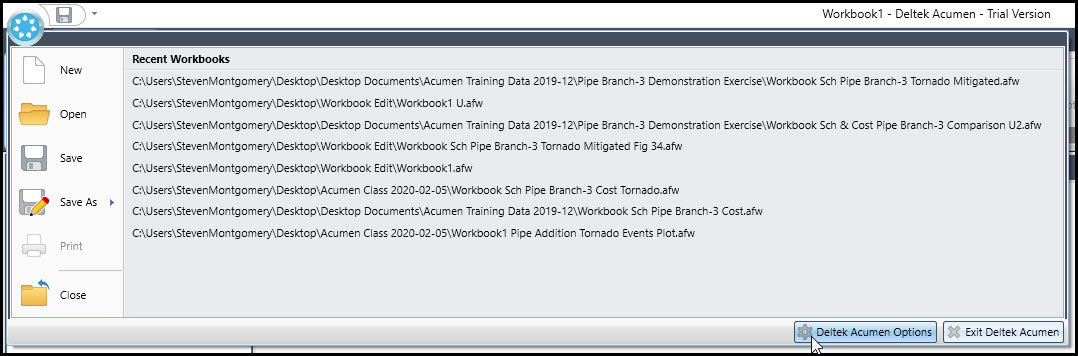
The first thing to do if you want to use Deltek Acumen’s benchmarking, is to opt in to anonymous benchmarking in the Deltek Acumen Options. Proceed and click the Acumen home button and click Deltek Acumen Options, Figure 1.
 Figure 1
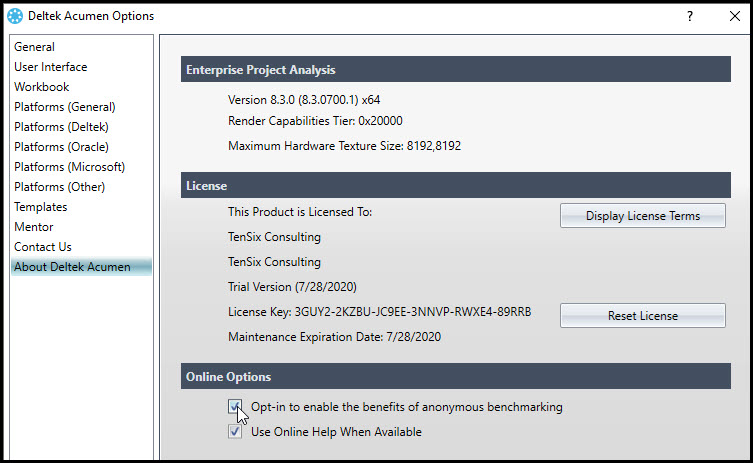
At the bottom of the Deltek Acumen Options page, select the ‘Opt-in to enable the benefits of anonymous benchmarking’, Figure 2.
Figure 2
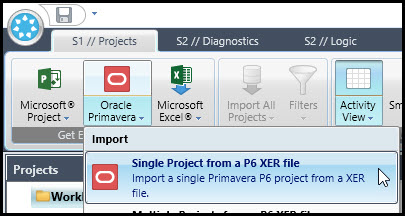
Now that you have opted in to anonymous benchmarking you can see how your schedules compare up against a wide range of schedules within your industry or in general. We begin by first choosing a single project from a P6 XER file, Figure 3.
Figure 3
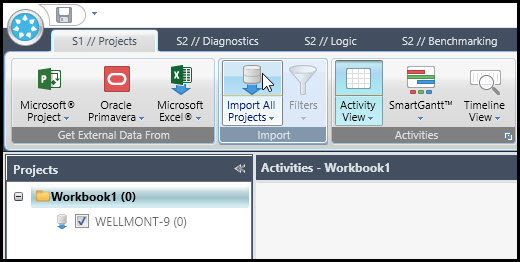
Continue by importing this schedule into Acumen, Figure 4.
Figure 4
In Figure 5 we have our imported project schedule.
Figure 5
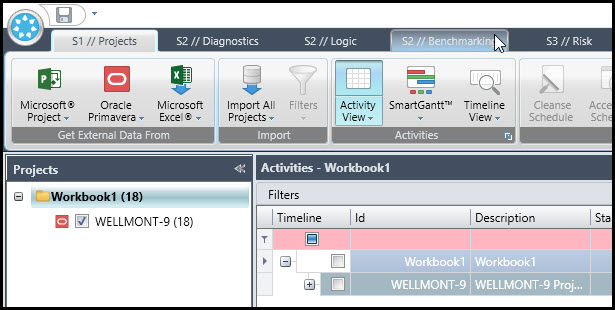
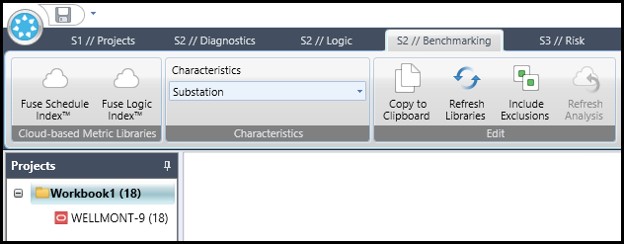
Now choose the S2 // Benchmarking tab, again, Figure 5. You then have the option to choose between two cloud-based metric libraries, and set the characteristics, Figure 6.
Figure 6
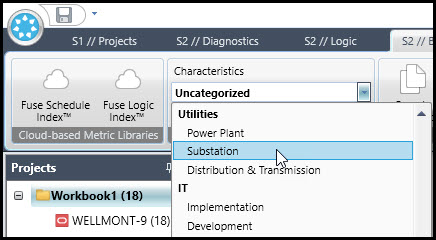
We elect the Utility Substation characteristics and Acumen Fuse Schedule index and for our substation project schedule, Figure 6. Our benchmark results display in Figure 7.
Figure 7
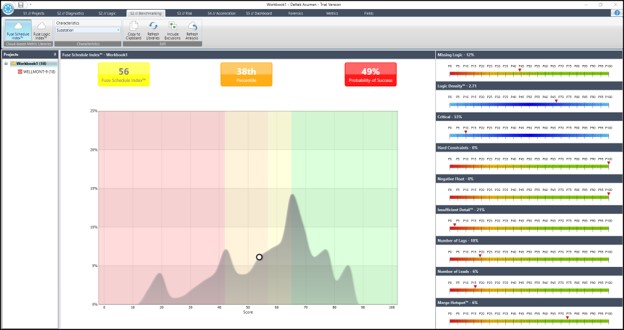
The substation schedule has achieved a Fuse Schedule Index of 56, which has placed it in the 38th percentile with a 49% probability of success. Not good. Our Fuse Schedule Index results tell us we need to examine how to improve the quality of our schedule.
Metrics included in the analysis are displayed on the right and include the schedule quality diagnostics metrics: missing logic, logic density, hard constraints, negative float, insufficient detail, number of lags, number of leads, and merge hotspot.
We continue using our Substation characteristics and perform a Fuse Logic Index analysis. The logic quality index is considered one of the most important underpinnings of a schedule and includes the following metrics: redundancy index, open ends, open starts, open finishes, leads, lags, and start-to-finish links. Our Acumen Fuse Logic results display in Figure 8.
Figure 8
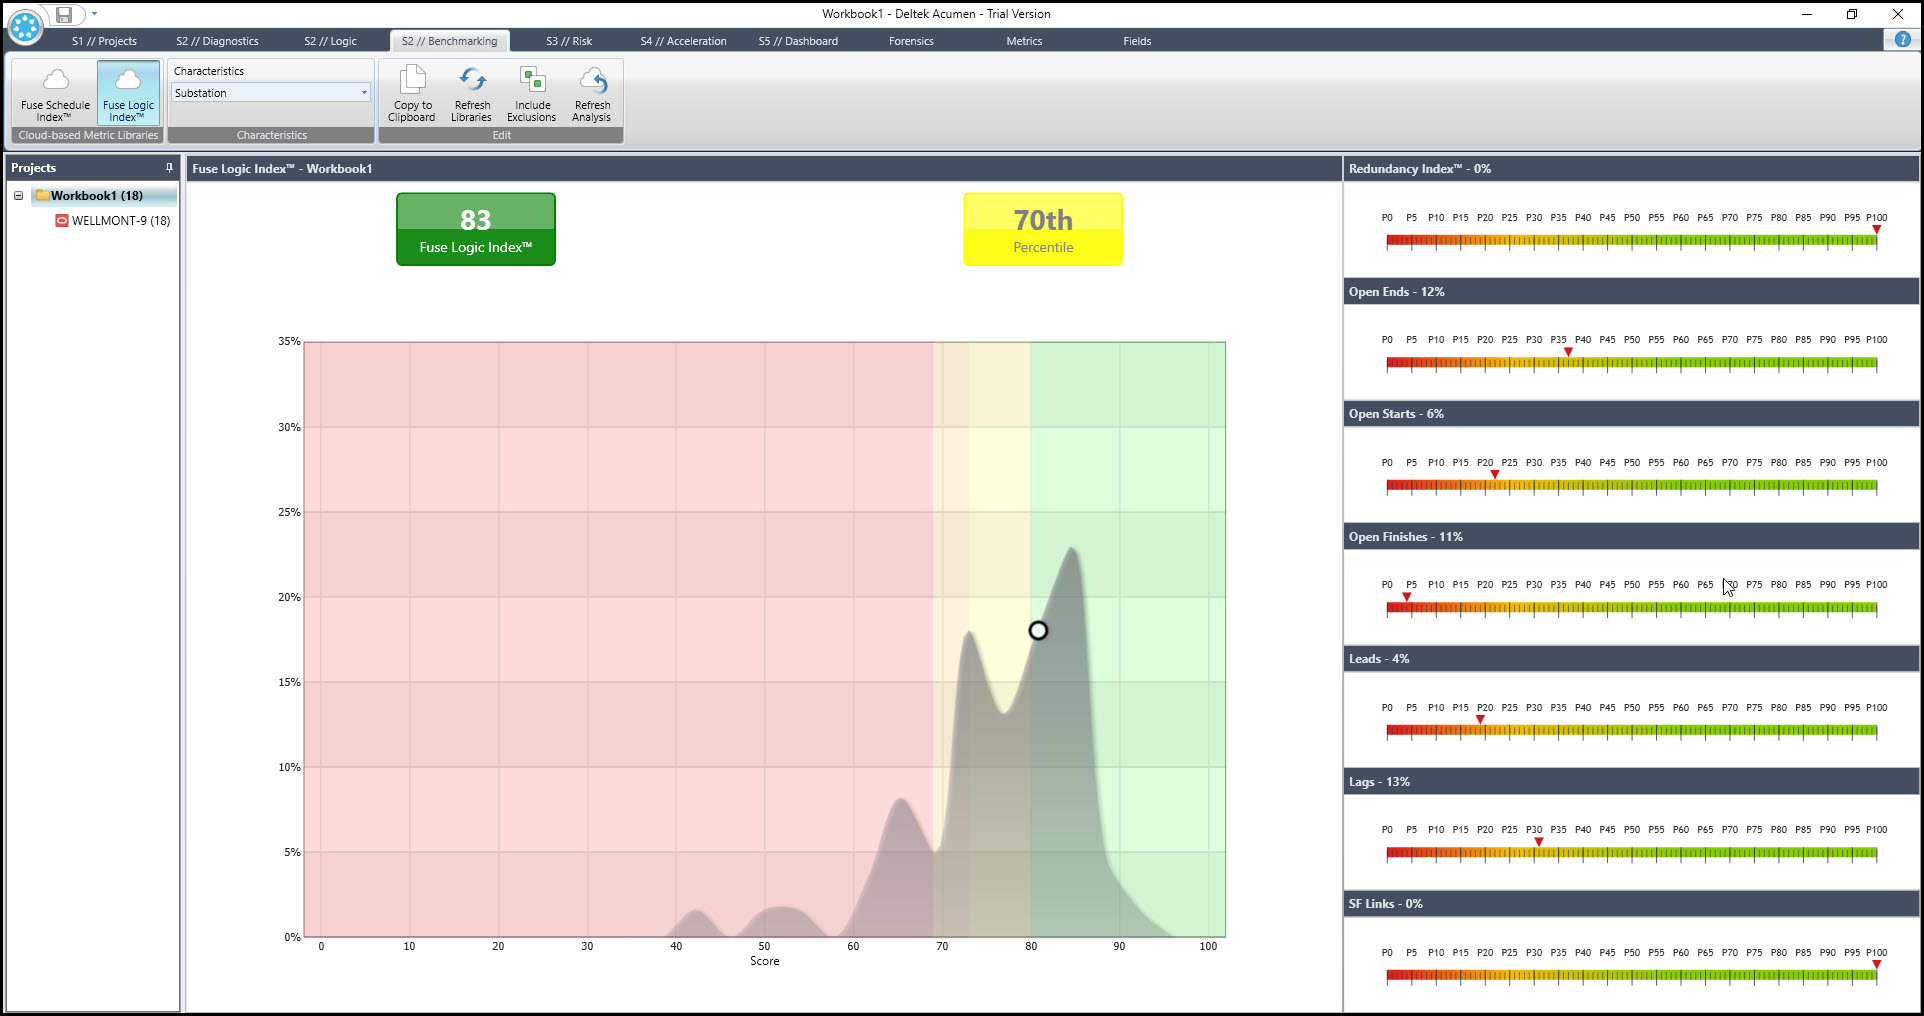
This time we see the Fuse Logic Index has calculated a score of 83, placing this project in the 70th percentile of all other Substation related projects in the Acumen anonymous cloud.
Another feature to note is refresh libraries which clears the screen to make it ready to run another Fuse Schedule Logic or Logic Indexing process, Figure 9.
Figure 9
Another edit option displayed in Figure 9, include exclusions, causes the analysis to run benchmarking and ignore any excluded activities, marked as such in the S2 // Diagnostics tab.
Summary
The Acumen benchmarking feature provides a method for comparing project analytics against a global database of similar projects. These comparisons can be of a general nature using the Fuse Schedule Index tool or more specific to relationship logic with the Fuse Logic index. You can further categorize the projects by industry type.